ISSN/$–see front matter © 2013 Sociedade Brasileira de Ortopedia e Traumatologia. Published by Elsevier Editora Ltda. All rights reserved. www.rbo.org.br/
*Corresponding author: Av. Roberto Silveira 187/601, Centro, CEP 25685-040, Petrópolis, RJ, Brazil. E-mail: [email protected].
article info
Article history:
Received on May 20, 2012 Accepted on July 23, 2012
Keywords: Vitamin D Osteoporosis Bone density Fractures, bone
Original Article
Vitamin D and its Relation to Bone Mineral Density in
Postmenopause Women
Pedro José Labronici,
1,*Saulo Santos Blunck,
2Flavius Ribeiro Lana,
2Bruno Bandeira Esteves,
2José Sergio Franco,
3Junji Miller Fukuyama,
4Robinson Esteves Santos Pires
51PhD in Medicine at Escola Paulista de Medicina, at Universidade Federal de São Paulo; Clinical Head of the Orthopedics and Traumatology
Service of Prof. Dr. Donato D’Ângelo, Hospital Santa Teresa, Petrópolis, RJ, Brazil
2Resident Physician of the Orthopedics and Traumatology Service of Prof. Dr. Donato D’Ângelo, Hospital Santa Teresa, Petrópolis, RJ, Brazil 3Head of Department, Associate Professor and Doctor of the Orthopedics and Traumatology Service of the Department of the Medical School
at UFRJ, Rio de Janeiro, RJ, Brazil
4Head of the Trauma Group of the Hospital Geral Vila Penteado, São Paulo, SP, Brazil
5Assistant Professor of the Department of the Locomotor System of the Universidade Federal de Minas Gerais and Coordinator of the
Specialization Course in Orthopedics and Traumatology of the Hospital Felício Rocho, Belo Horizonte, MG, Brazil
Work performed at the Orthopedics and Traumatology Service of Prof. Dr. Donato D’Ângelo, Hospital Santa Teresa, Petrópolis, RJ, and in the Medical School of Petrópolis, RJ, Brazil
doi: 10.1016/j.rbo.2012.07.004
a b s t r a c t
Objective: Compare the level of vitamin D with the bone mineral density (BMD) in postmenopausal women, with or without fractures. Methods: 250 women with mean age of 71.1 were evaluated. The serum levels of vitamin D considered sufficient were ≥ 30 ng/mL, insufficient between 20 and 30 ng/mL and deficient < 20 ng/mL. The bone mineral density was measured and considered osteopenia when T value total of lumbar spine or hip was between -1 and -2.5 and osteoporosis < 2.5. The patients with fractures accounted for 25.2%. Results: There was no significant difference in the vitamin D (ng/mL) levels among the age groups (p = 0.25), the levels of fractures (p = 0.79) and the levels of BMD (p = 0.76). Conclusion: 82% of the patients presented deficient and insufficient blood levels of vitamin D. Ours results showed any significant correlation between vitamin D levels and bone mineral density after adjusting for age.
Introduction
The loss of bone density in postmenopausal women has been linked to a subclinical deficiency in vitamin D, which is considered to be a risk factor for fractures due to the susceptibility of this population to falls and inappropriate neuromuscular responses.1-4 Vitamin D insufficiency can
result from nutritional deficiency and/or low sun exposure in confined elderly patients and inpatients with chronic diseases.5-8
Studies have shown that female patients who ingest high levels of calcium exhibit high bone mineral density when compared to female patients with low calcium ingestion. Vitamin D and calcium supplements aid in the prevention of bone loss by reducing bone renewal and the number of non-vertebral fractures.9
Supplemental vitamin D and calcium (500-1,200 mg/d) seems to reduce the risk of secondary hyperparathyroidism due to vitamin D insufficiency.10 Vitamin D is absorbed through two mechanisms: the activation of the 7-dehydrocholesterol pathway in the skin by sunlight and the intestinal absorption of the vitamin D in food. The appropriate serum level of vitamin D is approximately 30 to 55 ng/mL. Values below 20 ng/mL are considered to be deficient and levels in the 20 to 30 ng/mL range are considered inappropriate.11,12
The objective of this paper was to compare the vitamin D levels and BMD of postmenopausal women with or without fractures.
Materials and Methods
Two hundred fifty women with a mean age of 71.1 years old (45 to 98) were evaluated between January 2010 and December 2011. The included patients were postmenopausal women who had reached menopause two years before and had received a bone densitometry scan at least six months prior to the initial visit. The women underwent analysis to determine their vitamin D level and were not using a corticosteroid. The serum vitamin D levels were measured by electrochemiluminescence; values ≥ 30 ng/mL were considered normal, values between 20 and 30 ng/mL were considered insufficient and values < 20 ng/mL were considered deficient. The patients’ BMD in the region of the hips and the lumbar spine was measured with GER’s Lunar Prodigy Advance Densitometer with fan bean technology. The hip densitometry measurement included the trochanter, the femur neck and the intertrochanteric region. The lumbar spine densitometry measurement included the lumbar vertebrae L1- L4. The included software calculated the T and Z values relative to North-American reference values. Osteopenia was defined as a T-score between -1 and -2.5 at the lumbar spine or hips and osteoporosis was defined as a T-score < -2.5.
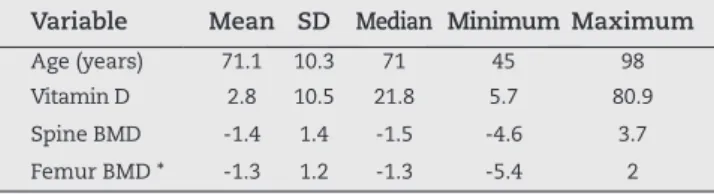
The sample characterization was aimed at developing a general profile of the 250 female patients studied. Table 1 shows the mean, the standard deviation (SD), the median,
Variable Mean SD Median Minimum Maximum
Age (years) 71.1 10.3 71 45 98 Vitamin D 2.8 10.5 21.8 5.7 80.9 Spine BMD -1.4 1.4 -1.5 -4.6 3.7 Femur BMD * -1.3 1.2 -1.3 -5.4 2 SD: Standard Deviation. * corresponds to the lower BMD value in the bilateral cases. Source: Hospital Santa Teresa, Petrópolis, RJ. Table 1 - General Description of Numeric Variables.
and the minimum and maximum numeric variables. Table 2 provides the frequency (n) and the percentage (%) of the categorical variables.
Statistical Methodology
The tables summarize the data observed, which were expressed as the frequency (n) and percentage (%) for categorical (qualitative) data and as the mean, standard deviation, median and the minimum and maximum for numeric data.
The statistical analysis consisted of the following methods:
- the numeric variables for two subgroups were compared using the Student’s t test for independent samples or the Mann-Whitney test; comparisons among three subgroups were analyzed using a one-way ANOVA or the Kruskal-Wallis Anova test (non-parametric). Tukey’s or Dunn’s multiple comparison tests (non-parametric) were applied to identify which groups were significantly different from each other at the level of 5%, and
- the categorical variables for the subgroups were compared using the χ2 test.
Variable Category n %
Age (years)
45 to 49 4 1.6
50 to 59 28 11.2
60 to 69 76 30.4
70 to 79 89 35.6
80 to 89 45 18.0
90 to 99 8 3.2
Fracture yes 63 25.2
no 187 74.8
Vitamin D (classification)
≤ 20 94 37.6
21 to 29 111 44.4
≥ 30 45 18.0
BMD (classification)
normal 58 23.2
osteopenia 114 45.6
78 31.2
Source: Hospital Santa Teresa, Petrópolis, RJ.
Non-parametric tests were applied because some variables did not present a normal distribution (Gaussian); due to data dispersion, the null hypothesis was rejected according to the Kolmogorov-Smirnov test. Significance was defined at the level of 5%. SAS 6.11 (SAS Institute, Inc., Cary, North Carolina, USA) software was used to complete the statistical analysis.
Results
The first objective was to verify if there were significant differences between fracture status (present or not), vitamin D level (deficient, insufficient and sufficient) and BMD (normal, osteopenia and osteoporosis) with relation to the mean age of the patients (in years).
Table 3 summarizes the mean ± standard deviation (SD) of the patients’ age based on the fracture status, vitamin D level and BMD and the corresponding p values calculated by the appropriate statistical test.
The statistical analysis utilized the Student’s t test for independent samples to compare two categories (levels) or the one-way Anova to compare three categories. Tukey’s multiple comparison test was used to identify which categories were significantly different from each other at a level of 5%.
Subgroup Category n Mean ± SD p valuea
Fracture yes 63 75.3 ± 11.5 0.0002
no 187 69.7 ± 9.5 BMD
(classification)
normal 58 68.4 ± 10.4
0.0001
osteopenia 114 69.6 ± 9.7 osteoporosis 78 75.3 ± 10.0
Vitamin D (classification)
deficiency 94 72.6 ± 10.5
0.13 insufficient 111 69.7 ± 9.6
sufficient 45 71.5 ± 11.3
aStudent’s t test for independent samples or one-way Anova. Table 3 - Mean patient age (years) for each of the fracture, vitamin D3 and BMD categories.
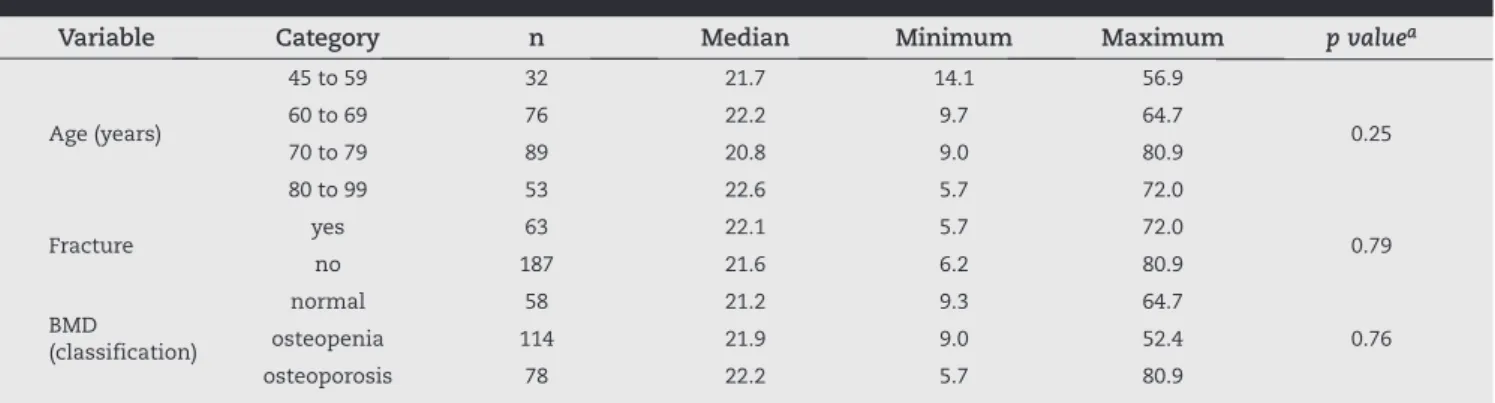
Variable Category n Median Minimum Maximum p valuea
Age (years)
45 to 59 32 21.7 14.1 56.9
0.25
60 to 69 76 22.2 9.7 64.7
70 to 79 89 20.8 9.0 80.9
80 to 99 53 22.6 5.7 72.0
Fracture yes 63 22.1 5.7 72.0 0.79
no 187 21.6 6.2 80.9
BMD (classification)
normal 58 21.2 9.3 64.7
0.76
osteopenia 114 21.9 9.0 52.4
osteoporosis 78 22.2 5.7 80.9
aMann-Whitney test or Kruskal-Wallis Anova. Source: Hospital Santa Teresa. Petrópolis. RJ.
Table 4 - Vitamin D level (ng/mL) for each age group, fracture status and BMD category.
The mean age of the subgroup of patients with fractures was significantly higher than the mean age of the subgroup without fractures (p = 0.0002). The mean ages of the patients with differing BMD levels were also significantly different (p = 0.0001). The mean age of the subgroup of patients with osteoporosis was significantly higher than the mean ages of the subgroups with normal BMD and osteopenia.
There was no significant difference in the mean age of patients with different vitamin D levels (p = 0.13).
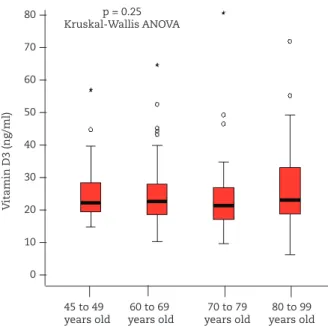
The second objective was to verify if there was significant difference in the vitamin D levels (in ng/mL) of the patients with different ages, fracture statuses and BMD levels. Table 4 summarizes the median, the minimum and maximum vitamin D levels (ng/mL) for each age group (45 to 59, 60 to 69, 70 to 79 and 80 to 99 years old), fracture status (present or not) and BMD level (normal, osteopenia and osteoporosis) and the corresponding p value of the statistical test used for the comparison.
The statistical analysis utilized the Mann-Whitney test to compare two categories (levels) or the Kruskal-Wallis Anova to compare three categories. Dunn’s multiple comparison test was used to identify which categories were significantly different from each other at a level of 5%.
There were no significant differences in the vitamin D levels (ng/mL) among the age groups (p = 0.25), the fracture status (p = 0.79) or the BMD levels (p = 0.76) (Fig. 1).
The third objective sought to identify whether there was significant association among the following variables: age group, fracture status, vitamin D level and BMD. Tables 5, 6, 7 and 8 provide the frequency (n) and the percentage (%) of the contingency tables for the four variables studied and the corresponding p value of the χ2 test. The analyses were repeated
and are only presented if the results differed.
Age group was significantly associated with the presence of fracture (p < 0.0001) and osteoporosis (p = 0.006).
The presence of fracture was significantly associated with age group (p < 0.0001) and osteoporosis (p = 0.011).
Variable Category 45 to 59 years old 60 to 69 years old 70 to 79 years old 80 to 99 years old p valuea
n % n % n % n %
Fracture yes 7 21.9 12 15.8 19 21.4 25 47.2 < 0.0001
no 25 78.1 64 84.2 70 78.7 28 52.8
Vitamin D (classification)
deficiency 10 31.3 26 34.2 39 43.8 19 35.9
0.22
insufficient 16 50.0 36 47.4 40 44.9 19 35.9
sufficient 6 18.8 14 18.4 10 11.2 15 28.3
DMO (classification)
normal 12 37.5 19 25.0 19 21.4 8 15.1
0.006
osteopenia 15 46.9 40 52.6 41 46.1 18 34.0
osteoporosis 5 15.6 17 22.4 29 32.6 27 50.9
a χ2 test. Source: Hospital Santa Teresa, Petrópolis, RJ.
Table 5 – Association between each of the variables and age.
Variable Category With Fracture Without Fracture p valuea
n % n %
Age (years)
45 to 59 7 11.1 25 13.4
< 0.0001
60 to 69 12 19.1 64 34.2
70 to 79 19 30.2 70 37.4
80 to 99 25 39.7 28 15.0
Vitamin D (classification)
deficiency 23 36.5 71 38.0
0.82
insufficient 27 42.9 84 44.9
sufficient 13 20.6 32 17.1
BMD (classification)
normal 7 11.1 51 27.3
0.011
osteopenia 29 46.0 85 45.5
osteoporosis 27 42.9 51 27.3
a χ2 test. Source: Hospital Santa Teresa, Petrópolis, RJ.
Table 6 - Association between each of the variables and fracture status.
Fig. 1- Relationship between vitamin D level and age. Fig. 2 - Vitamin D levels for each BMD category.
normal osteopenia osteoporosis
V
itamin D3 (ng/ml)
p = 0.76 Kruskal-Wallis ANOVA p = 0.25
Kruskal-Wallis ANOVA 80
70 60 50 40 30 20 10 0
---V
itamin D3 (ng/ml)
45 to 49 60 to 69 70 to 79 80 to 99 years old years old years old years old
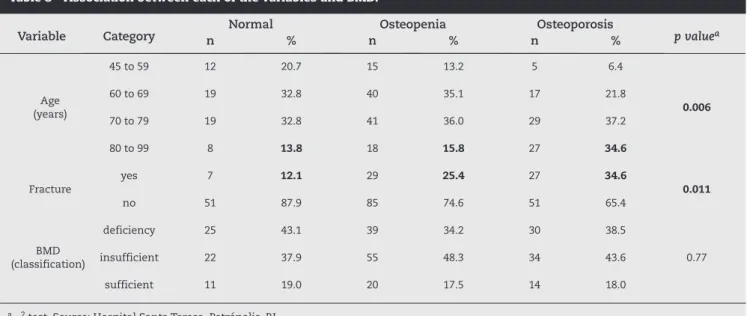
---Variable Category Normal Osteopenia Osteoporosis p valuea
n % n % n %
Age (years)
45 to 59 12 20.7 15 13.2 5 6.4
0.006
60 to 69 19 32.8 40 35.1 17 21.8
70 to 79 19 32.8 41 36.0 29 37.2
80 to 99 8 13.8 18 15.8 27 34.6
Fracture
yes 7 12.1 29 25.4 27 34.6
0.011
no 51 87.9 85 74.6 51 65.4
BMD (classification)
deficiency 25 43.1 39 34.2 30 38.5
0.77
insufficient 22 37.9 55 48.3 34 43.6
sufficient 11 19.0 20 17.5 14 18.0
a χ2 test. Source: Hospital Santa Teresa, Petrópolis, RJ.
Table 8 - Association between each of the variables and BMD.
Variable Category Deficient Insufficient Sufficient p valuea
n % n % n %
Age (years)
45 to 59 10 10.6 16 14.4 6 13.3
0.22
60 to 69 26 27.7 36 32.4 14 31.1
70 to 79 39 41.5 40 36.0 10 22.2
80 to 99 19 20.2 19 17.1 15 33.3
Fracture
yes 23 24.5 27 24.3 13 28.9
0.82
no 71 75.5 84 75.7 32 71.1
BMD (classification)
normal 25 26.6 22 19.8 11 24.4
0.77
osteopenia 39 41.5 55 49.6 20 44.4
osteoporosis 30 31.9 34 30.6 14 31.1
a χ2 test. Source: Hospital Santa Teresa, Petrópolis, RJ.
Table 7 - Association between each of the variables and vitamin D level.
Osteoporosis was significantly associated with age group (p = 0.006) and the presence of fracture (p = 0.011).
Discussion
Vitamin D is extremely important for calcium absorption. When serum vitamin D levels decrease, the parathyroid hormone level increases and calcium absorption decreases. Vitamin D is absorbed through two mechanisms: the activation of the 7-dehydrocholesterol pathway in the skin by sunlight and intestinal absorption from the diet. Although vitamin D deficiency is relatively rare in the healthy young population, this deficiency is common
in the elderly population, especially among inpatients or individuals who live in countries where sunlight is limited.12
measure serum vitamin D levels at all ages, as deficient and insufficient levels may accelerate bone deterioration and cause osteoporosis.
The link between vitamin D and bone mineral density is still being discussed. An evaluation of the vitamin D level in patients with osteoporosis is essential for two reasons. First, vitamin D deficiency in patients with osteoporosis causes demineralization that may reduce bone mass.13,14
Second, it is important to achieve suitable levels of vitamin D in patients with osteoporosis to maximize the response to antiresorptive therapy, facilitate changes in bone mineral density and efficiently manage fractures.15 Several studies
have suggested that low serum vitamin D levels are associated with low bone mineral density.16-18
Bischoff-Ferrari et al.19 found a positive relationship between vitamin
D levels and bone mineral density in young Caucasians and elderly men. However, other studies have not supported this association.20-22 The heterogeneity of the results can
be partially explained by ethnic differences in the patient populations and differing age groups, as well as by the fact that the studies focused on different regions of the human body. Garnero et al.23 and Allali et al.24 were unable to show
a significant correlation between vitamin D levels and bone mineral density. Rassouli et al.25 found a correlation with
the bone mineral density of the spine, but not the hips. Sadat-Ali et al.26 found that most patients with vitamin D
insufficiency exhibit low bone mass and that all patients with vitamin D deficiency have bone mineral densities varying between osteopenia and osteoporosis. This group also found a correlation between vitamin D levels and bone mineral density in most patients, particularly those groups exhibiting insufficiency and deficiency. The authors emphasized the importance of measuring vitamin D levels in patients with low bone mass instead of relying only on bone densitometry. Bandeira et al.27 found vitamin
D deficiencies in healthy postmenopausal women of all ages during routine doctor’s appointments. The authors concluded that those individuals exhibiting vitamin D levels lower than 25 ng/mL were elderly patients who had reached menopause a long time ago. These patients also exhibited low bone mineral density on the femur neck and high levels of parathyroid hormone. This study indicated that 91.1% of the patients with osteopenia exhibited deficient and insufficient serum vitamin D levels (41.5% and 49.6%, respectively) and that 62.5% of the patients with osteoporosis exhibited deficient and insufficient serum vitamin D levels (31.9% and 30.6%, respectively). However, 46.4% of the normal patients exhibited deficient and insufficient serum vitamin D levels (26.6% and 19.8%, respectively). It is worth mentioning that all of the women in this study were Caucasians from the same region (latitude and altitude).
Recent evidence has indicated that sun exposure does not guarantee a healthy vitamin D level. Brinkley et al.28 evaluated
93 young adults from Hawaii who experienced sun exposure without protection for more than 20 hours per week, finding that 51% of the individuals studied exhibited inappropriate levels of vitamin D (< 30 ng/mL). Because Brazil is a tropical country, the population is expected to have adequate vitamin
D levels. However, two studies conducted in elderly patients in the southeastern region of the country (latitude 20-30°S) found a high prevalence of vitamin D deficiency.29-32
Vitamin D deficiency is present in all regions, but is higher in southern Asia and the Middle East.33 In our study, we
analyzed well nourished Caucasian women who had reached menopause two years before commencement of the study who lived in the same region (22° 30’ 16.70”S latitude, 43° 10’ 56.38”W longitude in a region with a highland tropical climate) in a city lying 838 meters above the sea level. The study results indicated that 37.6% of the patients exhibited deficient serum vitamin D levels. Eighty-two percent of the patients had insufficient and deficient serum vitamin D levels. In the United States of America, the results of the National Health and Nutrition Examination Survey registered deficient vitamin D values in 30% of the patients studied, with 70% of those studied falling into the insufficient and deficient categories.34 Patton et al.35 reported that, regardless of the
cut-off value, vitamin D levels were relatively low in women when compared with men and low in the Hispanic and Afro-descendant population when compared with the Caucasian population.
Hypovitaminosis D has been identified in patients with orthopedic pathologies, especially fractures. Several authors have reported vitamin D insufficiency after orthopedic surgeries, with prevalence varying from 15 to
24%.36,37 Approximately 80% of patients in an Australian
hip fracture study presented with insufficient vitamin D levels, with more than 30% of these patients also exhibiting secondary hyperparathyroidism.38 Despite the
fact that the results of this study were not statistically significant, 42.9% of the patients with fractures exhibited vitamin D insufficiency.
It is worth mentioning that this research did not investigate parathyroid hormone levels, which could confound the bone density evaluation (secondary hyperparathyroidism) and lead to osteoporosis in the presence of vitamin D deficiency.
Conclusion
Although this study was carried out in a region with a highland tropical climate, 82% of the patients exhibited deficient or insufficient serum vitamin D levels. Our results did not show a significant correlation between vitamin D levels and bone mineral density according to age.
Conflict of Interest
The authors have no conflict of interests associated with this paper.
r e f e r e n c e s
2. Grisso J, Kelsey JL, Strom BL, O'Brien LA, Maislin G, LaPann K, et al. Risk factors for hip fracture in black women: The Northeast Hip Fracture Study Group. N Engl J Med. 1994;330(22):1555-9.
3. Ooms ME, Vlasman P, Lips P, Nauta J, Bouter LM, Valkenburg HA. The incidence of hip fractures in independent and institutionalized elderly people. Osteoporos Int. 1994;4(1):6-10.
4. Tinetti A, Baker D, McAvay G, Claus EB, Garrett P, Gottschalk M, et al. A multifactorial intervention to reduce the risk of falling among elderly people living in the community. N Engl J Med. 1994;331(13):821-7.
5. Gloth FM, Gundberg CM, Hollis BW et al. Vitamin D deficiency in homebound elderly persons. JAMA. 1995;274:1683-6.
6. Goldray D, Mizrahi-Sasson E, Merdler C, Edelstein-Singer M, Algoetti A, Eisenberg Z, et al. Vitamin D deficiency in elderly patients in a general hospital. J Am Geriatr Soc. 1989;37(7):589-92.
7. McKenna MJ. Differences in vitamin D status between countries in young adults and the elderly. Am J Med. 1992;93(1):69-77. .
8. Thomas MK, Lloyd-Jones DM, Thadhani RI, Shaw AC, Deraska DJ, Kitch BT, et al. Hypovitaminosis D in medical inpatients. N Engl J Med. 1998;338(12):777-83.
9. Nieves JW. Nutrition and osteoporosis in osteoporosis: an evidence based approach to the prevention and management. In: Cummings S, Cosman F, Jamal S, editors. Osteoporosis: an evidence based approach to the prevention and management. Philadelphia: American College of Physicians; 2002.
10. Cummings RG, Nevitt MC. Calcium for prevention of osteoporotic fractures in postmenopausal women. J Bone Miner Res. 1997;12(9):1321-9.
11. Heaney RP, Dowell MS, Hale CA, Bendich A. Calcium absorption varies within the reference range for serum 25-hydroxyvitamin D. J Am Coll Nutr. 2003;22(2):142-6. 12. Bischoff-Ferrari HA. The 25-hydroxyvitamin D threshold
for better health. J Steroid Biochem Mol Biol. 2007;103(3-5):614-9.
13. Stone KL, Wolfe RL. Diet, bone loss, and fracture risk: a review of the recent literature. Curr Opin Orthop. 1999;10(5):334-8.
14. Bouillon RA, Auwerx JH, Lissens WD, Pelemans WK. Vitamin D status in the elderly: seasonal substrate deficiency causes 1,25-dihydroxycholecalciferol deficiency. Am J Clin Nutr. 1987;45(4):755-63.
15. Need AG, O’Loughlin PD, Morris HA, Coates PS, Horowitz M, Nordin BE. Vitamin D metabolites and calcium
absorption in severe vitamin D deficiency. J Bone Miner Res. 2008;23(11):1859-63.
16. Roddam AW, Neale R, Appleby P, Allen NE, Tipper S, Key TJ. Association between plasma 25-hydroxyvitamin D levels and fracture risk: the EPIC-Oxford study. Am J Epidemiol. 2007;166(11):1327-36.
17. Woo J, Lau E, Swaminathan R, Pang CP, MacDonald D. Biochemical predictors for osteoporotic fractures in elderly Chinese – a longitudinal study. Gerontology. 1990;36(1):55-8. 18. Cummings SR, Browner WS, Bauer D, Stone K, Ensrud K,
Jamal S, et al. Endogenous hormones and the risk of hip and vertebral fractures among older women. Study of Osteoporotic Fractures Research Group. N Engl J Med. 1998;339(11):733-8. 19. Bischoff-Ferrari HA, Dietrich T, Orav EJ, Dawson-Hughes B.
Positive association between 25-hydroxy vitamin D levels and bone mineral density: a population-based study on younger and older adults. Am J Med. 2004;116(9):634-9.
20. Stone K, Bauer DC, Black DM, Sklarin P, Ensrud KE, Cummings SR. Hormonal predictors of bone loss in elderly women: a prospective study. The Study of Osteoporotic Fractures Research Group. J Bone Miner Res. 1998;13(7):1167-74.
21. Ghannam NN, Hammami MM, Bakheet SM, Khan BA. Bone mineral density of the spine and femur in healthy Saudi females: relation to vitamin D status, pregnancy, and lactation. Calcif Tissue Int. 1999;65(1):23-8.
22. Hosseinpanah F, Rambod M, Hossein-nejad A, Larijani B, Azizi F. Association between vitamin D and bone mineral density in Iranian postmenopausal women. J Bone Miner Metab. 2008;26(1):86-92.
23. Garnero P, Munoz F, Sornay-Rendu E, Delmas PD. Associations of vitamin D status with bone mineral density, bone turnover, bone loss and fracture risk in healthy postmenopausal women. The OFELY study. Bone. 2007;40(3):716-22.
24. Allali F, El Aichaoui S, Khazani H, Benyahia B, Saoud B, El Kabbaj S et al. High prevalence of hypovitaminosis D in Morocco: relationship to lifestyle, physical performance, bone markers, and bone mineral density. Semin Arthritis Rheum. 2009;38(6):444-51.
25. Rassouli A, Milanian I, Moslemi-Zadeh M. Determination of serum 25-hydroxyvitamin D (3) levels in early postmenopausal Iranian women: relationship with bone mineral density. Bone. 2001;29(5):428-30.
26. Sadat-Ali M, Al Elq AH, Al-Turki HA, Al-Mulhim FA, Al-Ali AK. Influence of vitamin D levels on bone mineral density and osteoporosis Ann Saudi Med. 2011;31(6):602-8.
27. Bandeira F, Griz L, Freese E, Lima DC, The AC, Diniz ET, et al. Vitamin D deficiency and its relationship with bone mineral density among postmenopausal women living in the tropics Arq Bras Endocrinol Metab. 2010;54(2):227-32.
28. Binkley N, Novotny R, Krueger D et al. Low vitamin D status despite abundant sun exposure. J Clin Endocrinol Metab. 2007;92(6):2130-5.
29. Saraiva GL, Cendoroglo MS, Ramos LR, Araujo LM, Vieira JG, Kunii I et al. Influence of ultraviolet radiation on the production of 25 hydroxyvitamin D in the elderly population in the city of Sao Paulo (23o 34’S) Brazil. Osteoporos Int. 2005;16(12):1649-54. .
30. Saraiva GL, Cendoroglo MS, Ramos LR, Araujo LMQ, Vieira JGH, Maeda SS et al. Prevalencia da deficiencia, insuficiência de vitamina D e hiperparatiroidismo secundario em idosos institucionalizados e moradores na comunidade da cidade de Sao Paulo, Brasil. Arq Bras Endocrinol Metab. 2007;51(3):437-42.
31. Premaor MO, Alves GV, Crossetti LB, Furlanetto TW. Hyperparathyroidism secondary to hypovitaminosis D in hypoalbuminemic is less intense than in
normoalbuminemic patients: a prevalence study in medical inpatients in southern Brazil. Endocrine. 2004;24(1):47-53. 32. Scalco R, Premaor MO, Froehlich PE, Furlanetto TW.
High prevalence of hypovitaminosis D and secondary hyperparathyroidism in the elderly living in nonprofit homes in South Brazil. Endocrine. 2008;33(1):95-100. 33. Mithal A, Wahl DA, Bonjour JP, Burckhardt P, Dawson-Hughes
B, Eisman JA, et al. Global vitamin D status anddeterminants of hypovitaminosis D. Osteoporos Int. 2009;20(11):1807-20. 34. Yetley EA. Assessing the vitamin D status of the US
population. Am J Clin Nutr. 2008;88(Suppl 2)::558S-64S. 35. Patton CM, Powell AP, Patel AA. Vitamin D in orthopaedics. J
36. Bogunovic L, Kim AD, Beamer BS, Nguyen J, Lane JM. HypovitaminosisD in patients scheduled to undergo orthopaedic surgery: a single-center analysis. J Bone Joint Surg Am. 2010;92(13):2300-4.
37. Nawabi DH, Chin KF, Keen RW, Haddad FS. Vitamin D deficiency in patients with osteoarthritis undergoing total hip replacement: A cause for concern? J Bone Joint Surg Br. 2010;92(4):496-9.