BIO-OPTICAL PROPERTIES OF THE INNER CONTINENTAL SHELF OFF SANTOS
ESTUARINE SYSTEM, SOUTHEASTERN BRAZIL, AND THEIR IMPLICATIONS FOR
OCEAN COLOR ALGORITHM PERFORMANCE
Melissa Carvalho1,*, Aurea Maria Ciotti2, Sônia Maria Flores Gianesella3, Flávia Marisa Prado Saldanha Corrêa3 and Rafael Riani Costa Perinotto4
1Universidade Federal de Santa Catarina
Departamento de Ecologia - Centro de Ciências Biológicas (Campus Trindade, 88010-970 Florianópolis, SC, Brasil)
2Instituto de Biociências da Universidade de São Paulo
Centro de Biologia Marinha da USP
(Rodovia Manoel Hypólito do Rego, km. 131,5, Praia do Cabelo Gordo 11600-000 São Sebastiao, SP, Brasil)
3Instituto Oceanográfico da Universidade de São Paulo
(Praça do Oceanográfico, 191, 05508-120 São Paulo, SP, Brasil)
4Universidade Estadual Paulista - Ciências Biológicas
(Praça Infante Dom Henrique s/n, Parque Bitaru,11330-900 São Vicente, SP, Brasil)
*Corresponding author: [email protected]
http://dx.doi.org/10.1590/S1679-87592014044506202
A
B S T R A C TOptical characterizations of coastal water masses are important tools for a better understanding of physical and biochemical processes and aid the optimization of ocean color algorithms. In this study we present three optical classes of water observed during October/2005 and March/2006 on the inner continental shelf adjacent to Santos Bay (Brazil), based on remote sensing reflectance. ANOVA indicated a crescent estuarine influence in classes 1 to 3. Class 3 presented the highest chlorophyll-a
and nutrient concentration and highest light absorption coefficients. Colored dissolved organic matter (CDOM) dominated the light absorption in all classes and was strongly correlated to salinity in October/2005 due to the influence of the La Plata plume. The results indicated that CDOM dynamics in the Santos inner shelf are very complex. The performance of global chlorophyll algorithms was significantly smaller for October/2005 than for March/2006. As inconsistent changes in light absorption spectra by phytoplankton were detected between samplings, the results show that future bio-optical algorithms for this region must be optimized preferentially considering CDOM optical parameters.
R
E S U M OA classificação ótica de massas de água costeira auxilia na compreensão de processos físicos e biogeoquímicos e permite otimizar algoritmos de cor do oceano. Neste estudo, identificamos 3 classes óticas de águas na plataforma continental interna adjacente à Baía de Santos (Brasil), com base na reflectância de sensoriamento remoto observada durante outubro/2005 e março/2006. ANOVA indicou influência estuarina crescente entre as classes 1 a 3, sendo que a última apresentou altos valores de clorofila-a, nutrientes e coeficientes de absorção da luz. A matéria orgânica dissolvida colorida (MODC) dominou a absorção da luz em todas as classes, mostrando forte correlação com a salinidade em outubro/2005, sugerindo influência da pluma do rio da Prata na região. Os resultados indicam dinâmica bastante complexa da MODC na plataforma interna de Santos. O desempenho do algoritmo global para clorofila-a (OC3), testado pelos dados radiométricos e de clorofila-ain situ, foi bem inferior em outubro/2005 comparado a março/2006. Como não houve mudanças substanciais nos espectros de absorção pelo fitoplâncton entre as duas épocas, os resultados mostram que as propriedades de absorção da luz pela MODC devem ser consideradas prioritariamente na otimização de algoritmos bio-óticos na região.
Descriptors: Santosinner continental shelf, remote sensing reflectance, CDOM, optical water mass classification, chlorophyll-a algorithms.
I
NTRODUCTIONContinental shelves under the direct influence of estuarine discharges display great variability of ocean color (BUKATA et al., 1995), which has been an important tools for the detection and quantification of dissolved and particulate material from different sources (MOREL, 2006). Ocean color products may include, besides the widely used chlorophyll-a concentration, indices of dissolved organic matter (MANNINO et al., 2008) and parameters that provide insights into phytoplankton community structure (e.g. BREWIN et al., 2011). Thus, bio-optical products from ocean color databases, such as those provided by satellites, may improve biogeochemistry studies as well as the management of water resources.
Ocean waters were optically classified more than 3 decades ago (MOREL; PRIEUR, 1977) into two main groups. The first of these, referred to as Case 1, are those in which phytoplankton and their associated and co-varying degradation products are the main optically active components present, which thus cause the variability of ocean color. The remaining waters, named Case 2, are those where inorganic particles and dissolved material govern changes in ocean color. Because of this, retrieving information on phytoplankton abundance using bio-optical methods in Case 2 waters is difficult and requires the development of regional algorithms (SATHYENDRANATH, 2000).
Ocean color, or remote sensing spectral reflectance (Rrs), is determined primarily by two
inherent optical properties (IOPs) – the light absorption and backscattering coefficients. In turbid waters (or Case 2), the high concentrations of colored dissolved and suspended materials tend to increase the magnitude of both absorption and scattering coefficients. However, the resulting ocean color depends on the combined spectral responses of the several substances present in the water and their relative contribution, thus a number of very distinct optical classes are present under the general Case 2 types. Usually, the main optically active components in coastal waters are inorganic sediments, phytoplankton, detritus and colored dissolved organic matter (CDOM). A number of studies have applied multivariate approaches for the optical water mass classification, in order to contribute to the understanding of biological and chemical processes (e.g. ARNONE et al., 2004). Although a number of semi-analytical models is available (see discussion in BRICAUD et al., 2012), the simpler approach of optical water type classification can optimize ocean color algorithm performances (AURIN et al., 2010), expanding and facilitating the applicability of remote sensing data. Empirical algorithms (e.g. O’REILLY et
al., 1998a; O’REILLY et al., 1998b) provide an indispensable computational tool for the monitoring of coastal waters, but because of the optical complexity of these environments, their performance might be significantly affected according to the presence of different optical components.
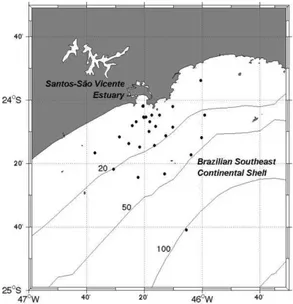
Our study was conducted in the continental shelf waters adjacent to the Santos estuarine system, which encompasses two estuarine channels and the Santos Bay (Fig. 1), a small and semi-enclosed bay located in São Paulo State, Brazil. Due to its shallow bathimetry and great tidal mixing (HARARI; CAMARGO, 2003), the plume formed in the bay is a mixture of the continental runoff and oceanic water masses, composed mainly of Coastal Water (CW), seasonally mixed with Tropical Water (TW) and eventual contributions of the South Atlantic Central Water (SACW) (ANDUTTA et al., 2006). All of the above mentioned water masses also have distinct chemical and biological characteristics (AIDAR et al., 1993; ANDUTTA et al., 2006). Thus it is to be expected that their relative contributions be reflected in the optical properties of the estuarine plume formed within Santos Bay, which can be identified as distinct types and monitored by remote sensing spectral reflectances.
Fig. 1. Sampling grid for October 2005 and March 2006 on the inner continental shelf off Santos estuary, Southeastern Brazil.
properties are not good predictors of surface salinity (BUCCI et al., 2012). Other surveys have shown that summer phytoplankton blooms inside the Santos estuarine complex may produce optical dominance of phytoplankton and are modulated by tides (MOSER et al., 2005; BUCCI et al., 2012), wind patterns (MOSER et al., 2012) and fresh water discharges.
Studies in coastal waters and waters influenced by estuaries, such as Blondeau-Patissier et al. (2009) in estuarine and coastal waters of the Great Barrier Reef (Australia) and Aurin et al. (2010) in Long Island Sound estuary, have indeed demonstrated that distinct optical domains resulting from the mixture of waters in the estuary-ocean interface can be identified by their optical properties.
This study focused on the identification of the different optical domains (or optical types) in the coastal waters adjacent to the Santos estuarine system. To understand the physical, chemical and biological influence of the Santos estuary on the adjacent shelf waters, we have classified the optical water types on the basis of the reflectance spectra of the sea surface measured in two periods (October 2005 and March 2006). The optical types were also characterized according to absorption coefficients of CDOM, phytoplankton and “detritus” (or non-algal particles that include inorganic sediments). Additionally, the performance of the global algorithm OC3, the standard algorithm of the Moderate Resolution Imaging Spectroradiometer (MODIS) sensor, was evaluated to estimate chlorophyll-a concentration from reflectance ratios.
M
ATERIAL ANDM
ETHODSTwo oceanographic campaigns were conducted on the inner continental shelf adjacent to Santos Bay in October 2005 and March 2006, as part of the ECOSAN research project “The influence of Santos estuarine complex on the adjacent continental shelf ecosystem”, conducted by the Instituto Oceanográfico da Universidade de São Paulo on board the R/V Prof. W. Besnard. Each campaign was based on a grid of 40 oceanographic stations distributed along eight sections originating from the same point in the center of the entrance of Santos Bay (Fig. 1). Temperature and salinity were measured at all the stations using a Falmouth CTD profiler and the data were used to obtain temperature-salinity (TS) diagrams, following the thermohaline index proposed by Castro Filho et al. (1987).
Eight-day composites of sea surface temperature (SST) with 4-km spatial resolution for the period of the sampling (12 to 15 October 2005 and 23 to 26 March 2006) were derived from the MODIS sensor aboard the Aqua satellite.
Surface water samples were collected at all the stations using 9 L Niskin bottles for the analyses of inorganic nutrients and chlorophyll-a concentrations (hereafter referred as Chl), as well as measurements of light absorption coefficients by CDOM (acdom),
detritus (adet) and phytoplankton (aphy).
Nutrient concentrations were determined spectrophotometrically from the filtered water, in accordance with the methods described in Aminot; Chaussepied (1983) for ammonium, and in Grasshoff et al. (1983) for phosphate and silicate. Chlorophyll-a concentration (Chl, mg m–3) was determined by spectrophotometric methods, in accordance with SCOR-UNESCO (1966), from samples retained in AP-40 Millipore filters (SALDANHA-CORRÊA et al., 2004) and extracted in 90% acetone. Independently, samples for Chl were also determined using a calibrated Turner Designs 10-005R fluorometer, equipped with the non-acidification filter set (WELSCHMEYER, 1994). Samples of 500 mL were concentrated on GF/F filters that were stored in liquid nitrogen immediately after filtration. GF/F filters were extracted at –10°C or below, for at least 24 h, in pre-cooled 90% acetone: DMSO solution (6:4 by volume; SHOAF; LIUM, 1976). The values of Chl derived from both methods were averaged or chosen according to a set of criteria (not shown). The differences between spectrophotometric and fluorometric Chl were, in general, below 15%.
Volumes of 300 to 2000 mL were concentrated onto GF/F filters for the measurement of light absorption coefficients. Filters were immediately preserved in liquid nitrogen and stored until analysis. Measurements followed the method of Tassan; Ferrari (1995) using a Hitachi U3010 dual-beam spectrophotometer and the path-length amplification correction described in Tassan et al. (2000). Sample and blank filters were scanned against air from 750 to 350 nm at both the entrance and the exit of an integrating sphere. All the filters were then treated with a few drops of 0.5% NaClO for 10 to 15 min and then carefully washed with the 0.2 µm filtered
seawater to remove phytoplankton pigments. Measurements were repeated as above, and the spectral absorption of phytoplankton was computed as the difference between the scan before (total particulate) and after (“detritus”) bleaching, correcting for the volume filtered and clearance area. Values between 740 and 750 nm were considered as absorption by detritus (TASSAN et al., 2000). Measurements of the detritus spectral absorption were fitted to an exponential decay with wavelength to yield a value for magnitude at 443 nm (adet(443), m-1,
hereafter referred as adet) and spectral slope (Sdet,
nm-1). Values between 740 and 750 nm were
Filtrates from the particulate absorption samples were used for determinations of CDOM absorption coefficients. Samples were kept in the dark at 4°C until analysis using a 10 cm quartz cuvette and scanning the samples in spectrophotometry against air between 300 and 750 nm. Freshly produced Milli-Q water was used to zero the instrument. The same fitting procedure for detritus absorption spectra was applied only to the 350–600 nm spectral absorption range (following BABIN et al., 2003) for deriving the CDOM absorption parameters (acdom(443), m-1,
hereafter referred as acdom, and Scdom, nm -1).
Because of the very similar spectral shape of both CDOM and detritus (i.e., exponential decay of absorption values with increasing wavelength), most remote sensing methods and models combine both components into a single variable named colored detrital matter (CDM); thus, CDM absorption coefficient (acdm, m-1) is simply the sum of acdom and
adet.
Phytoplankton absorption spectra were parameterized following Ciotti et al. (2002), modified by Ciotti; Bricaud (2006). Resulting values of the parameterization are a magnitude (a) corresponding to the average value of phytoplankton absorption between 400 and 700 nm and the size parameter Sphy,
which is a value constrained to vary between 0 and 1 and to specify the relative contributions of microplankton and picoplankton to the phytoplankton absorption spectra, independent of Chl.
Remote Sensing Reflectance
The spectral remote-sensing reflectance was computed from the total upwelling radiance of surface water, Lt(λ,θ,φ,0), acquired from 400 to 1100 nm (3
nm of resolution) with a spectroradiometer Spectrom SE 590. The acquisition, correction and processing of the radiometric measurements above water followed the SeaWiFS validation protocol (MUELLER; AUSTIN, 1995). First, the effects of skylight reflection and residual sun glint were minimized with a polarizer filter coupled to the sensor. Measurements of the total upwelling radiance of water surface (Lt(λ,θ,φ,0)), reflected sky radiance (Lsky(λ,θ,φ,π)), and
upwelling radiance of reference plaque (Lp(λ,θ,φ))
were taken sequentially at least 3 times at each daylight station.
Remote sensing reflectance (Rrs), or the
color of the ocean, is defined as:
where Lw is the upwelling radiance of surface water
measured in a zenithal and azimuthal angle, θ = 45°
and φ = 135°, respectively, at wavelength λ. Ed is the
downwelling irradiance in all downward directions. Total upwelling radiance of water (Lt) is the
sum of the upwelling radiance of water (Lw)
containing dissolved and particulate materials and of the sky radiance (Lsky) resulting from physical
perturbation of the sea surface, mainly the sun glitter and the presence of bubbles (FOUGNIE et al., 1999; STEFFEN, 1996; MUELLER; AUSTIN, 1995). In order to compute Lw(λ,θ,φ) the following correction
was applied:
where ρ = 0.022 is the Fresnel reflectance for correction of the reflection and refraction effects that occur when Ed and Lu propagate through a flat surface
(MUELLER; AUSTIN, 1995). The ρ = 0.022 is the
mean value for the period of day at which the measurements were taken, as determined by Kirk's (1994) equations.
Rrs values were then computed by
referencing the upwelling radiance of water (Lw) and
the upwelling radiance of the reference plaque (Lp)
over all angles (π):
where k is the reflectance of the reference plaque, ideally close to 1 and spectrally flat.
Rrs spectra between 380 and 899 nm were
generated for a total of 49 stations (26 in October, 21 in March). All values were offset to those computed for 869 nm (average between 866 and 872 nm) in order to remove any residual specular effects (DESCHAMPS et al., 2004). To test the ocean color algorithm performances, the Rrs spectra were then
grouped into bands to represent the same wavelength channels of the MODIS/Aqua ocean color sensor bands (http://modis.gsfc.nasa.gov/). The arithmetic means of intervals of 15 nm, centered at 412 and 869 nm, and 10 nm, centered at 443, 488, 531, 551, 667, 678 and 748 nm were computed.
Statistical Analysis
The water optical type classification was applied to the whole dataset (n=49) using a Hierarchical Clustering Analysis (HCA) analysis with the Rrs spectra (between 407 and 752 nm) as input
vector objects. The spectra were first normalized to Rrs(551) to minimize possible effects of distinct
magnitudes enhancing the spectrum shape, since
(1)
(2)
variations in the Rrs at 551 nm are small in oceanic
waters (TORRECILLA et al., 2011; AURIN et al., 2010). The dissimilarity matrix degree was calculated by computing the Euclidean distance (CLARKE; WARWICK, 2001) applied to matrix of Rrs spectra.
The cluster tree, cophenetic matrix and indexes were computed using a complete linkage algorithm based on the dissimilarity matrix. The cutoff value chosen for the groups was the inflection point of linkage distances between stations and the clusters below this point are identified as classes of optical water type (following SALVADOR; CHAN, 2004). A Multidimensional Scaling (MDS) ordination analysis was applied on the same resemblance matrix, for visualization of the clusters obtained in the HCA using the same cutoff value for the cluster tree.
Significant differences in physical and chemical properties (temperature, salinity and nutrients) and light absorption parameters (phytoplankton, detritus and CDOM) were tested between optical water types using a one-way analysis of variance (ANOVA) with critical p < 0.05 and a posteriori Tukey test for unequal n. Relationships between variables, periods and parameters were investigated by linear and non-linear regression analyses.
Ocean Color Algorithm Performance
Chl concentration (mg m-3) was estimated using the ocean color algorithm OC3 (O’REILLY, 2000) and the simulated MODIS/Aqua spectral bands from the in situ reflectance values. The OC3
performance was tested with linear regression analyses between estimated and measured in situ Chl (log) for 27 stations in October 2005 and 22 stations in March 2006, as well as for the whole dataset (n=49).
R
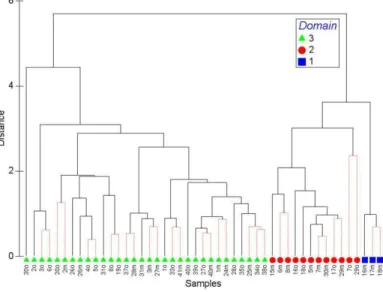
ESULTS Optical Water TypesThe HCA analysis yielded a cluster tree (Fig. 2) and a cophenetic index of 0.8876, which indicated that the complete linkage algorithm was appropriate for our data. The ordination of the 49 oceanographic stations by the MDS, which also used Rrs spectra as
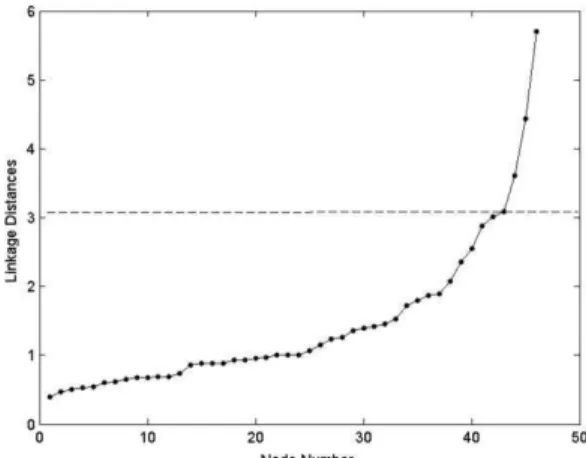
input, obtained a stress value of 0.02, indicating a good fit of the metric to the dataset. The cut-off value of the cluster tree and MDS was 3.09 (see Figure 3). The HCA and MDS analysis grouped the Rrs spectra
into three optical water types, arbitrarily named as classes 1, 2 and 3 (Figs 2 and 4). According to the cutoff value, the Rrs spectral for one station was
considered as an outlier and was not included in any of the three classes. This outlier was closer to the spectra of class 3, so it was grouped in this class. Class 1 was composed of only 3 stations, located in the outermost part of the sampling grid and the furthest from Santos Bay. Class 3 included the stations closest to Santos Bay, and class 2 those located in intermediate regions. The cluster tree revealed that class 1 and 2 are closer to each other and equally distant from class 3. Rrs
spectra normalized by Rrs(551) of each optical water
type are shown in Figure 5.
Fig. 2. Cluster tree obtained by HCA analysis for the dataset comprising 49 stations from both sampling campaigns, using Rrs spectra between 407 and 752 nm as input. The suffix o and mrefers to station numbers during October 2005 and March 2006,
Fig. 3. Linkage distances between clusters obtained in the HCA (see Figure 2). The dashed line represents the limit to cut-off the cluster located at the inflection point of the curve.
Fig. 4. Ordination of the stations by MDS for the 49 stations, using the Rrs spectra between 407 and 752 nm. The suffix o and m after the station numbers refers to October 2005 and
March 2006, respectively. The classes are represented by symbols (squares for class 1, dots for class 2 and triangles for class 3). The circles around the dots represent the limits of groups of optical water types.
Fig. 5. Rrs(λ) spectra normalized by Rrs (551) for some representative stations of class 1 (dash-dotted line), class 2 (solid line) and class 3 (dashed line) derived from the cluster and ordering analyses (see Figures 2 to 4).
Significant differences between shapes and magnitudes of the Rrs spectra corresponding to each
class were conspicuous and revealed expected trends. Class 1 presented a typical spectral shape of open ocean waters, with higher reflectance in the blue region decreasing exponentially with wavelength, while class 3 exhibited typical spectral shapes for turbid waters. Although class 2 showed intermediate normalized Rrs values in the blue region, it was the
class with the highest Rrs values in red wavelengths.
Physical and Biochemical Properties in the Classes
Significant differences (p < 0.05) were found by ANOVA and Tukey tests applied to most of the physical, chemical and biological variables from the optical water types discriminated by the HCA analyses (Table 1). An exception was noted for temperature and concentration of ammonium, which were similar (or equally variable) among all classes. The Tukey tests showed that class 1 was similar to class 2 for the remaining variables, except for the concentration of phosphate, which was similar for classes 2 and 3.
As expected, salinity was lower in class 3 and showed high variability (Fig. 6b). Due to the estuarine influence, class 3 presented higher concentrations and variability of silicate and phosphate concentrations than classes 1 and 2 (Fig. 6f). Indeed, the mean concentration of silicate in class 3 was twice as high as in classes 1 and 2. The concentration of phosphate in class 1 was very low, with mean values close to the limit of detection (assumed here as zero), while the average concentration values in classes 2 and 3 were 0.37 µM and 0.50 µM, respectively (Fig. 6e). Although ANOVA showed no differences for concentration of ammonium among classes, the average value of class 3 was twice higher than those of classes 1 and 2 (Fig. 6d). Chl concentration (log) mean values and variability were higher (Table 1) in class 3 than in classes 1 and 2 (Fig. 6c).
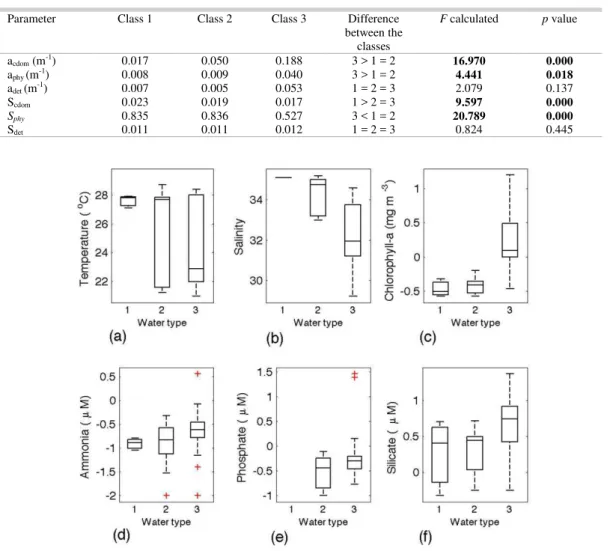
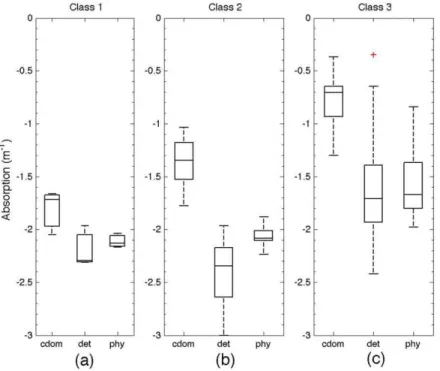
Light Absorption Coefficients by CDOM, Phytoplankton and Detritus in the Classes
ANOVA and Tukey tests that compared light absorption parameters (acdom, aphy, adet, at, Scdom,
Sphy and Sdet) between each optical water type (Table
2) showed that classes 1 and 2 are similar for acdom and
aphy, presenting mean values about one order of
Table 1. Average values for each class of water and results of one-way ANOVA for critical p < 0.05, and Tukey HSD for unequal n between discriminated optical water types for comparisons between
physical and biochemical variables. Significant values (p < 0.05) are shown in bold fonts. Dataset for whole sampling period.
Variable Class 1 Class 2 Class 3 Differences between
classes
F calculated p value
Salinity 35.10 34.23 32.26 3 < 1 = 2 12.560 0.000 Temperature (°C) 27.61 25.28 24.28 1 = 2 = 3 1.993 0.140
Chl – log (mg m-3) -0.47 -0.43 0.24 3 > 1 = 2 13.852 0.000 Silicate (µM) 2.66 2.50 5.21 3 > 1 = 2 5.026 0.011 Ammonium (µM) 0.13 0.18 0.37 1 = 2 = 3 0.722 0.492 Phosphate (µM) 0.00 0.37 0.50 1 < 2 = 3 7.052 0.002
Table 2. Average values of the variables for each class of water and results of one-way ANOVA, for critical p < 0.05, and Tukey HSD for unequal n between classes of optical water type for light absorption parameters. Significant values are in bold.
Fig. 6. Box plots for: (a) salinity; (b) temperature; (c) Chla (log); (d) silicate (log); (e) ammonium (log);
and (f) phosphate (log), for the optical water type classes 1, 2 and 3. In the box plots, the median (line inside the box), lower quartile and upper quartile (box), minimum and maximum values (whiskers) and outliers (cross) are represented.
Parameter Class 1 Class 2 Class 3 Difference between the
classes
F calculated p value
acdom (m-1) 0.017 0.050 0.188 3 > 1 = 2 16.970 0.000
aphy (m-1) 0.008 0.009 0.040 3 > 1 = 2 4.441 0.018
adet (m-1) 0.007 0.005 0.053 1 = 2 = 3 2.079 0.137
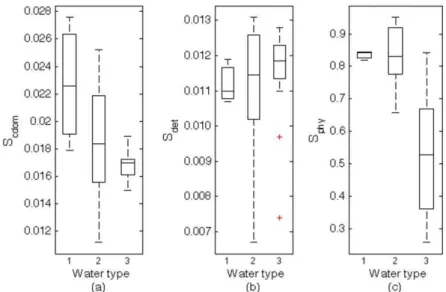
Scdom 0.023 0.019 0.017 1 > 2 = 3 9.597 0.000
Sphy 0.835 0.836 0.527 3 < 1 = 2 20.789 0.000
The magnitudes of light absorption parameters (Fig. 7) revealed no significant differences for adet, although the mean value in class 3 was one
order of magnitude larger than in classes 1 and 2. Class 3 also showed high variability for acdom, aphy and
adet (Fig. 7). The magnitude of CDOM absorption was
the most variable parameter among optical types, with higher values in class 3, as expected. Similarly to what was observed for the magnitudes, the spectral shapes of light absorption by CDOM and phytoplankton, represented by Scdom and Sphy, respectively, were
significantly different according to the ANOVA tests. Higher values of both Scdom and Sphy were found in
class 1 than in classes 2 and 3 (Table 2) with class 3 presenting less variability in Scdom than classes 1 and 2
(Fig. 8). According to ANOVA there was no difference in Sdet as between classes, and the Tukey
test indicated similar mean values. Despite the ANOVA results, the average values of Sdet were
observed to be similar, but class 2 presented higher variability than other classes (Fig. 8b).
Bio-optical Water Types and Chl Algorithm
Performances Between Campaigns
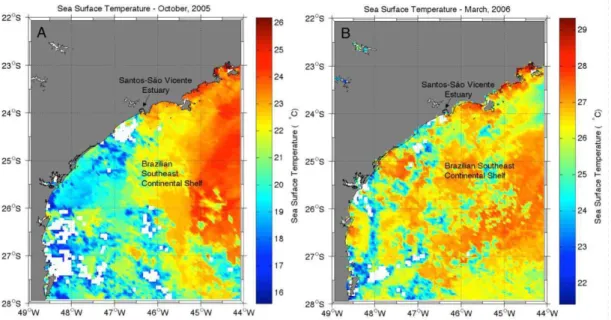
The TS diagram (Fig. 9) indicates the presence of estuarine waters over the inner continental
shelf and dominance of the Coastal Water (CW) in October 2005. A large range of salinity was observed in this period: waters with very low salinities (S < 33.5) were present on the inner and medium shelf, suggesting not only the influence of Santos estuary but also of waters from the Rio de la Plata (MÖLLER Jr. et al., 2008; CASTRO et al., 2008). Outer stations presented higher salinities, as a result of TW influence. SST images showed the tongue of cold water (T < 20°C) that originates in higher latitudes and
reached the study area in October 2005 (Fig. 10a). The main feature observed in the TS diagram (Fig. 9) in March 2006 were the high salinities (S > 33.1), indicating the prevalence of oceanic water under TW influence, mixed with CW, with high temperatures (maximum of 29°C) and the
confinement of the estuarine plume within Santos Bay. Further, the SACW signal was detected by low temperatures (< 20°C) and salinities between 35 and
36.4 (CASTRO FILHO et al., 1987). There was no evidence of La Plata River water influence during that period. In March 2006, the SST was more homogeneous and above 20°C for the whole
southeastern continental shelf (Fig. 10b).
Fig. 8. Box-plots for spectral slope of CDOM (a), detritus (b) and phytoplankton (c), for the optical water classes 1, 2 and 3. In the box plots, the median (line inside the box), lower quartile and upper quartile (box), minimum and maximum values (whiskers) and outliers (cross) are represented.
Fig. 9. Temperature-Salinity (TS) diagram for October 2005 (crosses) and March 2006 (dots) cruises, with density lines in the background. The water masses indicated in the figure (Coastal Water – CW, Tropical Water – TW and South Atlantic Central Water – SACW) are according to the thermohaline index proposed by Castro Filho et al. (1987).
The results of one-way ANOVA and the Tukey test (p < 0.05) between the periods of October 2005 and March 2006 are summarized in Table 3. Significant differences were observed between periods for salinity, temperature and nutrients. The unique light absorption parameter that presented significant differences between periods was the acdom, with higher
values in October 2005 than in March 2006.
The results of regression analysis between the Chl estimated by global empirical algorithm OC3 and Chl measured in situ are presented in Table 4. The March 2006 dataset obtained better adjustments (n=22, r2=0.876) and lower mean square errors (MSEs) than
October 2005 (n=27, r2=0.682) and also for the whole
Table 3. Average values of the variables for each sampling period and results of one-way ANOVA, for critical p < 0.05, and Tukey HSD for unequal n between sampling period for physical, biological, chemical and light absorption parameters. The significant values (p < 0.05) are in bold.
Parameter Oct, 2005
Mar, 2006
F
calculated p value Salinity 31.72 34.48 90.046 0.000 Temperature
(°C) 22.10 28.03 1297.282 0.000
Chl (mg m-3) 2.26 2.66 0.119 0.732
Silicate (µM) 5.38 3.08 8.400 0.006 Ammonium
(µM) 0.46 0.12 5.058 0.029
Phosphate
(µM) 0.53 0.31 9.300 0.004
acdom (m-1) 0.17 0.10 6.067 0.018 aphy (m-1) 0.03 0.03 0.092 0.763 adet (m-1) 0.04 0.03 0.121 0.730 at (m-1) 0.27 0.21 0.890 0.350
Scdom 0.02 0.02 0.002 0.966
Sphy 0.62 0.63 0.052 0.821
Sdet 0.01 0.01 1.994 0.165
Table 4. Correlation (r) and determination (r2) coefficient, p-value (p), mean square error (MSE) between Chl estimated
by OC3 and in situ (log), for the two periods and for the whole dataset (n=49).
Algorithm n r r2 p MSE
OC3 49 0.827 0.683 0.000 0.0368
OC3 – October, 2005
27 0.826 0.682 0.000 0.0255
OC3 – March, 2006
22 0.936 0.876 0.000 0.0165
The relationship between salinity and acdom
for October 2005 and March 2006 is illustrated by the scatter plot with linear adjustment in Figure 11. Salinity and acdom were better correlated in October
2005 (r=-0.8542) than in March 2006 (r=-0.7141). The scatterplot and trend lines for acdom and
Scdom are presented in Figure 12. The inclination of
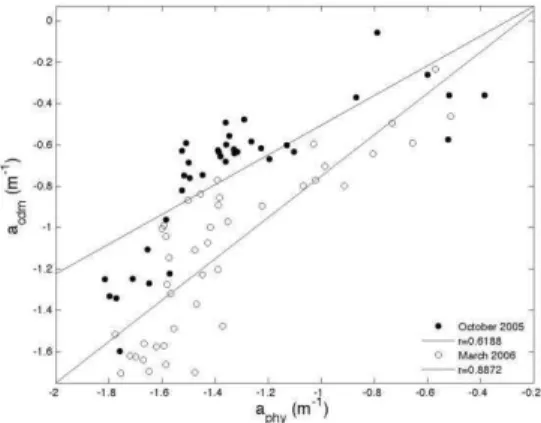
trendlines shows that the relationships are different for each period. The relationship between acdm (acdom plus
adet) and aphy, for each period (Fig. 13) shows that acdm
appears to co-vary more linearly with aphy in March
2006 (see slope of 1.00 and r= 0.8872). In October 2005, the same trendline was less robust (r=0.6188) and non-linear.
Fig. 11. Scatter plot between acdom (m-1) and salinity for October 2005 (dots) and March 2006 (circles), and their respective linear adjustments, for n=47.
Fig. 12. Scatter plot between acdom (m-1) and Scdom (nm-1) (both in log scale) for October 2005 (dots) and March 2006 (circles), and their respective linear adjustments, for n=47.
Fig. 13. Scatter plot between acdm (m-1) and aphy (m-1) (both in log scale) for October 2005 (dots) and March 2006 (circles), and their respective linear adjustments, for n=47.
D
ISCUSSIONOptical and Biochemical Properties of the Optical Water Types
The optical characterization of coastal water masses is important for interpreting and optimizing ocean color algorithms (ARNONE et al., 2004; AURIN et al., 2010). Indeed, operational empirical ocean color algorithms were designed only for Case 1 waters and are not expected to work well outside this domain. Optical properties of the ocean are sensitive to their physical and biogeochemical characteristics and, complementary to temperature and salinity ranges, it is possible to classify a water mass by identifying which component controls the total absorption coefficient (LEE, 2006).
A number of studies have presented the optical classification of water masses using multivariate statistical analyses (e.g. AURIN et al., 2010; TORRECILLA et al., 2011; BLONDEAU-PATISSIER et al., 2009). Similarly to what was found by Aurin et al. (2010), who used cluster analyses of IOPs in the estuarine region of Long Island Sound, our study identified three classes of optical water types in the adjacent waters off Santos Bay using HCA and MDS analyses. In the Long Island study, the variability of IOPs was explained by the local effects of riverine suspended sediment and high nutrient loading, with two optical domains dominated by phytoplankton absorption (of different proportions) that were directly influenced by the river plume, and a third domain, further from estuarine influences, dominated by colored detrital matter (CDM).
Our study distinguished 3 optical types (Fig. 5) in the study region. Class 1 represented clear waters, resembling Rrs spectra from Case 1 waters
(MOREL; PRIEUR, 1977). The spectra for class 2 exhibit intermediate characteristics of classes 1 and 3, but their biochemical and absorption variables tended to be similar to those of class 1 for most parameters and variables, except for Scdom and phosphate
concentration. The class 3 waters were closest to the entrance of Santos Bay and exhibited the typical Rrs
spectra of coastal waters influenced by estuarine waters with low reflectance values in the blue region, owing to high CDOM, detritus and phytoplankton absorption. The minimum Rrs around 443 nm suggests
considerable absorption by chlorophyll-a. Above 551 nm, Rrs increases in class 3, probably due to
backscattering from suspended material.
those of class 1. For class 1, there was a predominance of the oligotrophic tropical water mass (AIDAR et al., 1993; GIANESELLA; SALDANHA-CORRÊA, 2008) with average nutrient concentrations about half of those for classes 2 and 3.
Although Moser et al. (2005) ascertained that the Santos and São Vicente estuaries exported organic and inorganic matter, ammonium and chlorophyll-a to the bay, especially during the rainy season, our study suggests that this enrichment is clearly restricted to Santos Bay. Average Chl concentration in class 3 waters (3.40 mg m-3) was
about an order of magnitude higher than the means of classes 1 and 2 (0.35 mg m-3 and 0.39 mg m-3,
respectively), which presented Chl concentrations similar to those of other regions of the southeastern Brazilian continental shelf, far from estuarine contributions, such as in the Ubatuba and São Sebastião coastal areas (AIDAR et al., 1993; GIANESELLA; SALDANHA-CORRÊA, 2003; SALDANHA-CORRÊA; GIANESELLA, 2008).
CDOM rather than phytoplankton was the dominant component for the light absorption in all classes (more clearly so in classes 2 and 3), suggesting the input of dissolved organic matter from the estuarine system into Santos Bay (MOSER et al., 2005). While the magnitude of the spectral absorption by CDOM is related to the concentration of CDOM, the spectral slope gives information about its source and composition, including the ratio of humic to fulvic acids (TWARDOWSKI et al., 2004; CARDER et al., 1989). The spectral slope for fulvic acid tends to be greater than that for humic acids (CARDER et al., 1989). An inverse relationship between acdom and Scdom
was observed in all the three classes, in agreement with that described by other authors (e.g. CARDER et al., 1989; TWARDOWSKI et al., 2004, BRICAUD et al., 2012). Twardowski; Donaghay (2002) suggested that the high values of Scdom observed in oceanic
waters could be related to photobleaching processes that result in a shift of CDOM absorption to shorter wavelengths, thus increasing Scdom values. Scdom
observed on the inner continental shelf off Santos varied from 0.011 to 0.028 nm-1, which is in the same
range of values as that obtained by Ciotti; Bricaud (2006) in waters of the continental shelf located further north (from 0.008 to 0.028 nm-1), with no
direct influence of the Santos estuarine complex. On average, Scdom was 0.019 and 0.017 nm-1, respectively,
for classes 2 and 3, which were similar to those obtained by Ciotti; Bricaud (2006) but slightly higher than the common assumed value for CDOM in coastal waters (0.015 nm-1; see BABIN et al., 2003).
In most of the oceans, CDOM is the major light absorption component competing with phytoplankton (SIEGEL et al., 2002). Keith et al. (2002) studied the effects of CDOM for phytoplankton
in the coastal waters of Rhode Island, and verified that in waters with high absorption by CDOM and Scdom <
0.020 nm-1, the phytoplankton requires accessory
photosynthetic pigments at longer wavelengths (532 nm) to collect sufficient light energy for photosynthesis. The composition of accessory pigments as well as phytoplankton self-shading (the pigment packaging described by DUYSENS, 1956) controls phytoplankton light absorption (see BRICAUD et al., 1995). Class 3 presented values of aphy one order of magnitude greater than classes 1 and
2, as was to be expected by virtue of the high Chl and nutrient concentrations in the estuarine system. The range of aphy values was consistent with those
observed by Bricaud et al. (2010) for open ocean waters in the Southeastern Pacific (0.0008–0.08 m-1).
Both taxonomic composition and the cell size of phytoplankton drive the spectral shape of aphy
(CIOTTI et al., 2002; BRICAUD et al., 2004). One of the parameters proposed to describe the spectral shape of aphy is the size parameter Sphy (CIOTTI; BRICAUD
2006), that indicates primarily the dominant size of phytoplankton and during parameterizations is forced to vary from 0 to 1, indicating dominance by large and small cells in a continuum (CIOTTI et al., 2002). Class 1 and 2 waters were similar in terms of Sphy,
generally dominated by small cells (high Sphy values),
while the size parameter in class 3 suggested dominance by large cells (lower Sphy values), but also
high variability in cell size. Differences in the dominant cell size are a consequence of differences in nutrient availability among water masses (YENTSCH; PHINNEY, 1989). As discussed before, Santos and São Vicente channels promote an enrichment of the Santos Bay waters. Moser et al. (2012) showed that the microphytoplankton community in Santos Bay changes rapidly in response to wind speed and direction, increase of precipitation or estuarine discharges, as well as changes in tides. These fluctuations allow many species to coexist and a specific phytoplankton group may ocassionally dominate. However, this high diversity appears to co-vary strongly with Chl, independently of the study period, and the relationships between aphy and Chl are
fairly robust.
The relative importance of non-algal particles (detritus plus inorganic sediments - adet) was
one order of magnitude higher in class 3, probably due to the input of inorganic material from the Santos estuarine channel into Santos bay, while the contribution of non-algal particles in the classes 1 and 2 waters for total absorption was lower and equivalent to that of phytoplankton. The spectral shape of non-algal particles, Sdet, resembled that of CDOM
absorption (exponential decay with wavelength), but Sdet in the ocean tend to vary little in general
same was observed here, and Sdet values are generally
at the lower limits found in coastal waters, indicating the predominance of organic particles (BUKATA, 1995).
Optical Water Type Variability Between the two Periods of Time
A seasonal variability of the thermohaline properties of water masses is a characteristic feature of the continental shelf off São Paulo state (AIDAR et al., 1993; CASTRO et al., 2008; CASTRO; MIRANDA, 1998). This seasonality was observed in the present study in association with the changes in the optical water classes found in both sampling campaigns. In October 2005, the inner continental shelf was dominated by CW (Fig. 9) with low salinities (S < 34.9, CASTRO FILHO, 1987), driven by continental run-off (CASTRO; MIRANDA, 1998). Nonetheless, cold and low salinity waters from other sources were also present on the inner shelf during the winter months. Coastal waters formed under the influence of Rio de la Plata plume can reach this latitude (~25°S) during winter (CAMPOS et al., 1996;
MÖLLER Jr. et al., 2008; PIOLA et al., 2008; CASTRO et al., 2008). This process brings suspended material and CDOM to upper layers, which changes the optical properties of coastal waters, affecting the estimation of chlorophyll-a by satellite ocean color data (PIOLA et al., 2008). Consequently, Chl concentration in the region under the influence of the Rio de la Plata is highly overestimated by satellite data (PIOLA et al., 2008; GARCIA et al., 2005; 2006), and a relation between salinity and satellite-derived Chl is to be expected, as shown by Piola et al. (2008).
Class 1 waters, which are associated with low nutrients and dissolved and particulate matter, were absent in October 2005. Class 2 waters occurred only at 5 stations located in the outermost area of the sampling grid, near the 50 m isobath, while class 3 waters occurred at most of the stations sampled in the intermediate area and close to Santos Bay. Thus, class 3 waters in fact exemplify a complex mixture of those from the local estuary with coastal water under La Plata influence.
These temporal differences in the distribution of the classes on the inner and medium continental shelf are consistent with Castro et al. (2008), who showed that the sectors of the continental shelf on the northern coast of São Paulo state present a seasonal dynamic. According to the authors, in winter the inner continental shelf, located between the coast and the deep thermal front, is the widest, reaching as far out as 40-80 km from the coast, between the 50 and 70 m isobaths. During the summer, when the intrusion of the TW carried by the Brazil Current is intensified, the inner continental shelf gets narrower,
extending seaward for 10-30 km, between the 20 and 40 m isobaths.
During March 2006, as seen in the TS diagram, the surface of the inner continental shelf was dominated by warm waters (> 26ºC) of high salinity (S > 33.1) under the more direct influence of TW. There was apparently no contribution of the La Plata estuary in this period. The class 1 waters were observed in the outermost part of the grid, the area occupied by class 2 was fairly reduced and class 3 waters were confined to the entrance of Santos Bay.
This pattern of water mass dynamics is related to the wind regime. The study region is located in the western portion of the anticyclonic subtropical gyre, associated with the South Atlantic Subtropical High, which presents seasonal oscillations. In summer east-northeasterly winds prevail in the coastal zone between 15º and 35ºS favoring the approach of the Brazil Current to the medium and inner shelf. In winter, these winds are confined to the 20-25ºS, and TW is positioned offshore (CASTRO et al., 2006). The greater incidence of frontal systems in this period, characterized by south-southeasterly winds, results in water mixing events and thermocline disruption.
Indeed, the ANOVA analyses comparing the sampling periods showed acdom as the only
significantly different bio-optical parameter. An inverse relationship between acdom and salinity was
more robust during October 2005 than in March 2006. Despite the direct comparison between these relationships being challenged by the distinct salinity gradients, it seems that the Santos estuarine complex plume presents higher acdom for a given salinity than
does the coastal water under La Plata influence (Fig. 11). The slopes of both linear regressions are also different (-0.077 and -0.121 for October and March, respectively); thus, the decrease of CDOM absorption due to the increase in salinity appears more intense in the plume of the Santos estuarine complex.
The inverse relationship between acdom and
salinity is a common CDOM feature as rivers are important sources of CDOM (e.g. D’AS; DIMARCO et al., 2009; D’AS; MILLER, 2003). The decrease in CDOM that accompanies the increase in salinity is a primary response to the mixing of estuarine waters with the low CDOM open ocean waters (e.g. KEITH et al., 2002). However, processes that form or destroy CDOM also modify it. For instance, CDOM can be produced locally during phytoplankton blooms (NELSON et al., 1998; BRICAUD et al., 1981) or be consumed by bacteria and phytoplankton (CARLSON; DUCKLOW, 1996) or photo-oxidized by solar irradiance (NELSON et al., 1998; BRICAUD et al., 1981). On large temporal scales in the ocean, both acdom and Scdom illustrated some of these processes
salinity found during both sampling periods, which also suggests CDOM as a more reliable descriptor of the La Plata plume influence. The acdm and aphy were
more strongly and linearly correlated in March 2006, suggesting covariance of the components, where CDM is produced locally by phytoplankton. The same linear correlation was not observed in October 2005, reinforcing the fact that the presence of the suspended and dissolved material originates in remote regions. The analyses of OC3 performances using in situ Chl and the simulated Rrs MODIS/Aqua bands showed
unsatisfactory results for October 2005 (r2=0.682),
while in March 2006, when the influence of CW and consequently of CDOM on the inner continental shelf was smallest, there was a clear improvement in the relationship (r2=0.876). In
Chl algorithms based on spectral Rrs ratios, such as the OC3, all blue absorption
optical components present in the surface water will result in overestimates of the remote sensing algorithms (CARDER et al., 1989). In accordance with the author, covariance of marine humic and other ocean color constituents with Chl (Chl a and pheophytin a) is a condition that must be fulfilled for waters to be classified as Case 1 and for the global chlorophyll-a algorithm to be applied to data that are remotely sensed. This covariance was more evident in March 2006 than in October 2005. Therefore, Chl empirical ocean color algorithms are sensitive to changes in phytoplankton community structure with Chl and also to changes in the relative contribution of absorption and backscattering (CIOTTI et al., 1999; MOREL, 2006). Interestingly enough, the differences in nutrients, CDOM and salinity did not modify the relationships between Sphy and Chl observed in either
period and follow a highly consistent pattern. Thus, the performances of the Chl algorithm for the continental shelf area adjacent to the Santos estuarine complex seem only to be affected by the relative proportions of CDM and Chl.
C
ONCLUSIONSThis study demonstrated that three optical water types occur on the inner continental shelf adjacent to Santos Bay and that these types can be discriminated by spectral remote sensing reflectance. These optical water types reflect physical, biological and chemical characteristics of the waters, and vary spatially due to the seasonal dynamic of water masses and mixing processes between estuarine and shelf waters.
The most important contributor to the light absorption on the inner continental shelf was the CDOM, especially in the region closest to Santos Bay, under the influence of the estuary. However, the importance of CDOM in the area is influenced by the seasonal dynamics of water masses on the shelf, while
CDOM characteristics are due to the distinct origins of the water masses. Consequently, CDOM is likely the principal optical component affecting the performances of empirical ocean color algorithms. All further improved algorithms will be more successful when describing CDOM magnitudes and spectral behavior than in discriminating between distinct phytoplankton communities.
Finally, differences in the performance of the global empirical algorithm (OC3) were observed regarding sampling period and water types. It is suggested that specific algorithms should be used for the continental shelf adjacent to Santos Bay, such as regionally or seasonally fitted empirical algorithms, or semi-analytical models.
A
CKNOWLEDGEMENTSThe authors wish to thank the Fundação de Amparo à Pesquisa do Estado de São Paulo (FAPESP), for the financial support for the institutional project (Proc. Num. 03/09932-1), and also the crew of R.V. Prof. W. Besnard. Melissa Carvalho wishes also to express her thanks to the Conselho Nacional de Pesquisas (CNPq) for their grant.
R
EFERENCESAIDAR, E.; GAETA, S. A.; GIANESELLA-GALVÃO, S. M. F.; KUTNER, M. B. B.; TEIXEIRA, C. Ecossistema costeiro subtropical: nutrientes dissolvidos, fitoplâncton e clorofila-a e suas relações com as condições
oceanográficas na região de Ubatuba, SP. Publ. Esp. Inst. Oceanogr., v. 10, p. 9-43, 1993.
ANDUTTA, F. P.; SANTOS, M. R. M.; MIRANDA, L. B.; ANCONA, C. M.; SALDANHA-CORRÊA, F. M. P.; GIANESELLA, S. M. F. Monthly variations of physical and chemical properties observed in Santos Bay and Santos estuarine channel. In: ENVIRONMENTAL AND HEALTH WORLD CONGRESS, EHWC, Santos, 2006. Proceedings. Santos: Council of Researches in Education and Sciences, 2006. v. 1, p.80–84.
AMINOT, A.; CHAUSSEPIED, M. Manuel des analyses chimiques en milieu marin. Brest: Centre Nationale pour l’Exploitation des Océans, 1983. 395 p.
ARNONE, R. A.; WOOD, A. M.; GOULD Jr., R. W. The evolution of optical water mass classification. Oceanography, v. 17, n. 2, p. 14-15, 2004.
AURIN, D. A.; DIERSSEN, H. M.; TWARDOWSKI, M. S.; ROESLER, C. S. Optical complexity in Long Island Sound and implications for coastal ocean color remote sensing. J. Geophys. Res.: Oceans, v. 115, n. C7, p. 1-18, 2010.
BLONDEAU-PATISSIER, D.; BRANDO, V. E.; OUBELKHEIR, K.; DEKKER, A. G.; CLEMENTSON, L. A.; DANIEL, P. Bio-optical variability of the absorption and scattering properties of the Queensland inshore and reef waters, Australia. J. Geophys. Res.: Oceans, v. 114, C5003, doi:10.1029/2008JC005039, 2009.
BREWIN, R. J. W.; HARDMAN-MOUNTFORD, N. J.; LAVENDER, S. J.; RAITSOS, D. E.; HIRATA, T.; UITZ, J.; DEVRED, E.; BRICAUD, A.; CIOTTI, A.; GENTILI, B. An intercomparison of bio-optical techniques for detecting dominant phytoplankton size class from satellite remote sensing. Remote Sens. Environ., v. 115, n. 2, p. 325-339, 2011.
BRICAUD, A.; CLAUSTRE, H.; RAS, J.; OUBELKHEIR, K. Natural variability of phytoplanktonic absorption in oceanic waters: influence of the size structure of algal populations. J. Geophys. Res.: Oceans, v. 109, n. C11, p. 1-12, 2004.
BRICAUD, A., BABIN, M.; CLAUSTRE, H.; RAS, J.; TIÈCHE, F. Light absorption properties and absorption budget of Southeast Pacific waters. J. Geophys. Res.: Oceans, v. 115, C08009, doi: 10.1029/2009JC005517, 2010.
BRICAUD, A.; CIOTTI, A. M.; GENTILI, B. Spatial-temporal variations in phytoplankton size and colored detrital matter absorption at global and regional scales, as derived from twelve years of SeaWiFS data (1998-2009). Global Biogeochem. Cy., v. 26, n. 1, p. 1-17, 2012. BRICAUD, A.; MOREL, A.; BABIN, M.; ALLALI, K.;
CLAUSTRE, H. Variations of light absorption by suspended particles with chlorophyll a concentration in oceanic (case 1) waters: analysis and implications for bio-optical models. J. Geophys. Res.: Oceans, v. 103, n. C13, p. 31033-31044, 1998.
BRICAUD, A.; MOREL, A.; PRIEUR, L. Absorption by dissolved organic matter of the sea (yellow substance) in the UV and visible domains. Limnol. Oceanogr.,v. 26, p. 43–53, 1981.
BRICAUD, A.; ROESLER, C.; ZANEVELD, J. R. V. In situ
methods for measuring the inherent optical properties of ocean waters. Limnol. Oceanogr., v. 40, n. 2, p. 393-410, 1995.
BUCCI, A. F.; CIOTTI, A. M., POLLERY, R. C. G.; CARVALHO, R. C.; ALBUQUERQUE, H. C.; TOMIDA, L. Temporal variability of chlorophyll-a in
the São Vicente estuary. Braz. J. Oceanogr., v. 60, n. 4, p. 485-499, 2012.
BUKATA, R. P.; JEROME, J. H.; KONDRATYEV, K. Y.; POZDNYAKOV, D. V. Optical properties and remote sensing of inland and coastal waters. Boca Raton: CRC Press, 1995. 362 p.
CAMPOS, E. J. D.; LORENZZETTI, J. A.; STEVENSON, M. R.; STECH, J. L.; SOUZA, R. B. Penetration of waters from the Brazil–Malvinas confluence region along the South American continental shelf up to 23 S. An. Acad. Bras. Cienc., v. 68, n. 1, p. 49–58, 1996. CARDER, K. L.; STEWARD, R. G.; HARVEY, G. R.;
ORTNER, P. B. Marine humic and fulvic acids: their effects on remote sensing of ocean chlorophyll. Limnol. Oceanogr., v. 34, n. l, p. 68-81, 1989.
CARLSON, C. A.; DUCKLOW, H. W. Growth of bactrioplankton and consuption of dissolved organic
carbon in the Sargasso Sea. Aquat. Microb. Ecol., v.10, p. 69-85,1996.
CASTRO, B. M.; LORENZETTI, J. A.; SILVEIRA, I. C. A.; MIRANDA, L. B. Estrutura termohalina e circulação na região entre o Cabo de São Tomé (RJ) e o Chuí (RS). In: ROSSI-WONGTSHOWSKI, C. L.; MADUREIRA, L. S. –P. (Org.). O ambiente oceanográfico da plataforma continental e do talude na região Sudeste-Sul do Brasil. São Paulo: EDUSP, 2006. p.11-120.
CASTRO, B. M.; MIRANDA, L. B.; SILVA, L. S.; FONTES, R. F. C.; PEREIRA, A. F.; COELHO, A. L. Processos físicos: hidrografia, circulação e transporte. In: PIRES-VANIN, A. M. S. (Org.). Oceanografia de um ecossistema subtropical: plataforma de São Sebastião. São Paulo: EDUSP, 2008. p. 59-121.
CASTRO, B. M.; MIRANDA, L. B. Physical oceanography of the western Atlantic Continental shelf located between 4°N and 34°S. In: BRINK, K. H.; ROBINSON, A. R. (Eds.). The sea, ideas and observations on progress in the study of the seas. New York: John Wiley, 1998. p. 209–251.
CASTRO FILHO, B. M.; MIRANDA, L. B.; MIYAO, S. Y. Condições hidrográficas na plataforma continental ao largo de Ubatuba: variações sazonais e em média escala. Bol. Inst. Oceanogr., v. 35, n. 2, p. 135-151, 1987. CIOTTI, A. M.; BRICAUD, A. Retrievals of a size parameter
for phytoplankton and spectral light absorption by colored detrital matter from water-leaving radiances at SeaWiFS channels in a continental shelf region off Brazil. Limnol. Oceanogr.: Methods, v. 4, p. 237-253, 2006.
CIOTTI, A. M.; CULLEN, J. J.; LEWIS, M. R. A semi-analytical model of the influence of phytoplankton community structure on the relationship between light attenuation and ocean color. J. Geophys. Res.: Oceans, v. 104, n. C1, p. 1559-1578, 1999.
CIOTTI, A. M.; LEWIS, M. R.; CULLEN, J. J. Assessment of the relationships between dominant cell size in natural phytoplankton communities and the spectral shape of the absorption coefficient. Limnol. Oceanogr., v. 47, n. 2, p. 404-417, 2002.
CLARKE, K. R.; WARWICK, R. M. Change in marine communities: an approach to statistical analysis and interpretation. 2. ed. Plymouth: PRIMER-E, 2001. D’SA, E.; DIMARCO, S. F. Seasonal variability and controls
on chromophoric dissolved organic matter in a large river-dominated coastal margin. Limnol. Oceanogr., v. 54, n. 6, p. 2233-2242, 2009.
D’SA, E.; MILLER, R. L. Bio-optical properties in waters influenced by the Mississippi River during low flow conditions. Remote Sens. Environ., v. 84, n. 4, p. 538-549, 2003.
DESCHAMPS, P. Y.; FOUGNIE, B.; FROUIN, R.; LECOMTE, P.; VERWAERDE, C. SIMBAD: a field radiometer for satellite ocean-color validation. Appl. Opt., v. 43, n. 20, p. 4055-4069, 2004.
DUYSENS, L. M. The flattening of the absorption spectrum of suspensions as compared to that of solutions. Biochim. Biophys. Acta, v. 19, n. 1, p. 1-12, 1956. FOUGNIE, B.; FROUIN, R.; LECOMTE, P.;
GARCIA, C.; GARCIA, V.; McCLAIN, C. Evaluation of SeaWiFS chlorophyll algorithms in the southwestern Atlantic and southern oceans. Remote Sens. Environ., v. 95, n. 1, p. 125–137, 2005.
GARCIA, V. M. T.; SIGNORINI, S.; GARCIA, C. A. E.; McCLAIN, C. R. Empirical and semi‐analytical chlorophyll algorithms in the south‐western Atlantic coastal region (25–40°S and 60–45°W). Int. J. Remote Sens., v. 27, n. 8, p. 1539–1562, 2006.
GIANESELLA, S. M. F.; SALDANHA-CORRÊA, F. M. P. Nutrientes, séston e biomassa fitoplantônica na plataforma interna de São Sebastião: verão de 1994 e primavera de 1997. Bol. Inst. Pesca, v. 29, n.2, p. 161-172, 2003.
GIANESELLA, S. M. F.; SALDANHA-CORRÊA, F. M. P. Características químicas. In: PIRES-VANIN, A. M. S. (Org.). Oceanografia de um ecossistema subtropical: plataforma de São Sebastião. São Paulo: EDUSP, 2008. p. 183-203.
GRASSHOFF, K.; EHRHARDT, M.; KREMLING, K. (Eds.). Methods of seawater analysis. 2. ed. Weinheim: Verlag Chemie, 1983. 419 p.
HARARI, J.; CAMARGO, R. Numerical simulation of the tidal propagation in the coastal region of Santos (Brazil, 24°S 46°W). Cont. Shelf Res., v. 23, n. 16, p. 1597-1613, 2003.
INTERNATIONAL OCEAN-COLOUR COORDINATING GROUP (IOCCG). Remote sensing of inherent optical properties: fundamental, tests of algorithms and applications. LEE, Z. -P. (Ed.), Reports of the International Ocean-Colour Coordinating Group, n. 5, Dartmouth, Canada, 2006. 126 p.
INTERNATIONAL OCEAN-COLOUR COORDINATING GROUP (IOCCG). Remote sensing of ocean colour in coastal, and other optically-complex, waters. SATHYENDRANATH, S. (Ed.). Reports of the International Ocean-Colour Coordinating Group, n. 3, Dartmouth, Canada, 2000, 140 p.
KEITH, D. J.; YODER, J. A.; FREEMAN, S. A. Spatial and temporal distribution of Coloured Dissolved Organic Matter (CDOM) in Narragansett Bay, Rhode Island: implications for phytoplankton in coastal waters. Estuarine, Coastal Shelf Sci.,v. 55, n. 5, p. 705-717, 2002.
KIRK, J. T. O. Light and photosynthesis in aquatic ecosystems. Cambridge: New York: Cambridge University Press, 1994. 500 p.
MANNINO, A.; RUSS, M. E.; HOOKER, S. B. Algorithm development and validation for satellite-derived distributions of DOC and CDOM in the U.S. Middle Atlantic Bight. J. Geophys. Res.: Oceans, v.113, C07051-C0770, 2008.
MÖLLER Jr., O.; PIOLA, A.; FREITAS, A; CAMPOS, E. The effects of river discharge and seasonal winds on the shelf off southeastern South America. Cont. Shelf Res., v. 28, n. 13, p. 1607-1624, 2008.
MOREL, A. Meeting the challenge of monitoring chlorophyll in the ocean from outer space. In: GRIMM, B.; PORRA, R.J.; RÜDIGER, W.; SCHEER, H. (Eds). Chlorophylls and bacteriochlorophylls: biochemistry, biophysics, functions and applications. Dordrecht: Springer, 2006. p. 521–534. (Advances in photosynthesis and respiration; v. 25).
MOREL, A.; PRIEUR, L. Analysis of variations in ocean color. Limnol. Oceanogr., v. 22, n. 4, p. 709-722, 1977. MOSER, G. A. O.; CIOTTI, A. M.; GIANNINI, M. F. C.;
TONINI, R. T.; HARARI, J. Changes in phytoplankton composition in response to tides, wind-induced mixing conditions, and freshwater outflows in an urbanized estuarine complex. Braz. J. Biol., v. 72, n. 1, p. 97-111, 2012.
MOSER, G. A. O.; GIANESELLA, S. M.; ALBA, J. J. B.; LUVIZON BÉRGAMO, A.; SALDANHA-CORRÊA, F. M. P.; MIRANDA, L. B.; HARARI, J. Instantaneous transport of salt, nutrients, suspended matter and chlorophyll-a in the tropical estuarine system of Santos. Braz. J. Oceanogr., v. 53, n. 3/4, p. 115-127, 2005. MUELLER, J. L.; AUSTIN, R. W. Ocean optics protocols
for SeaWIFS validation: revision 1. Greenbelt: NASA Goddard Space Flight Center, 1995. p. 66. (NASA Technical Memorandum 104566; v. 25).
NELSON, N. B.; SIEGEL, D. A.; MICHAELS, A. F. Seasonal dynamics of colored dissolved material in the Sargasso Sea. Deep-Sea Res., Part I, v. 5, p. 931-957, 1998.
O’REILLY, J. E.; MARITORENA, S.; O’BRIEN, M. C.; SIEGEL, D. A.; TOOLE, D.; MENZIES, D.; SMITH, R. C.; MUELLER, J. L.; MITCHELL, B. G.; KAHRU, M.; CHAVEZ, F. P.; STRUTTON, P.; COTA, G. F.; HOOKER S. B.; MCCLAIN, C. R.; CARDER, K. L.; MÜLLER-KARGER, F.; HARDING, L.; MAGNUSON, A.; PHINNEY, D.; MOORE, G. F.; AIKEN, J.; ARRIGO, K. R.; LETELIER, R.; CULVER, M. SeaWiFS postlaunch calibration and validation analyses: part 3. NASA Goddard Space Flight Center, 1998a. 49 p. (NASA Technical Memorandum 2000-206892, v. 11).
O’REILLY, J. E.; MARITORENA, S.; MITCHELL, B. G.; SIEGEL, D. A. M.; CARDER, K. L.; GARVER, S. A.; KAHRU, M.; MCCLAIN, C. Ocean color chlorophyll algorithms for SeaWiFS. J. Geophys. Res.: Oceans, v. 103, n. C11, p. 24937- 24953, 1998b.
O’REILLY, J. E.; MARITORENA, S.; SIEGEL, D. A.; O’BRIEN, M. C.; TOOLE, D.; MITCHELL, B. G.; KAHRU, M.; CHAVEZ, F. P.; STRUTTON, P.; COTA, G. F.; HOOKER, S. B.; MCCLAIN C. R.; CARDER, K. L.; MULLER-KARGER, F.; HARDING, L.; MAGNUSON, A.; PHINNEY, D.; MOORE, G. F.; AIKEN, J.; ARRIGO, K. R.; LETELIER, R.; CULVER, M. Ocean color chlorophyll a algorithms for SeaWiFS, OC2, and OC4: version 4. SeaWiFS postlaunch calibration and validation analyses, Part 3. In: O’REILLY, J. E.; MARITORENA, S.; O’BRIEN, M. C.; SIEGEL, D. A.; TOOLE, D.; MENZIES, D.; SMITH, R. C.; MUELLER, J. L.; MITCHELL, B. G.; KAHRU, M.; CHAVEZ, F. P.; STRUTTON, P.; COTA, G. F.; HOOKER S. B.; MCCLAIN, C. R.; CARDER, K. L.; MÜLLER-KARGER, F.; HARDING, L.; MAGNUSON, A.; PHINNEY, D.; MOORE, G. F.; AIKEN, J.; ARRIGO, K. R.; LETELIER, R.; CULVER, M. SeaWiFS postlaunch calibration and validation analyses: part 3. NASA Goddard Space Flight Center, 2000. p. 9-23. (NASA Technical Memorandum 2000-206892, v. 11).
PIOLA, A; ROMERO, S.; ZAJACZKOVSKI, U. Space-time variability of the Plata plume inferred from ocean color.
SALDANHA-CORRÊA, F. M. P.; GIANESELLA, S. M. F. Produção primária e fitoplâncton. In: PIRES-VANIN, A. M. S. (Org.). Oceanografia de um ecossistema subtropical: plataforma de São Sebastião. São Paulo: EDUSP, 2008. p. 223-251.
SALDANHA-CORRÊA, F. M. P.; GIANESELLA, S. M. F.; BARRERA-ALBA, J. J. A comparison of the retention capability among three different glass-fiber filters used for chlorophyll determinations. Braz. J. Oceanogr., v. 52, p. 245-249, 2004.
SALVADOR, S.; CHAN, P. Determining the number of clusters / segments in hierarchical clustering / segmentation algorithms. In: IEEE INTERNATIONAL CONFERENCE ON TOOLS WITH ARTIFICIAL INTELIGENCE, 16, Boca Raton, 2004. Proceedings. Boca Raton: IEEE Computer Society, 2004. p. 576-584. SCOR-UNESCO. Determination of photosynthetic
pigments in sea-water. Paris: UNESCO, 1966. p. 11-18. Publications, (Monographs on oceanographic methodology; v.1). [Report of SCOR-Unesco Working Group 17 which met from 4 to 6 June 1964, Unesco, Paris].
SHOAF, W. T.; LIUM, B. W. Improved extraction of chlorophyll a and b from algae using dimethyl sulfoxide. Limnol. Oceanogr., v.21, p. 926-928, 1976.
SIEGEL, D. A.; MARITORENA, S.; NELSON, N. B.; HANSELL, D. A.; LORENZI-KAYSER, M. Global distribution and dynamics of colored dissolved and detrital organic materials. J. Geophys. Res.: Oceans, v. 107, n. C12, p. 21-1-21-14, 2002.
STEFFEN, C. A. Técnicas radiométricas com o Spectron SE-590. In: SIMPÓSIO BRASILEIRO DE SENSORIAMENTO REMOTO, 8., Salvador, 1996. Anais. São José dos Campos: INPE, 1996. p. 969-975. TASSAN, S.; FERRARI, G. M. An alternative approach to
absorption measurements of aquatic plants retained on filters. Limnol. Oceanogr., v. 40, p. 1358-1368, 1995.
TASSAN, S., FERRARI, G. M.; BRICAUD, A.; BABIN, M. Variability of the amplification factor of light absorption by filter-retained aquatic particles in the coastal environment. J. Plankton Res., v. 22, n. 4, p. 659-668, 2000.
TORRECILLA, E.; STRAMSKI, D.; REYNOLDS, R. A.; MILLÁN-NÚNES, E.; PIERA, J. Cluster analysis of hyperspectral optical data for discriminating phytoplankton pigment assemblages in the open ocean. Remote Sens. Environ., v. 115, n. 10, p. 2578-2593, 2011.
TWARDOWSKI, M. S.; DONAGHAY, P. L. Photobleaching of aquatic dissolved materials: absorption removal, spectral alteration, and their interrelationship. J. Geophys. Res.: Oceans, v. 107, n. C8, p. 6-1-6-12, 2002.
TWARDOWSKI, M. S.; BOSS, E.; SULLIVAN, J. M.; DONAGHAY, P. L. Modeling the spectral shape of absorption by chromophoric dissolved organic matter. Mar. Chem., v. 89, n. 1/4, p. 69-88, 2004.
WELSCHMEYER, N. A. Fluorometric analysis of chlorophyll a in the presence of chlorophyll b and pheopigments. Limnol. Oceanogr., v. 39, p. 1985-1992, 1994.
YENTSCH, C. S.; PHINNEY, D. A. A bridge between ocean optics and microbial ecology. Limnol. Oceanogr., v. 34, n. 8, p. 1694-1705, 1989.