BGD
10, 3735–3846, 2013Estimating global carbon uptake by
lichens and bryophytes
P. Porada et al.
Title Page
Abstract Introduction
Conclusions References
Tables Figures
◭ ◮
◭ ◮
Back Close
Full Screen / Esc
Printer-friendly Version Interactive Discussion
Discussion
P
a
per
|
Dis
cussion
P
a
per
|
Discussion
P
a
per
|
Discussio
n
P
a
per
|
Biogeosciences Discuss., 10, 3735–3846, 2013 www.biogeosciences-discuss.net/10/3735/2013/ doi:10.5194/bgd-10-3735-2013
© Author(s) 2013. CC Attribution 3.0 License.
Open Access
Biogeosciences Discussions
Geoscientiic Geoscientiic
Geoscientiic Geoscientiic
This discussion paper is/has been under review for the journal Biogeosciences (BG). Please refer to the corresponding final paper in BG if available.
Estimating global carbon uptake by
lichens and bryophytes with a
process-based model
P. Porada1, B. Weber2, W. Elbert3, U. P ¨oschl3, and A. Kleidon1
1
Max Planck Institute for Biogeochemistry, P.O. Box 10 01 64, 07701 Jena, Germany
2
University of Kaiserslautern, P.O. Box 3049, 67653 Kaiserslautern, Germany
3
Max Planck Institute for Chemistry, P.O. Box 3060, 55020 Mainz, Germany
Received: 14 January 2013 – Accepted: 4 February 2013 – Published: 28 February 2013 Correspondence to: P. Porada ([email protected])
Published by Copernicus Publications on behalf of the European Geosciences Union.
BGD
10, 3735–3846, 2013Estimating global carbon uptake by
lichens and bryophytes
P. Porada et al.
Title Page
Abstract Introduction
Conclusions References
Tables Figures
◭ ◮
◭ ◮
Back Close
Full Screen / Esc
Printer-friendly Version Interactive Discussion
Discussion
P
a
per
|
Dis
cussion
P
a
per
|
Discussion
P
a
per
|
Discussio
n
P
a
per
|
Abstract
Lichens and bryophytes are abundant globally and they may even form the dominant autotrophs in (sub)polar ecosystems, in deserts and at high altitudes. Moreover, they can be found in large amounts as epiphytes in old-growth forests. Here, we present the first process-based model which estimates the net carbon uptake by these organisms
5
at the global scale, thus assessing their significance for biogeochemical cycles. The model uses gridded climate data and key properties of the habitat (e.g. disturbance intervals) to predict processes which control net carbon uptake, namely photosynthe-sis, respiration, water uptake and evaporation. It relies on equations used in many dynamical vegetation models, which are combined with concepts specific to lichens
10
and bryophytes, such as poikilohydry or the effect of water content on CO
2 diffusivity. To incorporate the great functional variation of lichens and bryophytes at the global scale, the model parameters are characterised by broad ranges of possible values instead of a single, globally uniform value. The predicted terrestrial net carbon up-take of 0.34 to 3.3 (Gt C) yr−1and global patterns of productivity are in accordance with
15
empirically-derived estimates. Considering that the assimilated carbon can be invested in processes such as weathering or nitrogen fixation, lichens and bryophytes may play a significant role in biogeochemical cycles.
1 Introduction
Lichens and bryophytes are different from vascular plants: Lichens are no real plants,
20
but a symbiosis of a fungus and at least one green alga or cyanobacterium, whereas bryophytes, such as mosses or liverworts, are plants which have no specialised tissue such as roots or stems. Both groups are poikilohydrous, which means that they cannot actively control their water content because they do not have an effective epidermal tissue, a cuticle or stomata. Mainly due to their ability to tolerate dessication, combined
25
with large functional variation, they are extremely adaptive organisms that can cope
BGD
10, 3735–3846, 2013Estimating global carbon uptake by
lichens and bryophytes
P. Porada et al.
Title Page
Abstract Introduction
Conclusions References
Tables Figures
◭ ◮
◭ ◮
Back Close
Full Screen / Esc
Printer-friendly Version Interactive Discussion
Discussion
P
a
per
|
Dis
cussion
P
a
per
|
Discussion
P
a
per
|
Discussio
n
P
a
per
|
with a great range of climatic conditions (Nash III, 1996). They grow as epiphytes on the bark or even on the leaves of trees, they cover rock outcrops and they form carpets on the forest floor at high latitudes. As a part of biological soil crusts, they also populate the surface of desert soils (Belnap and Lange, 2003).
In spite of their global abundance, however, the effect of lichens and bryophytes on
5
global biogeochemical cycles has been examined only by a few studies. The work of Elbert et al. (2012), for instance, suggests a significant contribution of cryptogamic covers, which largely consist of lichens and bryophytes, to global cycles of carbon and nitrogen. They use a large amount of data from field experiments or lab measurements to estimate characteristic mean values of net carbon uptake and nitrogen fixation for
10
each of the world’s biomes. By multiplying these mean values with the area of the respective biome they arrive at global numbers for uptake of carbon and nitrogen. While their estimate for global net carbon uptake amounts to 7 % of terrestrial net primary productivity (NPP), the derived value of nitrogen fixation corresponds to around 50 % of the terrestrial uptake, representing a large impact on the global nitrogen cycle.
15
Lichens and bryophytes may have also played an important role with respect to bio-geochemical cycles in the geological past. From the early Paleozoic on, the prede-cessors of today’s lichens and bryophytes have likely contributed to the enhancement of surface weathering rates (Lenton et al., 2012). The organisms accelerate chemical weathering reactions of the substrate by releasing organic acids, complexing agents,
20
hydroxide ions or respiratory CO2 (Jackson and Keller, 1970; Berthelin, 1988; Chen et al., 2000; B ¨udel et al., 2004; Weber et al., 2011). On long time scales, weather-ing rates of silicates control atmospheric CO2 concentration and thus have a large influence on global climate. The work of Schwartzmann and Volk (1989) shows, for example, that without biotic enhancement of weathering in the course of evolution,
25
atmospheric CO2would have remained at a high level. The surface temperature asso-ciated with this CO2level would probably have been too high for complex life to evolve. Lenton et al. (2012) focus on the effect of the predecessors of modern bryophytes on
atmospheric CO2concentration during the Ordovician. According to their experiments,
BGD
10, 3735–3846, 2013Estimating global carbon uptake by
lichens and bryophytes
P. Porada et al.
Title Page
Abstract Introduction
Conclusions References
Tables Figures
◭ ◮
◭ ◮
Back Close
Full Screen / Esc
Printer-friendly Version Interactive Discussion
Discussion
P
a
per
|
Dis
cussion
P
a
per
|
Discussion
P
a
per
|
Discussio
n
P
a
per
|
these early non-vascular plants could have caused a considerable drawdown in atmo-spheric CO2levels via the silicate weathering feedback and, consequently, a decrease in global surface temperature. Furthermore, the release of phosphorus from the weath-ered rocks into the oceans could have led to a rise in marine productivity and therefore to further cooling. According to Lenton et al. (2012) this could explain two temporary
5
glaciations at the end of the Ordovician period.
Here, we present a process-based modelling approach to estimate the global net carbon uptake of lichens and bryophytes. In this way, we are able to assess the role of these organisms regarding global biogeochemical cycles.
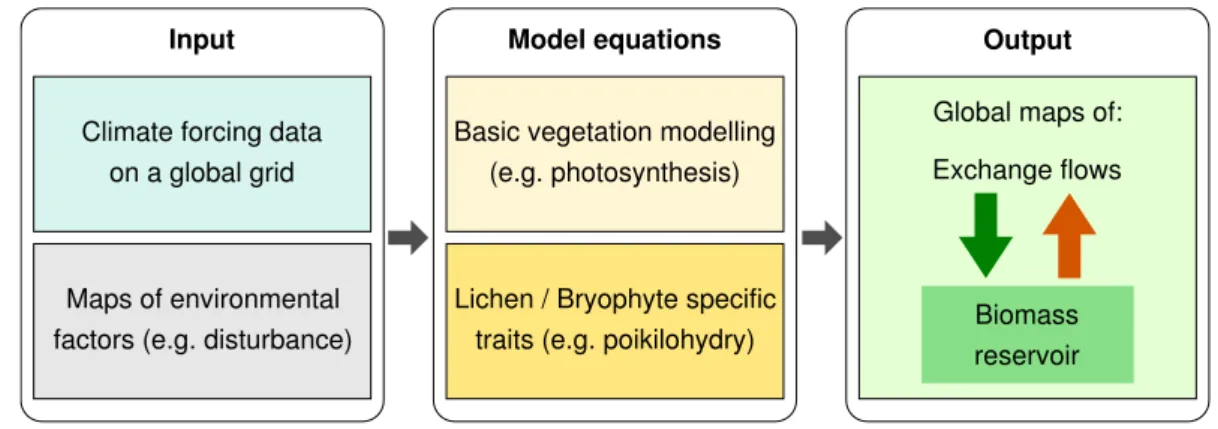
The model is called “LiBSi” (Lichen and Bryophyte Simulator). It is similar to many
10
global vegetation models (see Fig. 1). These models describe plants in a simplified way instead of simulating them with all their detailed structures. Vegetation is usually rep-resented by a reservoir of biomass, which changes as a function of exchange flows of carbon. These exchange flows depend on processes such as photosynthesis and res-piration, which are represented by a set of equations. The equations use environmental
15
factors such as radiation or water supply as input values which are either prescribed or derived from climate forcing data. In spite of their simplicity, global vegetation models are capable of predicting NPP to a reasonable accuracy (Randerson et al., 2009).
Similar to these models, our model describes lichens and bryophytes as reservoirs of biomass located either on the soil or in the canopy and it is based on equations
20
to represent photosynthesis and other physiological processes. These concepts are combined with properties and processes specific to lichens and bryophytes, such as the decrease of diffusivity for CO2 with increasing water content or the proportional
relationship between metabolic activity and water saturation. The model differs from
most other vegetation models with respect to the parameters contained in the model
25
equations. Most models use parameter values that describe an “average” organism, such as a typical rain forest tree, for example. Our model uses ranges of possible parameter values which are derived from the literature. This approach is similar to the one used in the JeDi-DGVM (Jena Diversity-Dynamic Global Vegetation Model), which
BGD
10, 3735–3846, 2013Estimating global carbon uptake by
lichens and bryophytes
P. Porada et al.
Title Page
Abstract Introduction
Conclusions References
Tables Figures
◭ ◮
◭ ◮
Back Close
Full Screen / Esc
Printer-friendly Version Interactive Discussion
Discussion
P
a
per
|
Dis
cussion
P
a
per
|
Discussion
P
a
per
|
Discussio
n
P
a
per
|
predicts global biogeochemical flows as well as biodiversity patterns (Pavlick et al., 2012). In this way, the model accounts for the large functional variation of lichens or bryophytes at the global scale concerning properties such as photosynthetic capacity or specific area.
The paper is structured in the following way: Sect. 2 contains a description of the
5
model, including an overview of the reservoirs and exchange flows as well as the envi-ronmental factors that control these flows. In addition, the method for simulating func-tional variation of lichens and bryophytes by parameter ranges is explained. Estimates of net carbon uptake are presented in Sect. 3 together with an evaluation of the model performance. The model is evaluated by comparing simulated productivity of lichens
10
and bryophytes with observational data. Furthermore, the uncertainty regarding the values of model parameters is assessed through a sensitivity analysis. In Sect. 4 the plausibility of the simulated patterns of productivity is discussed. Also the limitations of the approach presented here are analysed considering the outcomes of model eval-uation and sensitivity analysis. Several potential improvements of the model and its
15
applicability to further research are discussed.
2 Model description
Lichens and bryophytes are described in the model by a reservoir approach, which means that they are represented by pools of chemical substances. These are biomass, sugar reserves, water and internal CO2concentration.
20
Changes in the size of these pools are due to input and output flows of carbon or water. Carbon is assimilated by photosynthesis from the atmosphere and temporarily stored as sugars. The sugars are then respired for maintenance or transformed into biomass. Water is taken up and evaporates via the thallus surface. The water content of the thallus influences several physiological processes, such as CO2diffusion.
25
The processes which determine the carbon and water flows are driven by climate. In addition to the climate forcing, also properties of the living environment affect lichens
BGD
10, 3735–3846, 2013Estimating global carbon uptake by
lichens and bryophytes
P. Porada et al.
Title Page
Abstract Introduction
Conclusions References
Tables Figures
◭ ◮
◭ ◮
Back Close
Full Screen / Esc
Printer-friendly Version Interactive Discussion
Discussion
P
a
per
|
Dis
cussion
P
a
per
|
Discussion
P
a
per
|
Discussio
n
P
a
per
|
and bryophytes in the model. These properties depend on the location of growth, which is either the canopy or the ground, as well as the surrounding vegetation, which is described by a biome classification.
2.1 Model processes
In the following, we describe the physiological processes implemented in the model.
5
First, we name the effects of the living environment on lichens and bryophytes. Then,
we explain how water content and climatic factors relate to physiological properties of the organism. Finally, we describe the exchange flows between the organism and its environment.
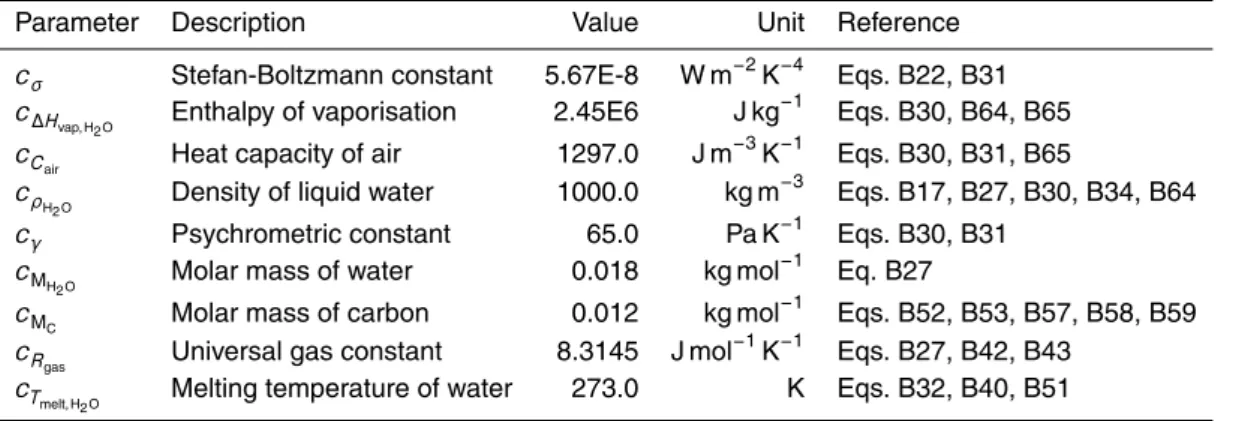
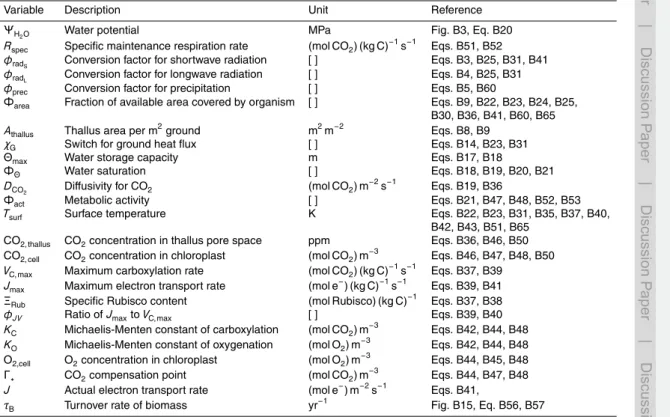
For simplicity, we will not present any equations. All equations used in the model can
10
be found in Appendix B and are explained there. The parameters associated with the equations are listed in Tables B7 to B13 in the Appendix.
2.1.1 Living environment
In the model, lichens and bryophytes can be located either in the canopy or on the ground. The location of growth is important for the radiation and precipitation regime
15
the organism is exposed to (see Fig. 2). Lichens and bryophytes living in the upper part of the canopy, for example, may receive more shortwave radiation than those living beneath the canopy. Additionally, the location of growth determines the available area for growth. The available area in the canopy is assumed to be the sum of Leaf Area Index (LAI) and Stem Area Index (SAI). The available area on the ground depends on
20
(a) the amount of soil not occupied by other vegetation and (b) LAI, since the litter layer resulting from leaf fall impedes the growth of lichens and bryophytes (see Fig. 2). Once a lichen or bryophyte covers the available area completely it cannot grow anymore. Since the biomass of an organism is related to its surface area, also biomass is limited by the available area.
25
BGD
10, 3735–3846, 2013Estimating global carbon uptake by
lichens and bryophytes
P. Porada et al.
Title Page
Abstract Introduction
Conclusions References
Tables Figures
◭ ◮
◭ ◮
Back Close
Full Screen / Esc
Printer-friendly Version Interactive Discussion
Discussion
P
a
per
|
Dis
cussion
P
a
per
|
Discussion
P
a
per
|
Discussio
n
P
a
per
|
Another factor that shapes the living environment of lichens and bryophytes is the biome where the organisms are located. In the model, the biome controls the frequen-cies of disturbance events, such as fire or treefall, for instance. Furthermore, both loca-tion of growth and biome determine the aerodynamic roughness of the surface where lichens or bryophytes grow. A forest, for example, has a higher roughness than a flat
5
desert. Together with wind speed, surface roughness has a large impact on the aerody-namic resistance to heat transfer between the surface and the atmosphere (Allen et al., 1998). Lichens and bryophytes in the canopy of an open forest, for instance, exchange heat faster than those on the flat surface of a desert.
2.1.2 Water relations
10
The water saturation of a lichen or bryophyte is the ratio of actual water content to water storage capacity of the thallus, where the latter is proportional to biomass. The water saturation controls three important physiological properties:
1. The diffusivity of the thallus for CO2 which is inversely related to water content,
since water leads to a swelling of cells and thus to a narrowing of the diffusion
15
pathways (Cowan et al., 1992).
2. The water potential which increases from−∞at zero water content to a maximum value of 0 at a certain threshold saturation. If the water content is above this threshold, all cells in the thallus are fully turgid and extracellular water may exist inside the thallus or on its surface.
20
3. The metabolic activity of a lichen or bryophyte which is assumed to increase lin-early from 0 at zero water content to 1 at the threshold saturation. It remains 1 if the water content exceeds the threshold saturation. This relation accounts for the fact, that water is needed in the cells of the organism to activate enzymes and to enable chemical reactions. At constant temperature, the relation of metabolic
25
BGD
10, 3735–3846, 2013Estimating global carbon uptake by
lichens and bryophytes
P. Porada et al.
Title Page
Abstract Introduction
Conclusions References
Tables Figures
◭ ◮
◭ ◮
Back Close
Full Screen / Esc
Printer-friendly Version Interactive Discussion
Discussion
P
a
per
|
Dis
cussion
P
a
per
|
Discussion
P
a
per
|
Discussio
n
P
a
per
|
activity and water content is proportional to the one of dark respiration and water content.
Note that the water relations implemented in the model allow to represent the species-specific dependency of photosynthesis on water content. At low water con-tent, photosynthesis is limited by metabolic activity while at higher water content it is
5
limited by the diffusivity of the thallus for CO2. Depending on the relative strength of
these limitations, different shapes of the relation between photosynthesis and water
content can be simulated.
2.1.3 Climate relations
The climate forcing consists of air temperature, wind speed, relative humidity,
precipi-10
tation and downwelling short- and longwave radiation. These climatic factors influence exchange flows of carbon and water between lichens and bryophytes and their envi-ronment. Furthermore, the climatic factors directly control two physiological properties of lichens and bryophytes, namely potential evaporation and surface temperature.
Both potential evaporation and surface temperature are calculated according to
Mon-15
teith (1981) as a function of four factors:
1. Net radiation, which is the sum of downwelling short- and longwave radiation, upwelling longwave radiation and the ground heat flux.
2. Saturation vapour pressure, which is calculated as a function of air tempera-ture (Allen et al., 1998). It is also influenced by the water potential of a lichen
20
or bryophyte (Nikolov et al., 1995).
3. Aerodynamic resistance to heat transfer.
4. Relative humidity.
Additionally to the climate forcing, physiological processes of lichens and bryophytes are affected by the presence of snow. If the snow layer exceeds a certain thickness, it
25
BGD
10, 3735–3846, 2013Estimating global carbon uptake by
lichens and bryophytes
P. Porada et al.
Title Page
Abstract Introduction
Conclusions References
Tables Figures
◭ ◮
◭ ◮
Back Close
Full Screen / Esc
Printer-friendly Version Interactive Discussion
Discussion
P
a
per
|
Dis
cussion
P
a
per
|
Discussion
P
a
per
|
Discussio
n
P
a
per
|
is assumed that the metabolism of the organisms is reduced due to lack of light and low temperature.
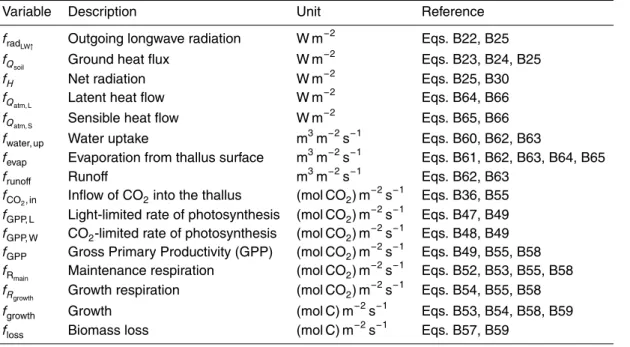
2.1.4 Exchange flows
A schematic of the exchange flows of carbon and water between lichens and bryophytes and their environment is shown in Fig. 3 together with relations to climate
5
forcing and reservoirs inside the thallus.
The inflow of CO2into the pore space of the lichen or bryophyte depends on the gra-dient between the partial pressure of CO2in the atmosphere and in the pore space as well as the diffusivity of the thallus for CO
2.
The uptake of CO2from the pore space (Gross Primary Productivity, GPP) is
com-10
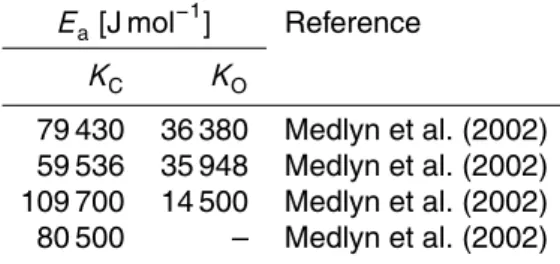
puted as a minimum of a light-limited rate, which depends on intercepted shortwave radiation, and a CO2-limited rate, which is a function of pore space CO2 (Farquhar and von Caemmerer, 1982). Both rates also depend on the surface temperature of the organism (Medlyn et al., 2002) and its metabolic activity status. Photosynthesis is assumed to peak around an optimum surface temperature (June et al., 2004).
15
Respiration is modelled by aQ10relationship as function of biomass and temperature (Kruse et al., 2011). Same as GPP it also depends on metabolic activity. The respired CO2is released into the pore space.
Hence, the CO2 balance of the lichen or bryophyte pore space is controlled by in-flow, GPP and respiration. GPP is added to the sugar reservoir, while respiration is
20
subtracted. Then, a certain fraction of the sugar reservoir is transformed into biomass with a certain efficiency. This constitutes the Net Primary Productivity (NPP). The
bal-ance of the biomass reservoir is then determined by NPP and biomass loss, which in-cludes regular processes such as tissue turnover or leaching of carbohydrates (Melick and Seppelt, 1992). Additionally, disturbance events which occur at characteristic time
25
intervals lead to a reduction of biomass.
Evaporation from the lichen or bryophyte thallus is computed as a minimum of wa-ter content and potential evaporation. Since lichens and bryophytes cannot actively
BGD
10, 3735–3846, 2013Estimating global carbon uptake by
lichens and bryophytes
P. Porada et al.
Title Page
Abstract Introduction
Conclusions References
Tables Figures
◭ ◮
◭ ◮
Back Close
Full Screen / Esc
Printer-friendly Version Interactive Discussion
Discussion
P
a
per
|
Dis
cussion
P
a
per
|
Discussion
P
a
per
|
Discussio
n
P
a
per
|
control water loss, evaporation is not affected by the activity status of the organism.
Water uptake takes place via the thallus surface. Where water input exceeds maximum storage capacity, surplus water is redirected to runoff. The water balance of the lichen or bryophyte is thus determined by evaporation and water uptake.
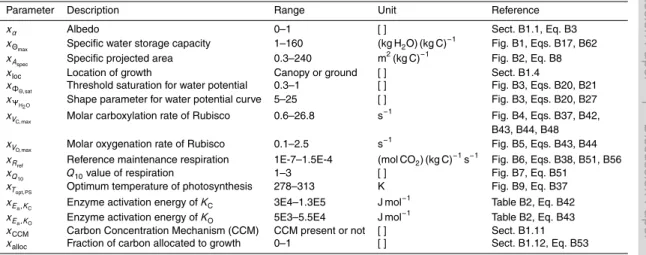
2.2 Model parameters
5
The equations that describe physiological processes in the model are parameterised and the parameters can be subdivided into two categories: properties of lichens and bryophytes and characteristics of the environment of the organisms. Since lichens and bryophytes have a large functional variation, the parameters that represent their proper-ties, such as specific area or photosynthetic capacity, are characterised by large ranges
10
of possible values. To incorporate the functional variation of lichens and bryophytes into the model, many physiological strategies are generated by randomly sampling the ranges of possible parameter values. We call these parameterisations “strategies” and not “species”, because they do not correspond exactly to any species that can be found in nature. Nevertheless, these strategies are assumed to represent the physiological
15
properties of real lichen and bryophyte species in a realistic way. Hence, the functional variation of the organisms can be simulated without knowing the exact details of each species.
The model is then run with all strategies, but not every strategy is able to maintain a positive biomass in each grid cell, which is necessary to survive. The results are
com-20
puted by averaging only over the surviving strategies of each grid cell. Thus, climate is used as a filter to narrow the ranges of possible parameter values in each grid cell and therefore to make the results more accurate (see Fig. 4).
The studies of Bloom et al. (1985) and Hall et al. (1992) analyse from a theoretical perspective the relations between the “strategy” of an organism and the success of this
25
organism regarding natural selection in a certain environment. Follows and Dutkiewicz (2011) apply this approach to marine ecosystems while Kleidon and Mooney (2000) use it to predict biodiversity patterns of terrestrial vegetation. The applicability of this
BGD
10, 3735–3846, 2013Estimating global carbon uptake by
lichens and bryophytes
P. Porada et al.
Title Page
Abstract Introduction
Conclusions References
Tables Figures
◭ ◮
◭ ◮
Back Close
Full Screen / Esc
Printer-friendly Version Interactive Discussion
Discussion
P
a
per
|
Dis
cussion
P
a
per
|
Discussion
P
a
per
|
Discussio
n
P
a
per
|
method to modelling biogeochemical fluxes of terrestrial vegetation has been success-fully demonstrated by the JeDi-DGVM (Pavlick et al., 2012).
The 15 model parameters which are included in the random sampling method are listed in Table B9 in the appendix. They represent structural properties of the thallus of a lichen or bryophyte, such as specific area or water storage capacity. They also describe
5
implications of the thallus structure, such as the relation between water content and water potential. Furthermore characteristics of the metabolism are considered, such as optimum temperature. Also parameters which have categorical values are used: a lichen or bryophyte can either live in the canopy or at the soil surface (see Sect. 2.1.1). Another categorical parameter determines if the organism has a carbon concentration
10
mechanism (CCM) or not. Although regulation of the CCM has been observed (Miura et al., 2002), the model contains a fixed representation of the CCM for simplicity.
Some of the 15 parameters mentioned above are related to further lichen or bryophyte parameters. The respiration rate at a certain temperature, for instance, is assumed to be related to Rubisco content and turnover rate. Hence, the parameters
15
“Rubisco content” and “turnover rate” are not sampled from ranges of possible values, but determined by the value of the parameter “respiration rate”. The reason for this re-lationship is an underlying physiological constraint, in this case, maintenance costs of enzymes. A lichen or bryophyte with a high concentration of Rubisco, for example, has to maintain these enzymes and therefore also shows a high respiration rate and a high
20
turnover rate. These relationships are called tradeoffs. The parameters which describe
the tradeoffs are assumed to have constant values.
Six tradeoffs are implemented in the model. The first tradeoff describes the
rela-tion between Rubisco content, respirarela-tion rate and turnover rate explained above. The second tradeoffrelates the diffusivity for CO2to the metabolic activity of the lichen or
25
bryophyte via its water content. This means that a high diffusivity is associated with a
low water content which results in a low activity. The third tradeoffdescribes the positive
correlation between the maximum electron transport rate of the photosystems (Jmax) and the maximum carboxylation rate (VC, max). Since both rates represent costs for the
BGD
10, 3735–3846, 2013Estimating global carbon uptake by
lichens and bryophytes
P. Porada et al.
Title Page
Abstract Introduction
Conclusions References
Tables Figures
◭ ◮
◭ ◮
Back Close
Full Screen / Esc
Printer-friendly Version Interactive Discussion
Discussion
P
a
per
|
Dis
cussion
P
a
per
|
Discussion
P
a
per
|
Discussio
n
P
a
per
|
organism and photosynthesis is the minimum of the two, it would be inefficient if they
were independent from each other. The fourth tradeoffis associated with the carbon
concentration mechanism (CCM). In case a lichen or bryophyte possesses a CCM, a part of the energy acquired by the photosystems is not used to fix CO2, but to increase the CO2concentration in the photobionts. If the organism is limited by low CO2or high
5
photorespiration but enough light is available, a CCM can lead to higher productivity. The fifth and sixth tradeoffs concern the Michaelis-Menten constants of the
carboxy-lation and oxygenation reactions of Rubisco. They relate these constants to the molar carboxylation and oxygenation rates of Rubisco. One tradeoffis usually associated with more than one parameter. The model parameters that describe tradeoffs are listed in
10
Table B10.
The model contains several additional lichen or bryophyte parameters which are not directly associated with tradeoffs, but which represent physiological or physical
constraints. Therefore, they are assumed to have constant values. They can be found in Table B11.
15
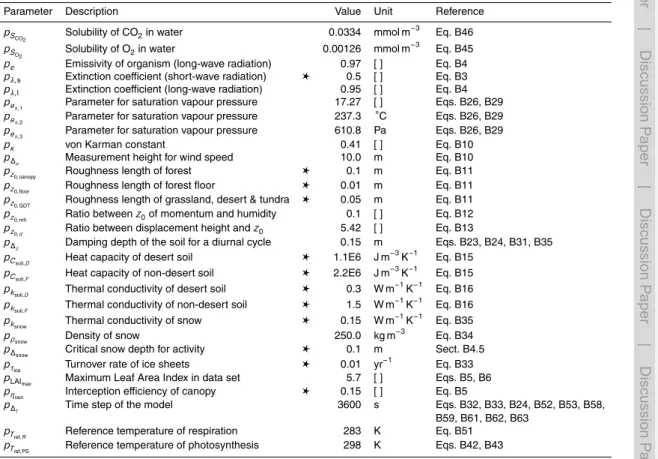
In addition to the parameters that describe properties of the lichens and bryophytes, the model contains parameters that represent environmental conditions. They describe the extinction of light as a function of LAI, the interception efficiency for precipitation
of the canopy, characteristics of the snow cover, thermal properties of the upper soil layer, roughness of the surface regarding wind and the time intervals for disturbance
20
in the different biomes. For the sake of simplicity, no ranges are specified for these
parameters, only average values of the corresponding variables are used. The density of snow, for instance, varies typically from 100 to 500 kg m−3 (Domine et al., 2011) depending on many factors, such as age, for example, which are not considered in the model. Hence, snow density is set to a constant global average value. For a list of
25
parameters related to environmental conditions, see Table B8.
BGD
10, 3735–3846, 2013Estimating global carbon uptake by
lichens and bryophytes
P. Porada et al.
Title Page
Abstract Introduction
Conclusions References
Tables Figures
◭ ◮
◭ ◮
Back Close
Full Screen / Esc
Printer-friendly Version Interactive Discussion
Discussion
P
a
per
|
Dis
cussion
P
a
per
|
Discussion
P
a
per
|
Discussio
n
P
a
per
|
2.3 Simulation setup
The model runs on a global rectangular grid with a resolution of 2.8125 degrees (T42), hence all input data are remapped to this resolution. The land mask and the climate forcing are taken from the WATCH data set (Weedon et al., 2011). This data set com-prises shortwave radiation, downwelling longwave radiation, rainfall, snowfall, air
tem-5
perature at 2 m height, wind speed at 10 m height, surface pressure and specific hu-midity. The latter two variables are used to compute relative huhu-midity. The temporal resolution of the data is 3 h and the years 1958 to 2001 are used. Since the model runs on an hourly time step, the data is interpolated. In addition to the climate forcing, the model uses maps of LAI and SAI in a monthly resolution and a temporally constant
10
map of bare soil area, which are taken from the Community Land Model (Bonan et al., 2002). They are used to provide estimates for the available area for growth and the light environment. A biome map which is taken from Olson et al. (2001) is used to repre-sent disturbance by assigning characteristic disturbance intervals to each biome (see Table B3). Furthermore, surface roughness is determined as a function of the biome.
15
The model provides output for each surviving strategy in a grid cell independently. Hence, to obtain an average output value for a certain grid cell the different strategies have to be weighted. Since ecological interactions between species are not consid-ered in the model, it is not possible to determine the relative abundance and thus the weight of each strategy. Therefore, the uncertainty due to the unknown weights of the
20
strategies has to be included into the results. As lower bound for net carbon uptake in a certain grid cell we assume that all strategies are equally abundant and the estimate thus corresponds to equal weights for all surviving strategies. This weighting method is called “average”. Since strategies that do not grow much are probably not as abundant as strongly growing strategies, the true net carbon uptake is probably underestimated
25
by this method. As an upper bound we assume a weight of one for the strategy with the highest growth and zero for all other strategies. This weighting method is called “max-imum” and it is probably an overestimate of the true value, since competition between
BGD
10, 3735–3846, 2013Estimating global carbon uptake by
lichens and bryophytes
P. Porada et al.
Title Page
Abstract Introduction
Conclusions References
Tables Figures
◭ ◮
◭ ◮
Back Close
Full Screen / Esc
Printer-friendly Version Interactive Discussion
Discussion
P
a
per
|
Dis
cussion
P
a
per
|
Discussion
P
a
per
|
Discussio
n
P
a
per
|
species would have to be very strong to reduce diversity to such an extent. The up-per and lower bounds derived from the two weighting methods are then used for the evaluation of the model.
The model is evaluated by comparing model estimates to observational data on a biome basis. Hence, data from several field study sites located in a certain biome are
5
compared to the simulated net carbon uptake averaged over all grid cells of this biome. Only studies which report estimates of net carbon uptake based on surface coverage of lichens or bryophytes are used for evaluating the model. This facilitates a direct comparison of model estimates and observations. The estimates from these studies show a large variability, even for the same site they differ by more than an order of
10
magnitude. Moreover, the number of studies is quite limited. Only 4 out of 14 biomes are represented in the field studies: Tundra, boreal forest, desert and tropical rainforest. For both forest biomes only one study site is available, respectively, making reliable estimates of net carbon uptake difficult. Nevertheless, we think that the data from the
field studies is suitable to give a rough idea of the mean net carbon uptake in a certain
15
biome.
The model is run for 2000 yr with an initial number of 3000 strategies. The simulation length of 2000 yr is sufficient to reach a dynamic steady state regarding the carbon
balance of every strategy, which also implies that the number of surviving strategies has reached a constant value. Furthermore, the initial strategy number of 3000 is high
20
enough to achieve a representative sampling of the ranges of possible parameter val-ues. This means running the model with 3000 different strategies leads to a very similar result. The model output is averaged over the last 100 yr of the simulation, since this period corresponds to the longest disturbance interval in the model.
3 Results
25
The model presented here is designed to predict global net carbon uptake by lichens and bryophytes. The predicted values are shown in form of maps as well as global
BGD
10, 3735–3846, 2013Estimating global carbon uptake by
lichens and bryophytes
P. Porada et al.
Title Page
Abstract Introduction
Conclusions References
Tables Figures
◭ ◮
◭ ◮
Back Close
Full Screen / Esc
Printer-friendly Version Interactive Discussion
Discussion
P
a
per
|
Dis
cussion
P
a
per
|
Discussion
P
a
per
|
Discussio
n
P
a
per
|
average numbers. Additionally, further properties of lichens and bryophytes estimated by the model are presented to illustrate the large range of possible predictions. To as-sess the quality of the predictions, the model estimates are compared to observational data. Since this study is the first process-based approach to quantify the productivity of lichens and bryophytes at the global scale, comparison of the results with other
mod-5
els is not possible. To estimate the effect of uncertain model parameter values on the predictions of the model, a sensitivity analysis is performed.
3.1 Modelled net carbon uptake
The global estimate of net carbon uptake by lichens and bryophytes amounts to 0.34 (Gt C) yr−1 for the “average” weighting method and 3.3 (Gt C) yr−1 for the
“maxi-10
mum” weighting method (for a description of the weighting methods see Sect. 2.3). The global biomass is 4.0 (Gt C) (average) and 46 (Gt C) (maximum), respectively. Note that we use a capital “C” to abbreviate carbon throughout the manuscript. To avoid confu-sion with unit symbols, we put C and the associated unit in brackets.
We show maps of the global net carbon uptake by lichens and bryophytes, biomass,
15
surface coverage, number of surviving strategies and two characteristic parameters, the optimum temperature of gross photosynthesis and the fraction of organisms with a Carbon Concentration Mechanism (CCM). These maps are created from time averages over the last 100 yr of the simulation described in Sect. 2.3. The maps are based on the “average” weighting method. The “maximum” weighting shows very similar patterns
20
and the corresponding maps are shown in Fig. A1a to d.
The net carbon uptake by lichens and bryophytes is shown in Fig. 5a. In some areas, such as Greenland and the driest parts of deserts, no strategy is able to survive and net carbon uptake is equal to zero there. The biomes differ largely with respect to carbon
uptake. While dry areas are characterised by the lowest productivity, the highest values
25
are reached in forested areas. In the tropical rainforest the high productivity is mainly due to the high carbon uptake by epiphytic lichens and bryophytes (see Fig. 5c). In the boreal zone, lichens and bryophytes in the canopy as well as on the ground contribute
BGD
10, 3735–3846, 2013Estimating global carbon uptake by
lichens and bryophytes
P. Porada et al.
Title Page
Abstract Introduction
Conclusions References
Tables Figures
◭ ◮
◭ ◮
Back Close
Full Screen / Esc
Printer-friendly Version Interactive Discussion
Discussion
P
a
per
|
Dis
cussion
P
a
per
|
Discussion
P
a
per
|
Discussio
n
P
a
per
|
significantly to carbon uptake (see Fig. 5d). Biomass (Fig. 5b) exhibits a global pattern similar to carbon uptake. At high latitudes, however, the ratio of biomass to carbon uptake seems to be slightly higher than in the tropics.
Figure 6a shows the global absolute cover of lichens and bryophytes in m2projected surface area of the organisms per m2ground. Since the available area can be higher
5
than one in the canopy, high values of absolute cover do not necessarily mean high fractional cover. On the contrary, the fractional cover is highest in regions with low ab-solute cover, especially grasslands and agricultural areas, since the available area in these regions is very small. A map of fractional cover is shown in Fig. A2. Figure 6b shows the number of surviving strategies at the end of the simulation. The global
pat-10
tern is slightly different from the pattern of carbon uptake. Although forested regions
show the highest number of strategies, the high latitudes are richer in strategies than the tropics.
Figure 6c and 6d shows the global patterns of two characteristic lichen and bryophyte parameters. As described in Sect. 2.2 these parameters are sampled randomly from
15
ranges of possible values to create many artificial strategies. Thus, at the start of a simulation possible values from the range of a certain parameter are present in equal measure in each grid cell. During the simulation, however, parameter values from cer-tain parts of the range might turn out to be disadvantageous in a cercer-tain climate and the corresponding strategies might die out. This leads to a narrowing of the range
20
and consequently to global patterns of characteristic parameters. These patterns re-flect the influence of climate on properties of surviving strategies. Figure 6c shows the optimum temperature of gross photosynthesis of lichens and bryophytes living on the ground. The optimum temperature shows a latitudinal pattern, with high values in the tropics and low values towards the poles or at high altitudes. In Fig. 6d the fraction of
25
organisms on the ground is shown which have a Carbon Concentration Mechanism (CCM). Also this parameter is characterised by a latitudinal pattern. The fraction of or-ganisms with a CCM is almost one in the tropics, while it is approximately 0.5 in polar regions. Lichens and bryophytes living in the canopy exhibit global patterns of optimum
BGD
10, 3735–3846, 2013Estimating global carbon uptake by
lichens and bryophytes
P. Porada et al.
Title Page
Abstract Introduction
Conclusions References
Tables Figures
◭ ◮
◭ ◮
Back Close
Full Screen / Esc
Printer-friendly Version Interactive Discussion
Discussion
P
a
per
|
Dis
cussion
P
a
per
|
Discussion
P
a
per
|
Discussio
n
P
a
per
|
temperature and CCM fraction similar to those living on the ground. The corresponding maps are shown in Fig. A2.
3.2 Evaluation
Figure 7 shows a comparison between model estimates and observational data with regard to net carbon uptake for 4 biomes. Considering the order of magnitude and
5
the large scale patterns of net carbon uptake, the model results agree well with the observations. There are, however, large uncertainties due to variability in the data, the difference between “average” and “maximum” estimate and the climatic differences
between the grid cells of a certain biome. Furthermore, there a too few data points to make any definitive statements. More detailed comparisons between modelled and
10
observed carbon uptake, however, are beyond the scope of this study (as discussed in Sect. 4). The field studies corresponding to the data points in Fig. 7 are listed in Table 1.
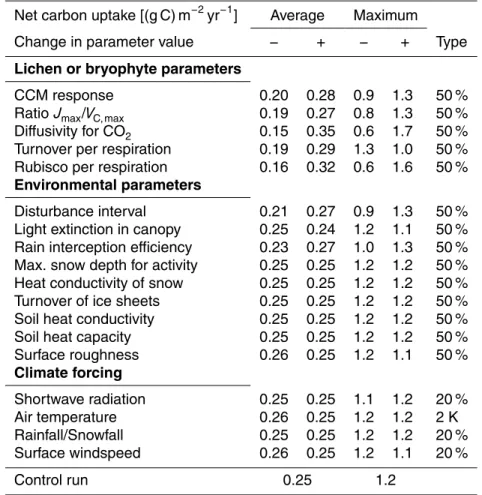
3.3 Sensitivity analysis
As described in Sect. 2.2 model parameters that describe tradeoffs, physiological
con-15
straints or environmental properties are assumed to have constant values. Some of these parameter values have already been estimated in other studies and thus they can be taken directly from the literature. Others, however, have yet to be determined. A reliable estimate of these unknown parameter values would require a considerable amount of experimental data, which is beyond the scope of this study. Therefore, the
20
parameter values were derived by “educated guess” using the available information from the literature (see Appendix B). To assess the impact of these parameter values on the model result we perform a sensitivity analysis (see Table 2). Note that some of the parameters tested in the sensitivity analysis are aggregated into a single process. For a detailed overview of the parameters see Tables B8 and B10.
25
BGD
10, 3735–3846, 2013Estimating global carbon uptake by
lichens and bryophytes
P. Porada et al.
Title Page
Abstract Introduction
Conclusions References
Tables Figures
◭ ◮
◭ ◮
Back Close
Full Screen / Esc
Printer-friendly Version Interactive Discussion
Discussion
P
a
per
|
Dis
cussion
P
a
per
|
Discussion
P
a
per
|
Discussio
n
P
a
per
|
In general, the model is not very sensitive to the parameter values which applies both for the “average” and “maximum” weighting methods. Regarding the environmental pa-rameters a change by 50 % leads to a 10 % or less change in the modelled net carbon uptake in most cases. Only disturbance interval and rain interception efficiency have a
slightly larger influence. The parameters that describe tradeoffs have a larger impact.
5
Changing the relation of water content to diffusivity for CO
2by 50 %, for instance, leads to a change in “average” net carbon uptake by almost 50 %. The effect of the
respira-tory costs associated with Rubisco content is similarly strong. The climate forcing has only a moderate influence on the simulated net carbon uptake. Note that the variation in climate forcing is only 20 % compared to 50 % for the parameters. This is done to
10
avoid generating unrealistic climatic regimes.
The turnover parameter affects “maximum” and “average” net carbon uptake in
op-posite ways. Moreover, the effects of the parameters Jmax/VC, max, light extinction and
surface roughness on carbon uptake are not straightforward to explain. These points are discussed in Sect. 4. For reasons of computation time we used a different
simula-15
tion setup (400 yr, 300 strategies) for the sensitivity analysis. Therefore, the net carbon uptake values for the control run (Table 2) differ from the ones presented above. The
pattern of productivity, however, is very similar to those of the longer run with more strategies (see Fig. A2). We thus assume that the sensitivity of the model does not change significantly with increased simulation time and number of initial strategies.
20
4 Discussion
In this study we estimate global net carbon uptake by lichens and bryophytes using a process-based model. In the following, we discuss the plausibility of the model esti-mates with respect to the patterns and the absolute values. Furthermore, we give an overview of the limits regarding the accuracy of the predictions as well as the certainty
25
of parameter values.
BGD
10, 3735–3846, 2013Estimating global carbon uptake by
lichens and bryophytes
P. Porada et al.
Title Page
Abstract Introduction
Conclusions References
Tables Figures
◭ ◮
◭ ◮
Back Close
Full Screen / Esc
Printer-friendly Version Interactive Discussion
Discussion
P
a
per
|
Dis
cussion
P
a
per
|
Discussion
P
a
per
|
Discussio
n
P
a
per
|
The model predicts plausible patterns of productivity and biomass (see Fig. 5) as well as cover, number of surviving strategies and characteristic parameters (see Fig. 6). The productivity of lichens and bryophytes in deserts seems to be generally limited by low water supply while forested areas are characterised by high values of productivity. The vertical pattern of productivity in tropical forests is different from the one in boreal
5
forests and it probably can be attributed to forest structure and temperature: The boreal forests have a relatively open canopy with large, sunlit areas in between that allow for lichen or bryophyte growth. Since this is not the case in the dense tropical lowland forests carbon uptake on the ground is lower than in the boreal zone. Furthermore, in the moist lowland forest, high temperatures at night together with high humidity near
10
the soil surface cause high respiratory losses for lichens and bryophytes and therefore constrain their growth (Nash III, 1996). This is also reflected in the ratio of biomass to carbon uptake, which is slightly lower in the tropics than at high latitudes. Tropical cloud forests, however, which also exist in the lowland (Gradstein, 2006), may facilitate high productivity of lichens and bryophytes near the ground. The spatial resolution of
15
the climate data and the biome map, however, is not high enough to represent these ecosystems. Hence, at a large spatial scale, the climate of the high latitudes seems to be more favourable for a large range of lichen and bryophyte growth strategies than the tropical climate, which is also illustrated by the higher number of strategies of the boreal forest zone compared to the tropical one. Nevertheless, the potential for productivity
20
seems to be highest in the moist tropics, although survival in this region is more difficult.
The surface coverage shows a plausible range of values. In deserts, it is in the order of 10 % or lower and in (sub)polar regions, it is around 30 %, which seems realistic. In forested regions, it ranges from 40 to 65 %, which is plausible since the available area is larger than 1 m2per m2ground for lichens and bryophytes living in the canopy.
25
The latitudinal pattern of the optimum temperature of gross photosynthesis is realis-tic, since the mean climate in the tropics is warmer than in polar regions or at high alti-tudes. The fact that the edges of the parameter range are not represented in the map can be explained as follows: extreme climatic conditions, which could be associated
BGD
10, 3735–3846, 2013Estimating global carbon uptake by
lichens and bryophytes
P. Porada et al.
Title Page
Abstract Introduction
Conclusions References
Tables Figures
◭ ◮
◭ ◮
Back Close
Full Screen / Esc
Printer-friendly Version Interactive Discussion
Discussion
P
a
per
|
Dis
cussion
P
a
per
|
Discussion
P
a
per
|
Discussio
n
P
a
per
|
with extreme values of the optimum temperature of gross photosynthesis, often do not persist for long time periods. Lichens and bryophytes are usually inactive during these periods and are therefore not affected by them. Extreme temperatures that last for longer periods of time are probably only present at the microclimatic scale and are therefore absent from the grid cell climate. Same as optimum temperature, also the
lat-5
itudinal pattern of the fraction of organisms with a CCM makes sense. A CCM is useful in situations where CO2is limited, either due to low supply from the atmosphere or due to high photorespiration. These conditions are met in the tropics. The moist climate in the rainforest generally leads to high water content of the thallus, which results in a low diffusivity for CO2. Additionally, the high temperatures in the tropics result in high
10
photorespiration, further reducing the available CO2 in the pore space. Although the global pattern is plausible, the fraction of lichens and bryophytes with a CCM seems to be generally too high. The reason for this could be that the metabolic costs of a CCM are underestimated in the model. As mentioned in Sect. 3.3, the parameters de-scribing the costs of the CCM are not very well known. Although the global patterns of
15
optimum temperature and CCM probably cannot be evaluated on a quantitative basis, these patterns help to assess qualitatively the plausibility of the model results.
The model results are in good agreement with observational data (see Fig. 7). There are, however, relatively large uncertainties associated with this comparison, mainly due to the large variability in the observational data. One reason for this variability in
20
productivity might be differences in microclimate at the study sites. These differences
can be considerable, although the sites belong to the same large-scale mean climate. Another reason for the variability in the observations might be the effect of
biodiver-sity on net carbon uptake. While one site might be dominated by a species that is very well adapted to the local climate and thus exhibits a high productivity, another
25
site might be populated by less productive species. This would lead to differing
esti-mates of net carbon uptake. The model results suggest that both mechanisms play a role (Fig. 7): due to physiological variation between the strategies, the estimates for the “average” and “maximum” weighting methods differ largely. Also, the difference in
BGD
10, 3735–3846, 2013Estimating global carbon uptake by
lichens and bryophytes
P. Porada et al.
Title Page
Abstract Introduction
Conclusions References
Tables Figures
◭ ◮
◭ ◮
Back Close
Full Screen / Esc
Printer-friendly Version Interactive Discussion
Discussion
P
a
per
|
Dis
cussion
P
a
per
|
Discussion
P
a
per
|
Discussio
n
P
a
per
|
productivity between the grid cells with the most and the least favourable climate of a certain biome is substantial.
Another source of uncertainty is the spatial resolution of the model. Even if the num-ber of field studies was high enough to reliably estimate a mean productivity for each biome, comparing the study sites to the model grid cells is not straightforward. Due
5
to the much larger spatial scale, the climate of a grid cell represents a mean state of the local climates that can be found in the cell. Hence, the climatic variability derived from the grid cells belonging to a certain biome might be smaller than the correspond-ing microclimatic variability in this biome. Dependcorrespond-ing on the degree of nonlinearity in the relation between climate and net carbon uptake, an estimate of mean net carbon
10
uptake based on the climate of grid cells might be biased compared to the mean of the observed values. Since the relation between climate and net carbon uptake is a complex function of many variables, quantifying its nonlinearity is difficult. Reducing
the spatial resolution of the model down to the microclimatic scale, however, is virtu-ally impossible. While the limited amount of observational data and the coarse spatial
15
resolution of the model are issues that cannot be resolved easily, a significant improve-ment in the accuracy of the model predictions could be achieved by quantifying the abundance of the strategies as described in Sect. 2.3. By implementing a scheme that simulates competition between lichen or bryophyte strategies, the large difference
be-tween the “average” and the “maximum” estimate (Fig. 7) could be reduced. Such a
20
scheme would be a promising perspective for extending the model.
Considering the sensitivity analysis, the general behaviour of the model is plausible. Increasing the Rubisco content per base respiration rate, for example, leads to an increase in net carbon uptake and vice versa (see Table 2). Some effects, however,
require further explanation:
25
1. The turnover parameter affects net carbon uptake based on “maximum” and
“av-erage” weighting in opposite ways. The “maximum” estimate is as expected: a higher turnover rate leads to lower biomass and therefore lower productivity. The “average” estimate could be explained by a statistical effect: a higher turnover
BGD
10, 3735–3846, 2013Estimating global carbon uptake by
lichens and bryophytes
P. Porada et al.
Title Page
Abstract Introduction
Conclusions References
Tables Figures
◭ ◮
◭ ◮
Back Close
Full Screen / Esc
Printer-friendly Version Interactive Discussion
Discussion
P
a
per
|
Dis
cussion
P
a
per
|
Discussion
P
a
per
|
Discussio
n
P
a
per
|
rate causes the death of many less productive strategies, thereby increasing the average value of productivity compared to lower turnover rates.
2. The ratio Jmax/VC, max is positively correlated with productivity, which is not self-evident. The correlation is due to the fact that in the model,Jmaxis derived from a givenVC, maxvia the ratio of the two. Hence, changing this ratio only affectsJ
max.
5
3. The light extinction parameter is negatively correlated with total productivity of lichens and bryophytes. Since the parameter partitions the light input between canopy and soil surface, the ground receives less light if the canopy absorbs more and vice versa. Hence, the impact of this parameter on productivity can be explained by assuming that the decrease in carbon uptake on the ground
over-10
compensates the increase in the canopy.
4. Surface roughness and wind speed are both negatively correlated with the aero-dynamic resistance to heat transfer. They consequently have a positive effect on
potential evaporation. Therefore the lichens and bryophytes are more frequently desiccated and their productivity decreases.
15
The overall outcome of the sensitivity analysis of the model is satisfactory. Param-eters that describe environmental conditions do not have a large impact on simulated net carbon uptake. This means that it is not absolutely necessary to specify ranges for the environmental parameters in order to obtain a good estimate of the uncertainty of the model results. The model is, however, quite sensitive to parameters that describe
20
tradeoffs. Since these parameters are assumed to have constant values (Sect. 2.2),
they should be determined as accurately as possible. Unfortunately, the data available in the literature currently only allow “educated guesses”. Determining accurate values for these parameters, however, is not per se difficult. Only one study, for instance, has
measured both Rubisco content and base respiration rate simultaneously, but in many
25
studies one of them has been determined. Considering the diffusivity of the thallus for
BGD
10, 3735–3846, 2013Estimating global carbon uptake by
lichens and bryophytes
P. Porada et al.
Title Page
Abstract Introduction
Conclusions References
Tables Figures
◭ ◮
◭ ◮
Back Close
Full Screen / Esc
Printer-friendly Version Interactive Discussion
Discussion
P
a
per
|
Dis
cussion
P
a
per
|
Discussion
P
a
per
|
Discussio
n
P
a
per
|
content, but we found only one study that quantified the diffusivity for CO2as a function
of water content. The latter, however, is much more useful for modelling CO2diffusion
through the thallus on a process basis. Hence, accumulating more empirical data that is suitable to determine the values of the parameters that describe tradeoffs with higher
accuracy would be a very efficient way to improve the model. One example of a such
5
a study is the work of Wullschleger (1993) which analyses the ratio betweenJmaxand VC, max. For a large number of vascular plants this ratio is approximately 2. The rea-son for this constant ratio is the fact, that a highJmax is not useful if theVC, max is low and vice versa, since productivity is the minimum of the two rates. As both rates are associated with metabolic costs, a tradeoffemerges.
10
To summarise, the model is able to produce realistic global patterns of net carbon uptake by lichens and bryophytes. The uncertainty concerning the absolute value of carbon uptake is relatively high, but the observational data available to evaluate the model also show large variability. Given that this study is supposed to be a first order estimate of global lichen and bryophyte productivity, the outcomes are satisfying.
Re-15
garding possible improvements of the model it would be useful to implement competi-tion between the strategies. In this way, the uncertainty due to the unknown abundance of the strategies could be eliminated. Furthermore, it would be beneficial if values of model parameters that describe tradeoffs could be determined more accurately.
5 Conclusions and outlook
20
In this paper, we present the first process-based model of global net carbon uptake by lichens and bryophytes. The model explicitly simulates processes such as photosyn-thesis and respiration to quantify exchange flows of carbon between organisms and environment. The predicted global net carbon uptake of 0.34 to 3.3 (Gt C) yr−1 has a realistic order of magnitude compared to empirical studies (Elbert et al., 2012). The
25
values of productivity correspond to approximately 1 to 6 % of the global terrestrial Net Primary Productivity (NPP) (Ito, 2011). Furthermore, the model represents the large
BGD
10, 3735–3846, 2013Estimating global carbon uptake by
lichens and bryophytes
P. Porada et al.
Title Page
Abstract Introduction
Conclusions References
Tables Figures
◭ ◮
◭ ◮
Back Close
Full Screen / Esc
Printer-friendly Version Interactive Discussion
Discussion
P
a
per
|
Dis
cussion
P
a
per
|
Discussion
P
a
per
|
Discussio
n
P
a
per
|
functional variation of lichens and bryophytes by simulating many different
physiologi-cal strategies. The performance of these strategies under different climatic regimes is
used to narrow the range of possible values of productivity. This method is an efficient way to incorporate the effects of biodiversity on productivity into a vegetation model
(Pavlick et al., 2012). The predicted global patterns of surviving strategies are
plausi-5
ble from a qualitative perspective. To further reduce the number of possible values for productivity, competition between the different strategies could be implemented. This
would also make the representation of functional variation of lichens and bryophytes in the model more realistic.
The uptake of carbon is only one of many global biogeochemical processes where
10
lichens and bryophytes are involved. They probably also play an important role in the global nitrogen cycle due to the ability of some lichens to fix nitrogen (around 50 % of terrestrial uptake) (Elbert et al., 2012). The fixation of nitrogen, however, is relatively expensive from a metabolic viewpoint. It would be interesting to quantify the costs of this process at the global scale and its relation to nutrient limitation.
15
While nitrogen can be acquired from the atmosphere, phosphorus usually has to be released from rocks by weathering. Thus, lichens and bryophytes might increase their access to phosphorus or other important nutrients by enhancing weathering rates at the surface through exudation of organic acids and complexing agents. Since weathering rates control atmospheric CO2 concentration on geological time scales, lichens and
20
bryophytes might have influenced global climate considerably throughout the history of the earth (Lenton et al., 2012).
Lichens and bryophytes have to invest carbon in order to fuel nitrogen fixating en-zymes or produce organic acids necessary for weathering. Hence, these investments could be implemented as a cost function into the model, making it possible to quantify
25
the associated processes at the global scale. Quantifying the carbon budget of lichens and bryophytes can thus be seen as a first step towards estimating the impact of these organisms on other biogeochemical cycles.
BGD
10, 3735–3846, 2013Estimating global carbon uptake by
lichens and bryophytes
P. Porada et al.
Title Page
Abstract Introduction
Conclusions References
Tables Figures
◭ ◮
◭ ◮
Back Close
Full Screen / Esc
Printer-friendly Version Interactive Discussion
Discussion
P
a
per
|
Dis
cussion
P
a
per
|
Discussion
P
a
per
|
Discussio
n
P
a
per
|
Appendix A
See Figs. A1–A2.
Appendix B
Model details
In the following sections, the technical details of the model are explained. Section B1
5
describes how strategies are generated from parameter ranges. Moreover, references are provided for these parameter ranges. Sections B2 to B7 contain all model equa-tions that are associated with physiological processes of lichens and bryophytes. Fur-thermore, references are given for the theoretical background and the parameterisation of the equations. The equations are ordered according to the structure of Sect. 2. The
10
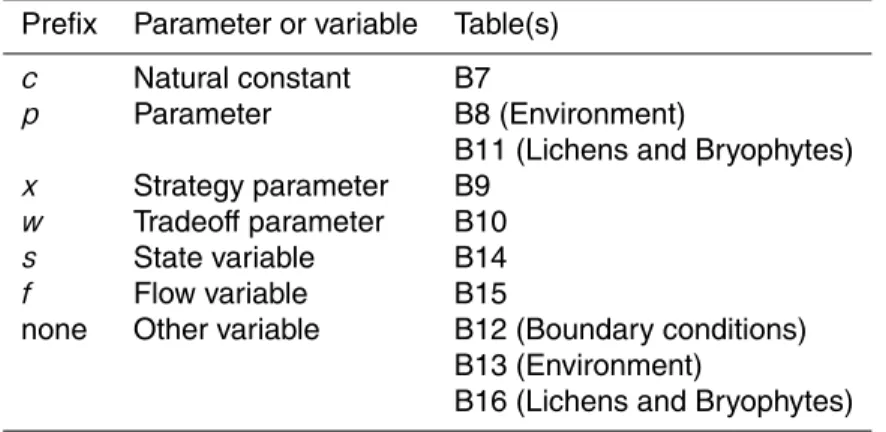
values and the units of the parameters and variables used in the model equations are tabulated in Sects. “Model parameters” and “Model variables” (see Tables B6 to B15). The tables contain references to the respective equations. To make the equations more easily readable, characteristic prefixes are added to the model parameters and the as-sociated tables are structured accordingly. The prefixes, the type of parameter and the
15
associated table(s) can be found in Table B1.
For further details on the implementation of parameters and equations in the model we refer to the source code of the model which is available on request ([email protected]).
B1 Generation of strategies
20
To account for the large functional variability of lichens and bryophytes, many strategies are generated in the model which differ from each other in 15 characteristic
parame-ters (see Sect. 2.2). To create the strategies, these 15 characteristic parameparame-ters are assigned through randomly sampling ranges of possible values. The parameters and
![Table B4. References for the disturbance intervals τ veg [yr] of di ff erent biomes regarding fire and treefall](https://thumb-eu.123doks.com/thumbv2/123dok_br/17292084.248086/77.918.49.698.176.560/table-references-disturbance-intervals-erent-biomes-regarding-treefall.webp)