A
COUSTIC EMISSION ANALYZER
J. J. Almeida-Pérez1, R. Chaparro-Sánchez1, A. Rojas-Molina1 & R. Ríos-Cabrera2.
1
Universidad Autónoma de Querétaro, Facultad de Informática. Cerro de las Campanas s/n, Centro Universitario
[email protected], [rchapa,arojas]@sunserver.uaq.mx
2
CIATEQ A. C. Advanced Technology Center, Manantiales 23a, Fracc. Ind. B. Q. El Marqués, Querétaro. C. P. 76246. México [email protected]
Received: January 16th, 2003. Accepted February 27th, 2003
ABSTRACT
In this paper appears a solution for acoustic emission analysis commonly known as noise. For the accomplishment of this work a personal computer is used, besides sensors (microphones) and boards designed and built for signal conditioning. These components are part of a virtual instrument used for monitoring the acoustical emission. The main goal of this work is to develop a virtual instrument that supplies many important data as the result of an analysis allowing to have information in an easy and friendly way. Moreover this information is very useful for studying and resolving several situations in planning, production and testing areas.
The main characteristics of the virtual instrument are: signal analysis in time, effective power measurement in Decibels (dB), average intensity taken from the principle of paired microphones, as well as the data analysis in frequency. These characteristics are included to handle two information channels.
RESUMEN
En este trabajo se presenta una solución al análisis de emisiones acústicas más comúnmente denominadas como ruido, para la realización de este trabajo se hace uso de una computadora personal a la cual se adicionan el diseño y construcción de sensores (micrófonos) y tarjetas para el acondicionamiento de señales. Todos estos componentes se conjugan en la creación de un instrumento virtual, mediante el cual se realiza el monitoreo de las emisiones acústicas. Como resultado principal en el instrumento se proveen varios datos de importancia en el análisis lo que permite tener la información de manera fácil y amigable para el usuario, además de que sea útil para el estudio y toma de decisiones en las áreas de planeación, producción y pruebas.
Las principales características con que cuenta el instrumento son: análisis de la señal en el tiempo, medición de la potencia eficaz en Decibeles (dB), intensidad media a partir del principio de micrófonos apareados, así como el análisis en frecuencia de los datos, todas estas características se incluyen para el manejo de dos canales de información.
KEYWORDS: Acoustical Analysis, Spectrum, Acoustic level.
1. INTRODUCTION
262 Vol. 2 No. 3 December 2004
look for noise problem solution in their production processes as well as to assure the substantial reduction of noice that their products could generate for the final user.
The main reasons why the analysis of noise is not carried out in the industry are: lack of knowledge about the damage that noise can cause, ignorance about how the instruments must be used, where and why to apply the acoustical analysis and finally the high cost of the instruments.
The conventional equipments offered by companies that study and analyze noise are designed for specific processes; in consequence they don´t have certain characteristics that the client may need, and at the same time they exceed of the unusefull characteristics and as a result the clients have to buy something that is not very useful for their processes.
The noise analysis and noise measurement are realized in several ways, they could be done by knowing the level of acoustic pressure or by making spectral analysis when the problem needs a deeper analysis. Nowadays other types of analysis have been introduced like the acoustic intensity measurement, where the measurement process includes a double measurement of effective sound pressure and a signal analysis.
For those reasons it was necessary to develop a system that could perform measurements and analysis of acoustic emission with the advantages that it will be a virtual instrument based on a personal computer, with the simple addition of new components.
2. DEVELOPMENT
The accomplishment of the acoustic emission analyzer is divided in three steps: The hardware development, the creation of the virtual instrument and the acoustic instrumentation (processing of the information) development. In the following sections these steps are analyzed in detail.
2.1 Hardware
The Hardware is composed by three sections: the microphone, the signal conditioning and the data acquisition board. Figure 1 shows the necessary stages in the hardware.
Figure 1. Hardware
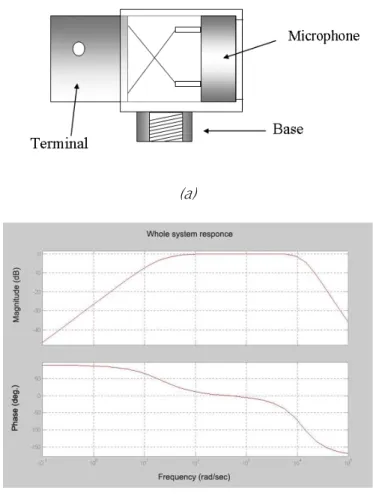
The microphones are the transducers that transform the signals of effective sound pressure into electrical signals, for their construction conventional microphones of 0.25" were used. Figure 2 shows the response in frequency of the
(a)
(b)
Figure 2. Microphone (a) Design, (b) Frequency response
The signal conditioning system allows to handle the levels of signals delivered by the transducer, which are levels
relatively low, in the order of 10-3 volts and establishes a voltage filtering and amplification process in order to be used
by the data acquisition board, that handles voltages between -3 and 3 volts. Figure 3 shows the design of the circuit PCB (Printed Circuit Board).
264 Vol. 2 No. 3 December 2004
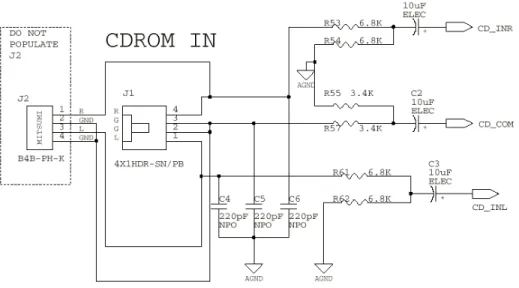
With the Data Acquisition Board (DAQ), the analog voltage delivered by the signal conditioner, is converted to digital signals in discrete time [4]. The DAQ board is an audio card using the compact disk input, due to the fact that the characteristics of construction change from one trademark to another it is necessary to eliminate the input filter of the audio card that is used as part of the analyzer. The conditioning board uses an ISA slot, which allows using the own power source of the computer.
The necessary modifications in the sound card are shown in Figure 4, basically the change consists of eliminating the filter in the CDROM input.
Figure 4. Filter in the audio card
2.2 Software
The Software performs the acquisition, processing, displaying and storage of the signal given by the hardware and is divided in corresponding four parts, presented in Figure 5.
Figure 5. Flow chart of software
speed, sample size and sample quality (that is the number of bits by sample being an essential part for later stages). Figure 6 shows the program configuration section for the hardware.
Figure 6. Configuration
2.3 Acoustic Instrumentation.
The signal analysis computes the acoustic pressure level (APL). The microphones sensibility and the response of the hardware are given by
rms rms
P
V
S
=
, (1)
where
Vrms: Effective voltage that delivers the microphone,
Prms : Effective Pressure.
In most cases the microphone sensibility value is information given by the manufacturer, but this information can be evaluated during the calibration of the equipment.
The acoustic pressure measurement makes possible the calculation of acoustic pressure level, this measurement is given in decibels (dB) and it could be compared with a background level in which case equation (4) is used. It is very important to note that it is possible to measure it in real time but it is more common to find the effective value
measurement so it is necessary to know the effective pressure value Pef first
P
ef∫
T
dt
t
p
T
0 2)
(
1
=
,
(2)where p(t): Pressure
Pef: Effective Pressure.
Acoustic Pressure Level (APL) could calculated by
ref ef
P
P
APL
=
20
log
10, (3)
where references pressure
P
ref=20x10
−6P
a , (4)266 Vol. 2 No. 3 December 2004
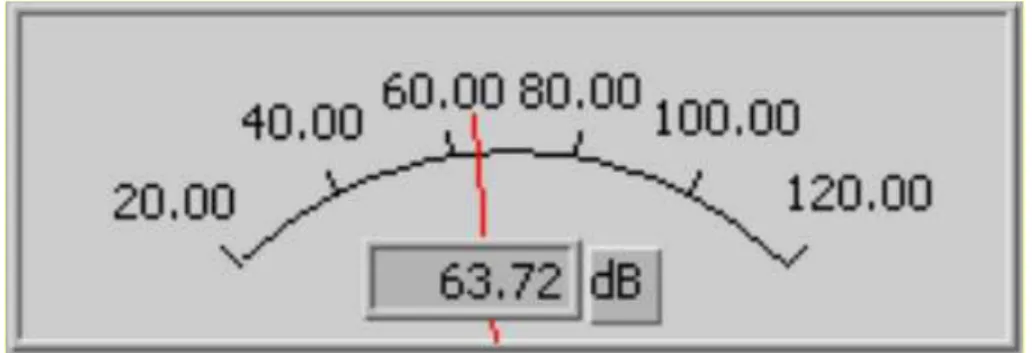
Figure 7. Level of acoustic pressure
The signal processing performs the corresponding calculations to show the analysis and measurements in frequency. Using the acoustic pressure signals and Fast Fourier Transform (FFT) [1,2], the analysis in frequency is done for the acoustic emission. The presentation of these results can be shown in (dB) level or directly in the linear value obtained in the spectrum.
In order to obtain the spectrum, a sample size must be defined by the user. The sample size can be from 0.125 seconds to a minute. The obtained results appear in figure 8.
Figure 8. Frequency Spectrum of signal test
The processing results are showed in the PC’s monitor as indicators and graphs, for better understanding, the results are given in logarithmic scale according to the signal shown.
Finally, the storage option allows the user to save a time interval of the sampled signal for later analysis; in this case the storage signal is saved in WAV format.
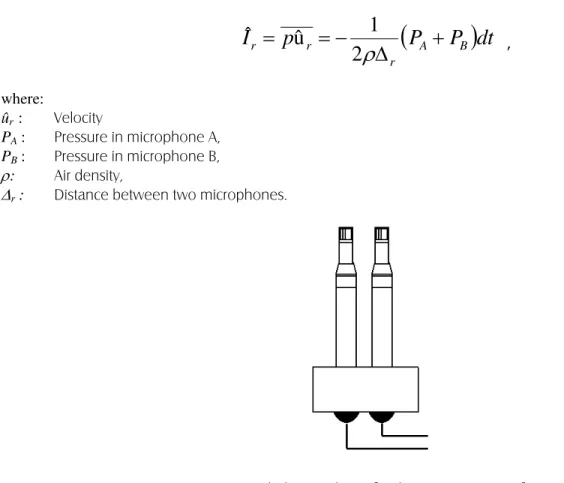
The acoustic intensity measurement is made with the method of paired microphones. In this case the intensity is calculated from equation (5). Figure 9 shows the location of the coupled microphones to achieve the measurement of
(
P
P
)
dt
p
I
A Br r
r
=
=
−
ρ
∆
+
2
1
û
ˆ
, (5)
where:
ûr : Velocity
PA: Pressure in microphone A,
PB: Pressure in microphone B,
ρ: Air density,
∆r : Distance between two microphones.
Figure 9. Coupled microphone for the measurement of intensity
3. RESULTS AND FUTURE WORK
The purpose of this article is to allow a deeper analysis of acoustic emission characteristics of a source. The first stage has been considered to obtain a punctual measurement of intensity.
By doing the intensity measurement, it is possible to establish the total intensity of acoustic emission of a source. In future work it the number of paired microphones could be increased in order to integrate the acoustic measurement value, as well as the direction of the signals and an emission spectrum to the sources analysis could be improved.
The design of a virtual instrument has among other characteristic the facility of managing, but also it is very important the validation of the final results which are expected to be achieved by calibrating the instrument in order to be sold.
4. REFERENCES
[1] Oppenheim A. V., Willsky A. S., Nawab S. H., Señales y sistemas, Ed. Pearson Educación, 1997.
[2] Hsu H. P., Análisis de Fourier, Ed. Prentice Hall, 1998
[3] Diei E. N., Dornfeld D. A., Acoustic Emission Sensing of Tool Wear in Milling, Journal of Engineering for
Industry, vol 109, august 1987.
268 Vol. 2 No. 3 December 2004
Authors Biography
José Jorge Almeida Pérez
Received the B.Sc. degree in Instrumentation and Process Control Engineering from Universidad Autónoma de
Queretaro (Autonomous University of Querétaro, UAQ). Currently he is teaching at the Facultad de Ciencias de la Computación (Faculty of Computer Science of UAQ). His areas of interest are: Virtual Instrumentation, Networks, Digital systems.
Ricardo Chaparro Sánchez.
Received the B.Sc. degree in electronics engineer from Instituto Tecnológico de Queretaro (Technological Institute of
Querétaro, ITQ). M.Sc. in Terminal Line in Instrumentation and Automatic Control from Universidad Autónoma de
Queretaro (Autonomous University of Querétaro, UAQ). Currently he is teaching at the Facultad de Ciencias de la Computación (Faculty of Computer Science of the UAQ). His areas of interest are: Digital Signal Processing, Digital Systems, Instrumentation.
Adriana Rojas Molina.
Received the M.Sc. in Terminal Line in Instrumentation and Automatic Control from Universidad Autónoma de
Queretaro (Autonomous University of Querétaro, UAQ), received the B.Sc. in Computer Systems Engineering from
Instituto Tecnológico de Queretaro (Technological Institute of Querétaro, ITQ). Currently she is teaching at the
Facultad de Ciencias de la Computación (Faculty of Computer Science of the UAQ). Her areas of interest are: Computers Architecture, Parallel Computers, Computer Vision.
Reyes Rios Cabrera
Received the B.Sc. degree in Computer Engineering from Universidad Autónoma de Queretaro (Autonomous