www.the-cryosphere.net/10/2637/2016/ doi:10.5194/tc-10-2637-2016
© Author(s) 2016. CC Attribution 3.0 License.
Temporal evolution of crack propagation propensity in snow
in relation to slab and weak layer properties
Jürg Schweizer, Benjamin Reuter, Alec van Herwijnen, Bettina Richter, and Johan Gaume WSL Institute for Snow and Avalanche Research SLF, Flüelastrasse 11, 7260 Davos Dorf, Switzerland
Correspondence to:Jürg Schweizer ([email protected])
Received: 6 April 2016 – Published in The Cryosphere Discuss.: 18 April 2016
Revised: 1 October 2016 – Accepted: 10 October 2016 – Published: 11 November 2016
Abstract. If a weak snow layer below a cohesive slab is present in the snow cover, unstable snow conditions can pre-vail for days or even weeks. We monitored the temporal evo-lution of a weak layer of faceted crystals as well as the over-laying slab layers at the location of an automatic weather sta-tion in the Steintälli field site above Davos (Eastern Swiss Alps). We focussed on the crack propagation propensity and performed propagation saw tests (PSTs) on 7 sampling days during a 2-month period from early January to early March 2015. Based on video images taken during the tests we determined the mechanical properties of the slab and the weak layer and compared them to the results derived from concurrently performed measurements of penetration resis-tance using the snow micro-penetrometer (SMP). The crit-ical cut length, observed in PSTs, increased overall during the measurement period. The increase was not steady and the lowest values of critical cut length were observed around the middle of the measurement period. The relevant mechanical properties, the slab effective elastic modulus and the weak layer specific fracture, overall increased as well. However, the changes with time differed, suggesting that the critical cut length cannot be assessed by simply monitoring a sin-gle mechanical property such as slab load, slab modulus or weak layer specific fracture energy. Instead, crack propaga-tion propensity is the result of a complex interplay between the mechanical properties of the slab and the weak layer. We then compared our field observations to newly developed metrics of snow instability related to either failure initiation or crack propagation propensity. The metrics were either de-rived from the SMP signal or calculated from simulated snow stratigraphy (SNOWPACK). They partially reproduced the observed temporal evolution of critical cut length and insta-bility test scores. Whereas our unique dataset of quantitative
measures of snow instability provides new insights into the complex slab-weak layer interaction, it also showed some de-ficiencies of the modelled metrics of instability – calling for an improved representation of the mechanical properties.
1 Introduction
conceptual model on the effect of the slab properties, in par-ticular slab depth, on these failure processes. With increas-ing slab depth, conditions for failure initiation become less favourable whereas conditions for crack propagation become more favourable.
Temporal changes in snow instability hence stem from changes in slab and weak layer properties – separately or in combination. For example, during a snowfall the probability of failure initiation in the weak layer increases due to the ad-ditional load. However, the adad-ditional load will also promote strengthening of the weak layer (e.g. Zeidler and Jamieson, 2006a) – though the strength increase may lag behind load-ing durload-ing a snowfall. Changes of weak layer strength have been studied in detail (e.g. Chalmers and Jamieson, 2001; Gauthier et al., 2010; Jamieson and Johnston, 1999; Zeidler and Jamieson, 2006a, b) and more frequently than changes of slab properties. However, to the best of our knowledge, there are hardly any studies that investigated how temporal changes affect the complex interplay between slab and weak layer properties.
Repeated measurements of weak layer shear strength re-vealed how various types of weak layers gain strength over time (Jamieson et al., 2007). Overall, an increase in strength was almost always observed in all studies while at the same time the load usually increased. Jamieson and Schweizer (2000) reported the shear strength over time for 19 buried surface hoar layers. Typical weak layer strength gain was on the order of 100 Pa day−1 during the initial weeks after burial (Schweizer et al., 1998). Occasionally measured decreasing strength with time was attributed to spatial variability within the study site or errors associated with measurement technique (Jamieson and Johnston, 1999). Many of the above-mentioned studies monitoring strength changes of weak layers focussed on relating stability trends with observed local or regional avalanche activity (e.g. Jamieson et al., 2007). However, observed avalanche activ-ity was often not related to the stabilactiv-ity index, i.e. the ra-tio of strength to stress (e.g. Föhn, 1987), calculated from the study plot measurements. While the shear strength of the weak layer is important for failure initiation, dry-snow slab avalanches release due to crack propagation, which re-quires the release of deformation energy stored in the slab layers. This conceptual mismatch has long been recognized. For example, Schweizer et al. (1998) pointed out that since the shear frame measurements will primarily provide infor-mation on the strength and strength changes of weak layers, the “effective reactivity (propagation potential)” depending on the slab characteristics should be assessed by supplemen-tary tests. Nevertheless, temporal changes of slab character-istics were rarely monitored, apart from the load.
The temporal evolution of shear strength has been mod-elled for persistent and non-persistent weak layers (e.g. Chalmers, 2001; Conway and Wilbour, 1999; Hayes et al., 2005; Lehning et al., 2004; Zeidler and Jamieson, 2006a, b) so that the evolution of the stability index can be
moni-tored or even forecasted (Giraud, 1993; Vernay et al., 2015). Conway and Wilbour (1999) suggested a model for natu-ral avalanches during storms by comparing the load to the strength by assuming that failure occurs at the base of the new snow layers; their strength solely depends on density which increases with increasing overburden stress. Föhn and Hächler (1978) exclusively focused on slab properties as they studied how the slab layers settle during major snow storms. They proposed to follow the settlement (coefficient) over time to assess the probability of large natural dry-snow avalanches.
With the development of the propagation saw test (PST; Gauthier and Jamieson, 2006), a well-established snow in-stability test now exists providing a quantitative test result, the critical cut length. Furthermore, the PST allows deter-mining the relevant slab and weak layer properties (Reuter et al., 2015; Schweizer et al., 2011; Sigrist and Schweizer, 2007; van Herwijnen and Heierli, 2010; van Herwijnen et al., 2016). Recently, Birkeland et al. (2014) repeatedly per-formed propagation saw tests on a layer of buried surface hoar; they focussed on conditions for fracture arrest.
A number of studies have focussed on the temporal evolu-tion of spatial patterns on small uniform slopes by inter alia testing the hypothesis that variability should increase in the absence of major external forcing such as a snowfall (Birke-land and Landry, 2002; Birke(Birke-land et al., 2004; Logan et al., 2007). Hendrikx et al. (2009) used the extended column test (Simenhois and Birkeland, 2009) to investigate spatial varia-tions of the propagation potential. They assessed the spatial variability of two sites each on 2 days and found increased spatial clustering on the second sampling day.
For clarification, we shortly define the meaning of the fol-lowing two terms: snow instability and crack propagation propensity. As Reuter et al. (2015) have pointed out, both high failure initiation and high crack propagation propensity are required to describe unstable snowpack conditions. More recently, Reuter et al. (2016b) suggested complementing the failure initiation and crack propagation criteria with a tensile criterion related to dynamic crack propagation. Hence, snow instability cannot be assessed with a single stability criterion as suggested in the past (e.g. Föhn, 1987) but only by a com-bination of indices related to the essential processes in dry-snow slab avalanche release. With regard to crack propaga-tion propensity, we refer to this term to describe, (1) in gen-eral, whether snowpack characteristics favour self-sustained crack propagation possibly resulting in a snow slab avalanche and, (2) when interpreting propagation saw tests, whether the critical crack length is less than about one-third of the column length and the crack propagates to the end of the column.
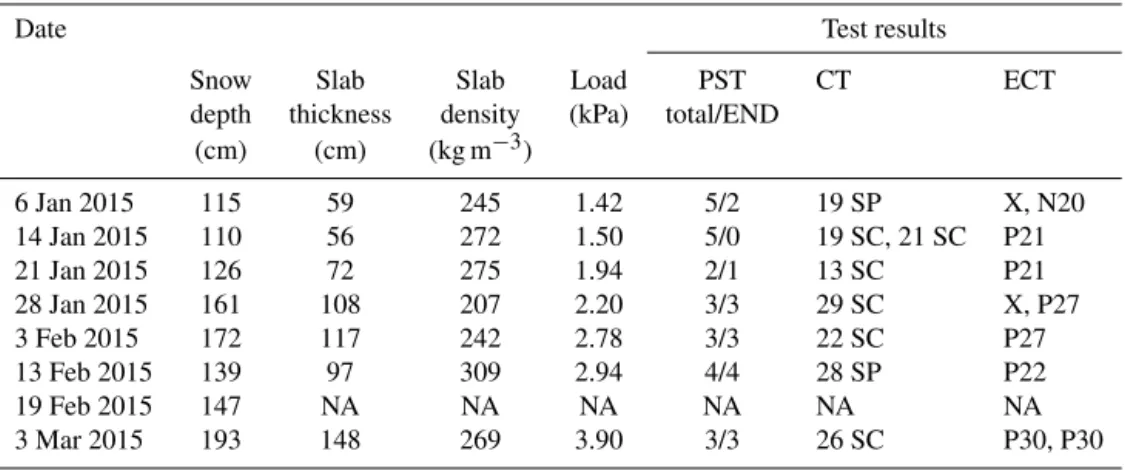
Table 1.Snowpack characteristics and snow instability test results on the 8 measurements days. For the PST the total number of tests and the number of tests with crack propagation to the end of the column, for the CT the score and the fracture type (SP: sudden planar, SC: sudden collapse) and for the ECT the fracture type (X: no fracture, N: initiation, but no propagation, P: propagation to column end) and the score are given (Greene et al., 2010). NA means not available.
Date Test results
Snow Slab Slab Load PST CT ECT depth thickness density (kPa) total/END
(cm) (cm) (kg m−3)
6 Jan 2015 115 59 245 1.42 5/2 19 SP X, N20 14 Jan 2015 110 56 272 1.50 5/0 19 SC, 21 SC P21 21 Jan 2015 126 72 275 1.94 2/1 13 SC P21 28 Jan 2015 161 108 207 2.20 3/3 29 SC X, P27 3 Feb 2015 172 117 242 2.78 3/3 22 SC P27 13 Feb 2015 139 97 309 2.94 4/4 28 SP P22 19 Feb 2015 147 NA NA NA NA NA NA 3 Mar 2015 193 148 269 3.90 3/3 26 SC P30, P30
(Eastern Swiss Alps) over the course of 2 months. We per-formed propagation saw tests, which we analysed based on the video recordings of the tests and compared the results to concurrently performed measurements of penetration resis-tance using the snow micro-penetrometer (SMP) (Schneebeli and Johnson, 1998). As we performed our measurements in a level study plot equipped with an automatic weather sta-tion (AWS), we also simulated the evolusta-tion of snow stratig-raphy with the numerical snow cover model SNOWPACK. Finally, we compared our observations to metrics of insta-bility derived from either the SMP signals or simulated with SNOWPACK. The acquired dataset provides a comprehen-sive time series of quantitative measures of snow instability; it allows insight into the complex interplay between slab and weak layer properties that jointly govern snow instability.
2 Methods
We followed the evolution of a weak layer of faceted crys-tals in the level study plot surrounding the AWS WAN7 (2442 m a.s.l.) located in the Steintälli field site above Davos, Eastern Swiss Alps (46.808◦N, 9.788◦E). Measure-ments were performed on 8 days between 6 January and 3 March 2015, typically once a week during the 2-month study period (Table 1).
2.1 Weak layer formation
On 1 December 2014 the manually observed snow profile at the study plot Weissfluhjoch (2540 m a.s.l.) (located 3 km to the northeast of WAN7) showed a melt–freeze crust with 1 cm recently fallen snow on top. On 2–3 December 2014, a minor storm accumulated an additional 12 cm of new snow. During the following 2 weeks, the snow above the crust set-tled and transformed into a layer of faceted crystals due to
near-surface faceting (Birkeland, 1998); this layer of faceted crystals was buried by a snowfall on 16 December 2014. The 2–3 cm thick melt–freeze crust was consistently found throughout the winter below the layer of faceted crystals that formed the 5-8 cm thick weak layer. As of mid-January 2015 the layer was classified as rounded facets (FCxr) with a grain size of 1–1.5 mm. Above the weak layer was another layer of faceted crystals overlain by well-consolidated slab lay-ers that had formed in late December 2014 and early Jan-uary 2015 (Fig. 1). The weak layer was likely responsible for widespread avalanche activity in the region of Davos on 30–31 December 2014 when many natural dry-snow slab avalanches were observed. Since no snow profiles at fracture lines were recorded, we do not know the depth and type of failure layer. However, the weak layer we monitored consis-tently failed in snow instability tests in early January 2015, and there were no other prominent weak layers within the snow cover. This observation suggests that it was also the primary failure layer of the late December avalanches. 2.2 Field measurements
On each of the 8 sampling days we observed a manual snow profile, including layer density, according to Fierz et al. (2009); all profiles can be found in the supplementary ma-terial. The detailed density profile is required for the analysis by particle tracking velocimetry (PTV) of the PSTs (see be-low). The manual snow profile served as reference for most other measurements and was completed with the two snow instability tests that can easily be performed in flat terrain: the compression test (CT) (Jamieson, 1999) and the extended column test (ECT) (Simenhois and Birkeland, 2009).
Figure 1. (a)SNOWPACK simulation for the location of the automatic weather station (AWS) WAN7 for winter 2014–2015 showing the evolution of grain shape, black vertical line indicates date of snow profile (28 January 2015),(b)simulated snow profile for 28 January 2015,
(c)manually observed snow profile at the location of the AWS on 28 January 2015 and(d)corresponding SMP penetration force signal measured at the location of the manual profile. Red arrows point to the weak layer.
columns. Initially, column length was around 1.5 m, and it in-creased towards 2 m at the end of the study period as the weak layer became more deeply buried (slab thickness increased from 59 to 148 cm) (Bair et al., 2014; Gaume et al., 2015). Using a 2 mm thick snow saw, we cut the layer of faceted crystals at its upper interface, where CT and ECT results in-dicated that the failure occurred. Black markers (2.5 cm in diameter) were inserted into the snowpack; we filmed all tests with a video camera for subsequent analysis by parti-cle tracking velocimetry (van Herwijnen et al., 2010). The video recording also allowed us to accurately determine the critical value of the crack lengthrcOBS, when the crack started to propagate. Furthermore, we could also assess whether the tests were properly performed, e.g. whether the saw cut was within the weak layer. In some cases, we had to discard a test result since the cut was not performed consistently close to the layer interface; this resulted in only two values of the critical cut length on 21 January and 3 February 2015.
In the PST experiments, cracks did not always propagate to the end of the column but did arrest with a slab fracture (Table 1). These propagation results are termed END and SF, respectively (e.g. Greene et al., 2010). In the following, while reporting the critical cut length when crack propagation ini-tiates, we do not differentiate between these two propagation results since the critical crack length is independent of the subsequent phase of dynamic crack propagation. Whether or not a running crack will arrest may depend on the tensile strength of the slab (Gaume et al., 2015; Schweizer et al., 2014). However, the onset of crack propagation entirely de-pends on the balance between the energy available for frac-ture, i.e. the mechanical energy released due to an incremen-tal advance of the crack, and the specific fracture energy, i.e. the energy required for crack growth, or in other words the resistance to crack propagation.
Concurrently, we performed several SMP measurements (SMP version 2), at least three at the location of the
man-ual snow profile (see Supplement) and at least one at each of the PST locations – thus in total at least six measurements per sampling day. The SMP measurements at the PST lo-cations were conducted before isolating the columns, close to the end of the column where the saw cut was initiated. This procedure allowed comparing the SMP-derived proper-ties with those from the PTV analysis.
2.3 PTV analysis
Using a PTV algorithm (Crocker and Grier, 1996) the dis-placement field of the slab prior to crack propagation was calculated from the video image; it shows bending of the slab due to the saw cut (of lengthr) during the PST. Based on the displacement field of the slab, the effective elastic mod-ulus of the slabE*PTV and the specific fracture energy of the weak layerwPTVf were determined (van Herwijnen and Heierli, 2010; van Herwijnen et al., 2016). The approach is based on the work by Heierli et al. (2008), who suggested for the geometry of the PST (of unit width) an expression for the total energy of the systemV (r)as a function of crack lengthr which consists of the fracture energyVf(r)and the mechanical energyVm(r):
V (r)=Vf(r)+Vm(r)=wfr+Vm(r). (1) The mechanical energy includes two terms, a fracture me-chanical and a bending term:
Vm(r)= − π γ r2
4E′
τ2+σ2
− r
3
6E′D h
λτ ττ2+λτ στ σ+λσ σσ2 i
, (2)
(assumed ν=0.2). The load of the slab on the weak layer consists of the shear stressτ= −ρgDsinθ and the normal stressσ= −ρgDcosθ, whereρis the slab density andθis the slope angle. Furthermore,
λτ τ=1+ 9 4η
r
D
−1 +9
4η 2r
D
−2
, (3)
λτ σ = 9 2η+
9 2η
2r D
−1
, (4)
λσ σ=3η2+ 9 4η
r
D+
9 5
r
D
2
, (5)
withη=√4(1+ν)/5.
However, by comparing estimates obtained with the an-alytical expression for the mechanical energy provided by Heierli et al. (2008) with finite element (FE) simulations, van Herwijnen et al. (2016) recently showed that Eq. (2) underes-timates the mechanical energy for realistic values of the ratio of crack length to slab thicknessr/D. Therefore, they intro-duced a correction factor that accounts for the sensitivity to
r/Dand the slope angleθto obtain an adjusted mechanical energyV∗
m(r)
According to the theorem of Clapeyron, for a linear-elastic system, the mechanical energy can be estimated from the gravitational potential energy. The gravitational potential en-ergy was computed from the measured displacement field, assuming a layered slab and using the manually observed density profile, to determine the mechanical energy as a func-tion of crack length. This measured mechanical energy was then fitted to the adjusted mechanical energy V∗
m(r) to ob-tain the effective elastic modulus of the slab E*PTV, the fit parameter. It is defined as the modulus of a uniform slab of equal mean density yielding the same displacement as the real slab. To determine the specific fracture energy wPTVf , the analytical expression for the adjusted mechanical energy with the best fit modulus is differentiated with regard to the crack length at the critical cut lengthrcOBS. In other words, the slope of V∗
m(r) at the critical crack length corresponds to the specific fracture energy of the weak layer. For a more detailed description on deriving the effective elastic modulus and the specific fracture energy, the reader is referred to van Herwijnen et al. (2016).
2.4 SMP signal processing
We used the penetration resistance data acquired with the SMP to obtain detailed data on the layering of the snow cover to derive mechanical properties following the approach de-scribed in Reuter et al. (2015).
Based on the manually observed snow profile, layers were manually defined from the corresponding sections of the SMP signal, i.e. several slab layers, a weak layer and a basal layer. The shot-noise model by Löwe and van Her-wijnen (2012) was then applied to determine snow micro-structural parameters, namely the rupture force f, the de-flection at ruptureδand the structural element sizeL. These
three parameters were calculated over a moving window of 2.5 mm with 50 % overlap and averaged over each layer. Fur-thermore, for each layer the snow density was derived ac-cording to Proksch et al. (2015), allowing us to calculate the load on the weak layer. The micro-mechanical modulus for the slab layers and the strength of the weak layerσWLwere calculated according to Johnson and Schneebeli (1999). The weak layer specific fracture energywfSMPwas calculated as the minimum of the integrated penetration resistance across each moving window within the weak layer (Reuter et al., 2013). Finally, the penetration depth was estimated by inte-grating the penetration resistanceF from the snow surface to the depth of penetration where a threshold value of the absorbed energy was reached (Schweizer and Reuter, 2015). The effective elastic modulus of the slabE*SMP was de-termined by performing FE simulations of the experimen-tal setup taking into account the slab layering (for details see Reuter et al., 2015). The FE model consisted of all the slab layers, the weak layer and a basal layer, each with den-sity, micro-mechanical modulus and thickness values derived from the SMP measurement. The mechanical strain energy
VmFEM(r) was then calculated for a stratified slab bending over a crack of increasing lengthr. In order to recover an effective elastic modulus E*SMP, the analytical expression for the adjusted mechanical energyV∗
m(r) was fitted to the modelled values of mechanical energyVmFEM(r). Hence, we followed the same approach as for the PTV analysis, and we also used the newly developed correction factor to obtain the adjusted mechanical energyV∗
m(r).
The SMP-derived weak layer specific fracture energy and the effective elastic modulus were scaled by a linear fac-tor of 2.8 and 2.5, respectively, to approximately match the corresponding values derived from the PTV analysis. Scal-ing of the specific fracture energy and the modulus was per-formed as there is no calibration yet of the microstructural mechanical properties that can be derived from the SMP sig-nal. Whereas the microstructural properties derived from the SMP are physically based, they cannot be expected to di-rectly represent the corresponding macroscopic properties (Reuter et al., 2016a).
In addition, an alternative effective elastic modulusEρ*SMP
was derived, following the same approach with the same FE model as described above. However, rather than using the micro-mechanical modulus, for each layer the modulus was determined using the SMP-derived density and applying the parameterization provided by Scapozza (2004, p. 186):
E=1.873×10⁵e0.0149ρ.
The first metric is the failure initiation criterion S, a strength-over-stress criterion describing the propensity of the weak layer to fail in case of skier loading:
S= σWL 1τFEM
, (6)
where σWL is the SMP-derived micro-mechanical strength of the weak layer and1τFEMthe maximum additional shear stress at the depth of the weak layer due to skier loading. The maximum shear stress at the depth of the weak layer was modelled with the 2-D linear-elastic FE model originally presented by Habermann et al. (2008) to calculate the shear stress 1τFEM below a layered slab due to the weight of a skier.
The second metric is the crack propagation criterionrcSMP, an SMP-derived critical cut length. It is derived by numer-ically solving Eq. (7), which is obtained by finding the ex-tremum of the total energy of the cracked system V (r)
(Eq. 1) with respect torand ensuring that it is a maximum: d
drV (r)=wf+ d
drVm(r)=0, which yields (Schweizer et al., 2011)
wf E′, rc
= D
2E′
w0+w1 rc D+w2
rc
D
2
+w3 rc
D
3
+w4 rc
D
4
, (7)
with
w0= 3η2
4 τ 2
w1=
π γ+3η
2
τ2+3η2τ σ+π γ σ2
w2=τ2+ 9η
2 τ σ+3η 2σ2
w3=3ησ2, w4=3σ2.
By inserting the effective elastic modulus of the slabEρ*SMP
and the weak layer specific fracture energywfSMPinto Eq. (7) the crack propagation criterion rcSMP was obtained. Hence this modelled critical cut length is independent of the critical cut length rcOBS measured in the field. For a more detailed description on how to obtain the above-mentioned mechan-ical properties as well as the SMP-derived metrics of point instability, the reader is referred to Reuter et al. (2015). 2.5 Snow cover modelling
We compared results from field measurements to output of the numerical snow cover model SNOWPACK (e.g. Lehn-ing et al., 2004) driven by meteorological input from the AWS WAN7. This weather station is located in the study plot where we performed the field measurements. Meteoro-logical input contained air temperature and relative humid-ity (Rotronic MP100H HygroClip, ventilated), wind speed
and direction (YOUNG wind monitor), incoming short- and long-wave radiation (Campbell CNR1) and snow height (Campbell SR50). Data gaps shorter than 1 day were filled by linear interpolation. Gaps longer than 1 day were filled with data from the nearby AWS Weissfluhjoch (2540 m a.s.l.; 3 km to the northeast). Variables were filtered by introduc-ing reasonable lower and upper limits, e.g. 5 and 100 % for relative humidity. The modelling time step was 15 min after resampling the data from the AWS with a sampling rate of 10 min. The model was initiated on 1 October 2014, when no snow was present at the AWS and ran until the end of May. Neumann boundary conditions for estimating the snow sur-face temperature and atmospheric stability corrections for es-timating turbulent exchange were the preferred adjustments concerning the energy balance model (Stössel et al., 2010).
From the model output, we evaluated the skier stability index SK38 introduced by Jamieson and Johnston (1998). It is defined as the ratio of shear strength to shear stress: SK38=τ+τs1τ withτ the shear stress due to the weight of the overlaying slab,1τ=155/hthe additional shear stress due to a skier withhthe slab depth (Föhn, 1987; Monti et al., 2016) andτsthe shear strength as parameterized with density and grain type according to Jamieson and Johnston (2001).
In addition, we estimated the critical cut lengthrcSNPfrom the snow stratigraphy provided by SNOWPACK. We used SNOWPACK model output to derive all the required me-chanical properties of the snow layers. The critical cut length was then estimated based on the relation given by Gaume et al. (2014a, Eq. 5) (see Gaume et al., 2016, for a de-tailed derivation). Based on discrete element modelling they suggested the critical cut length, in the flat (for slope an-gleθ=0◦), to essentially depend on the plain strain elastic modulus of the slabE′, slab loadσ and weak layer shear strengthτs:
rcSNP=3
r 2τs
σ , (8)
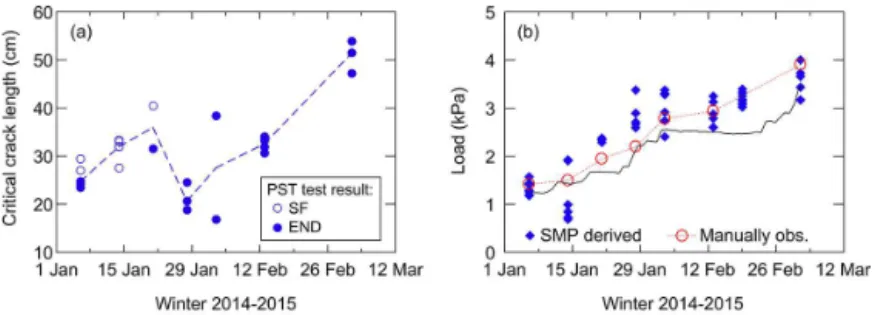
Figure 2. (a)Critical cut length as observed in propagation saw tests (number of cases:N=24). Full circles indicate crack propagation to the very end of the column (END), while open circles indicate partial propagation resulting in a fracture across the slab (SF); the dashed line connects the median values per day.(b)Load on the weak layer: red open circles (connected by dotted line) show the load as calculated from the manually observed density and layer thickness; blue diamonds are corresponding SMP-derived values (N=48). The black solid line indicates the load as provided by SNOWPACK.
2.6 Avalanche activity
Study plot measurements are commonly used in operational forecasting to make assessments about the avalanche danger in the surrounding terrain (e.g. Gauthier et al., 2010). We therefore compared the results obtained from the field mea-surements to the observed avalanche activity in the region of Davos. These observations include the number, type and size of avalanches recorded by personnel from the local ski ar-eas, the avalanche warning service, SLF staff members and others. We then calculated the avalanche activity index per day as described by Schweizer et al. (2003b). The index is a weighted sum of the number of observed avalanches per day including natural as well as artificially triggered avalanches; the weights depend on the avalanche size and are 0.01, 0.1, 1 and 10 for Canadian size classes 1 to 4, respectively (Mc-Clung and Schaerer, 2006).
2.7 Case studies
To explore the complex interaction between slab and weak layer properties on the critical cut length in a PST, we consid-ered a few cases with exemplary temporal evolutions of slab load, slab elastic modulus and weak layer specific fracture energy. To this end we numerically solved Eq. (7) to obtain the corresponding critical crack length and hence its evolu-tion over time. These examples are not meant as a sensitivity study where one parameter is varied and the other held con-stant but rather as an illustration of the interaction when most or all parameters change.
3 Results
3.1 Propagation saw test results
On 6 January 2015, when we did the first propagation saw tests, cracks did not always fully propagate to the end of the column, but slab fractures were observed in three tests (Ta-ble 1, Fig. 2a). Eight days later, on 14 January 2015, when the
PSTs were performed on a slightly more shallow part of the study plot surrounding the AWS WAN7, all five tests resulted in slab fractures. As of 28 January 2015, 22 days after the first measurements, all cracks fully propagated to the end of the column. After 56 days, on 3 March 2015, in all three tests cracks still fully propagated while the critical crack length had increased to about 50 cm. By then, the weak layer of faceted crystals was buried below a slab of about 150 cm in thickness with an average density of about 270 kg m−3, re-sulting in a load of almost 4 kPa.
During our measurement series, the critical cut length
rcOBSwas initially about 23–30 cm, and slightly increased up to 21 January 2015. Consistently shorter cut lengths were observed on the following measurement day, on 28 Jan-uary 2015, the date when all cracks fully propagated for the first time. On the following sampling day, 3 February 2015, one test again yielded a short cut length, 17 cm, the shortest value recorded during our sampling period. Subsequently, the cut lengths increased with time.
3.2 Load
On 6 January 2015, the weak layer was buried below a slab of 59 cm (total snow depth HS=115 cm) and the initial load was about 1.4 kPa (Table 1, Fig. 2b). The load did not change much during the following week but then continuously in-creased due to snowfalls to almost 3 kPa by early Febru-ary 2015. After a fair weather period in FebruFebru-ary with no new snow for more than 2 weeks, the snow depth increased again, and on the last sampling day (3 March 2015) the load was about 3.9 kPa.
Figure 3. Effective elastic modulus of the slab derived from(a)the bending of the slab via PTV analysis with vertical lines denoting measurement uncertainty (N=23) and(b)the SMP signal analysis (N=48), either directlyE*SMP (solid blue triangles) or via density Eρ*SMP(red crosses). Dashed lines connect the median values per day.
depth was about 25 cm lower than measured at the location of the manual snow profiles.
3.3 Effective elastic modulus of the slab
The effective elastic modulus of the slab was derived from the bending of the slab during the propagation saw test via the PTV analysisE*PTV(Fig. 3a) as well as from the SMP signal analysis using the FE model with either the micro-mechanical modulus or a modulus derived from SMP den-sity, yieldingE*SMPandEρ*SMP, respectively (Fig. 3b). The effective elastic modulus of the slab obtained from the PTV analysis showed an overall increase from about 2.5 to 10 MPa during the 2-month sampling period. However, the increase was not steady; for example, on 13 February 2015 relatively low values between 2.4 and 6.1 MPa were obtained.
The SMP-derived effective elastic modulus E*SMP ini-tially did not change much with median values of approxi-mately 3 MPa during the first 16 days. It then increased until the end of January to about 5 MPa. However, subsequently, it decreased and on the last measuring day low values of only about 1.8 MPa were derived.
The alternative SMP-derived modulus Eρ*SMP also in-creased from initially 8 MPa to about 22 MPa in early Febru-ary. Thereafter Eρ*SMP did not change much anymore with values between 19 and 26 MPa (median values per day). 3.4 Weak layer specific fracture energy
The PTV analysis suggests that the weak layer specific fracture energy wPTVf overall increased with time from about 0.6 to about 2.2 J m−2, mostly after the end of Jan-uary 2015 (Fig. 4a). The SMP analysis revealed a similar ten-dency of increasing weak layer specific fracture energy with time. Overall, wSMPf increased from about 0.5 to 1.4 J m−2 and most of the increase occurred towards mid-February (Fig. 4b).
3.5 SMP-derived metrics of instability
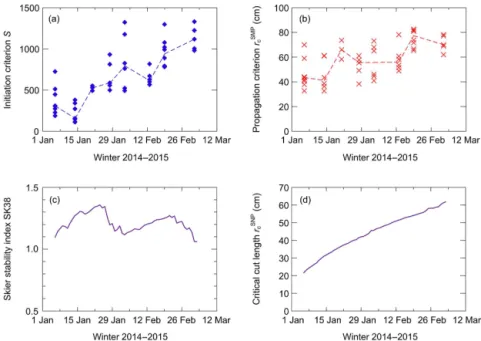
The failure initiation criterionSderived from SMP resistance data was initially about 300, indicating a transitional value for failure initiation propensity given the threshold reported by Reuter et al. (2015). They observed that a value of the initiation criterion of about 230 divided between the cases with and without concurrently observed signs of instability. The index then increased to about 600 towards the end of January and further to about 1100 by the end of the sampling period (Fig. 5a).
The SMP-derived critical cut length rcSMP overall in-creased from about 40 to 70 cm (Fig. 5b). Again the increase was not steady with a similar tendency with time as shown for the weak layer specific fracture energywSMPf . At the 3 sampling days between end of January and mid-February similar values ofrcSMPwere derived, namely about 55 cm. 3.6 SNOWPACK-derived metrics of instability
The skier stability index SK38 (Fig. 5c) for the investigated weak layer showed values between 1.1 and 1.35 in early Jan-uary 2015; these values are in the range of transitional sta-bility (1 to 1.5) according to Jamieson and Johnston (1998). With the snowfalls at the end of January and early Febru-ary (Fig. 1) the index then decreased towards 1.0, indicating increased triggering probability. Subsequently, during much of February, when there was no snowfall, the skier stability index SK38 gradually increased towards 1.3 and decreased again to overall the lowest values of about 1 towards the end of the observation period.
The modelled critical cut lengthrcSNP (Fig. 5d), in con-trast, steadily increased from about 20 cm in early January to 60 cm in early March 2015.
3.7 Avalanche activity
Figure 4.Weak layer specific fracture energy derived from(a)the bending of the slab via PTV analysis (N=22) with vertical lines denoting measurement uncertainty and(b)the SMP signal analysis (N=48). Dashed lines connect the median values per day.
Figure 5.Instability criteria:(a)SMP-derived failure initiation criterionSand(b)SMP-derived crack propagation criterionrcSMP; dashed lines connect median values per day (N=48). Output of the numerical snow cover model SNOWPACK:(c)skier stability index SK38 and
(d)modelled critical cut lengthrcSNP.
18 January, a sunny Sunday after a snowfall. Towards late January and early February, there was a period of increased avalanche activity. The last peak was on 3 March 2015, again after a major snowfall, but during this period avalanches no longer ran on the weak layer of facets we monitored; the ob-served fracture depths were much lower than the burial depth of the weak layer we investigated. Overall, avalanche activ-ity clearly decreased since early January 2015. However, af-ter each significant snowfall avalanches were again observed (e.g. on 18, 28 and 31 January; Fig. 6); i.e. the weak layer of facets was still reactive, a true persistent weak layer.
The overall decrease in avalanche activity until the end of February is in line with the observed results of the CTs and ECTs we performed concurrently on each sampling day. The scores increased from values just below 20 taps to val-ues of around 30 taps (red asterisks in Fig. 6). On the first measuring day, no crack propagation was observed with the extended column test (Table 1). Subsequently, the fracture
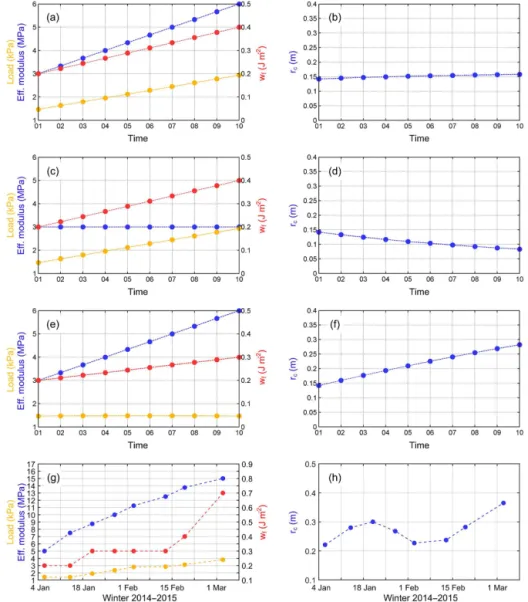
Figure 7.Case studies on how the critical cut lengthrcvaries as a function of the load and the effective modulus of the slab and the specific fracture energy of the weak layerwf. Arbitrary units of time for the three simplified scenarios shown in(a)–(f). In the last scenario(g, h), the situation during the sampling period is supposed to be roughly mimicked.
type in ECTs was always P (propagation across the entire column), except on 28 January when one ECT did not frac-ture (X). The increased avalanche activity towards the end of January and early February coincides with the lowest values of observed critical cut length.
3.8 Case studies
The observed temporal evolution of the critical cut length in our PSTs showed an unsteady increase with the lowest val-ues in the middle of the measuring period and an increase thereafter. To explore whether this type of pattern is possi-ble at all, we numerically solved Eq. (7) to find out how the critical cut length changes with time for various scenarios of the temporal evolution of the specific fracture energy of the weak layerwf, the loadσand the modulus of the slabE.
the increasing load, more energy was available to drive the crack, which outweighed the additional energy required to advance the crack due to the weak layer toughening.
In the third simplified scenario, the load remained con-stant, while the slab modulus and the weak layer specific fracture energy increased (Fig. 7e); this scenario corresponds to a fair weather period when the slab stiffens due to settle-ment and the weak layer toughens due to ongoing sintering with time. In this scenario, the critical cut length substan-tially increased (Fig. 7f). Due to the higher slab modulus less energy was released to drive crack propagation while at the same time the weak layer became tougher.
Finally, in our last scenario, we attempted to roughly mimic the temporal evolution of the critical cut length as observed in our PSTs. We assumed the load to increase ap-proximately as observed, the modulus to triple and the spe-cific fracture energy of the weak layer to increase as well, but not continuously (Fig. 7g). With these assumptions, the critical cut length first increased, had a local minimum ap-proximately in the middle of the considered time period and finally increased again (Fig. 7h).
4 Discussion
We repeatedly performed propagation saw tests in a level study plot to follow the temporal evolution of a weak layer of faceted crystals and of the overlaying slab layers by com-bining state-of-the-art measurement techniques and numer-ical snow cover simulations. Specifnumer-ically, we used particle tracking velocimetry, the snow micro-penetrometer and the snow cover model SNOWPACK to estimate snow mechani-cal properties and derive snow instability criteria.
4.1 Observed critical cut length
While performing the propagation saw tests in the study plot, we initially observed a mixture of END and SF test results; mixed test results are typically not found in critical condi-tions. Only when the load had reached 2 kPa did all cracks fully propagate towards the end of the column. This obser-vation suggests that the tensile strength of the slab was ini-tially not large enough to allow crack propagation (Gaume et al., 2015), in particular at the more shallow locations. Other changes in slab properties that might have favoured slab frac-tures, e.g. faceting, were not observed.
The initial absence of full crack propagation in our field tests contrasted with the high avalanche activity observed during that time. The contrasting observations may be due to the fact that we made our measurements in a wind-sheltered study plot that may not be very representative of wind-affected starting zones in the area. In typical lee-slope start-ing zones, the tensile strength of the slab might have been larger; moreover, the tensile stress might be lower on slopes since less bending is expected prior to natural avalanche
re-lease than observed in PSTs in flat terrain (McClung and Borstad, 2012). In general, slab layers are more variable in terms of penetration resistance than weak layers reflecting the dynamic conditions of snowfall and wind during deposi-tion of the slab (Schweizer et al., 2008). Since the properties of the slab layers are particularly important for crack prop-agation, variable crack propagation propensity has to be ex-pected. The observed discrepancy highlights some of the lim-itations when extrapolating instability from flat field study sites.
As of 28 January 2015 all cracks in PSTs propagated to the very end of the column. This is in line with the results of the other stability tests performed: sudden fractures (SP/SC) in CTs and full crack propagation (P) in ECTs.
Overall the observed critical cut length doubled from about 25 to about 50 cm by early March. However, the in-crease was not steady. Despite the overall inin-crease in criti-cal cut length, the lowest values were observed at the end of January and in early February. This pattern of the temporal evolution of the critical cut length in PSTs was rather unex-pected since weak layers typically gain strength with time (e.g. Jamieson and Schweizer, 2000).
Consistently low values of the critical cut length in PSTs, between 19 and 24 cm, were observed on 28 January 2015. On the following sampling day, the lowest value (17 cm) was observed, but also a rather high value of 38 cm. In general, low values or scores in snow instability tests are more trust-worthy than high values. In the case of the propagation saw test, any measurement and observation errors increase the cut length. In our case, we were cutting at the top of a weak layer of faceted crystals, and the layer above was not much harder and also consisted of faceted crystals. Hence, it was relatively easy to move the saw out of the weak layer. We were able to identify such deviations on the video recordings, but only on the side facing the camera. The high values may therefore be due to imperfect sawing and show the difficulty in obtaining consistent PST results in weak layers which are not very well defined.
The median range, i.e. the difference between the high-est and the lowhigh-est value, of the PST results on a given sam-pling day was 5.9 cm, so that the resulting uncertainty in the mean is about 2–3 cm. Reuter and Schweizer (2012) reported a standard deviation of the critical cut length on days with surface warming of about 5 cm. Similar variations for PST results on a single day at a single location have been reported by Gauthier and Jamieson (2008).
of-ten spatially not particularly variable has, for instance, been shown by Pielmeier and Schneebeli (2001). Previous snow instability studies performed in level study plots suggested that measurements in general are reliable and that the effect of spatial variations is relatively small. Jamieson (1995) re-ported a mean coefficient of variation of shear strength of about 15 % for sets of measurements in study plots. Corre-spondingly, variations in stability indices derived from study plot measurements of load and shear strength, two measure-ments that have comparable errors as the PST, were found to be indicative of avalanche activity (e.g. Jamieson et al., 2007). Though the PST results may be influenced by some small-scale spatial variability of the snowpack in the study plot, we deem it unlikely that the observed minimum values are entirely the result of spatial variability but in fact indicate a period of high propagation propensity. This interpretation is supported by the increased avalanche activity observed in late January and early February when many skier-triggered avalanches were observed (Fig. 6).
4.2 Load, modulus and specific fracture energy
The temporal evolution of the parameters influencing the critical cut length, namely the load, the effective elastic slab modulus and the weak layer specific fracture energy, all ex-hibited similar, mostly increasing trends. The load obviously increased (Fig. 2b) and the results derived from the manual density measurements and the SMP profiles agreed well – in accordance with recent comparison studies (Proksch et al., 2015, 2016).
The PTV-derived effective elastic modulus also increased, but the increase was not steady with some low values on 13 February 2015 (Fig. 3a). These low values were also ob-served with the SMP (Fig. 3b). The SMP-derived effective elastic modulus E*SMP, however, showed very low values on the very last sampling days – resulting in an overall de-crease. When estimating the effective elastic modulus from the SMP-derived density, the agreement in temporal evolu-tion was better. Indeed, overall Eρ*SMP also increased. The observation that the SMP-derived modulus occasionally de-creases compared to the previous measurement day, for ex-ample, on 3 February and 3 March 2015 can be explained by the fact that on each of these days a snowfall period ended. With the addition of new snow on the top of the existing slab, the effective elastic modulus, considering the FE model, in general decreases, unless the old slab layers below substan-tially settle so that the penetration resistance increases. In other words, the additional load due to the new snow leads to a thicker slab of lower average density – resulting in a lower effective elastic modulus.
In general, the weak layer specific fracture energy is ex-pected to increase with time as sintering will increase bond-ing between crystals – unless the weak layer is subject to a large temperature gradient (e.g. van Herwijnen and Miller, 2013). Indeed, the PTV-derived weak layer specific fracture
energywfPTVand the microstructural-related specific fracture energy derived from the SMP signalwfSMPexhibited a sim-ilar overall increasing trend (Fig. 4). However, independent of the evaluation method, the increase occurred mostly af-ter early February. This observation suggests that the weak layer toughening mainly occurred during the fair weather pe-riod without additional loading in February. A constant weak layer specific fracture energy in combination with additional loading by snowfall in January would have resulted in a de-creasing critical cut length, in line with field observations.
With respect to the absolute values of the specific frac-ture energy, these should be considered as effective values since it is clear that they are too high compared to the specific fracture energy of ice (McClung, 2015). For the PTV-derived values, the discrepancy is most likely related to the fact that the observed bending in a PST includes non-elastic parts of deformation, thereby increasing the specific fracture energy to physically unrealistic values; for an in-depth discussion of this issue see van Herwijnen et al. (2016).
Compared to the weak layer specific fracture energy, the PTV- and SMP-derived absolute values of the effective elas-tic modulus agreed less well. In parelas-ticular, it is known that
E*SMP does not relate well to the PTV-derived modulus (Reuter et al., 2013) – even though we scaled the SMP-derived values with the corresponding PTV-SMP-derived modulus (see below). However, van Herwijnen et al. (2016) recently showed that the PTV-derived modulus fits relatively well with results from laboratory experiments in the same range of strain rates. The SMP-derived modulusE*SMP includes the complex interaction between the cone and surrounding snow microstructure and does obviously not reflect simple elastic deformation, but breaking, jamming and other local effects occur (LeBaron et al., 2014; van Herwijnen, 2013). Obvi-ously, the SMP-derived modulusEρ*SMP, which relies on the relatively robust density derivation, agreed somewhat better with the PTV-derived modulus.
In general, when comparing the absolute values of the effective elastic modulus and the weak layer specific frac-ture energy, we recall that the SMP-derived values ofE*SMP
andwfSMPwere scaled to the corresponding PTV values to ease comparison. The scaling was performed using a larger dataset (unpublished) of side-by-side PST and SMP mea-surements. It is beyond the scope of this study to provide a quantitative comparison of the two methods; it will be the subject of a publication currently in preparation (Reuter et al., 2016a). To conclude the discussion on the PTV and SMP-derived values, below we present an error assessment – as far as this is possible.
un-certainty in the input parameters (unun-certainty in the distance measurements in the field, density measurements and espe-cially the location estimates of the dots in the PTV analysis). Van Herwijnen et al. (2016) showed that the reproducibil-ity of side-by-side measurements for the slab modulus was good (even though the values of the modulus have greater uncertainty), whereas the reproducibility for the weak layer specific fracture energy was lower. The better reproducibility for the modulus might be related to the fact that the modulus is an integrated property over all slab layers and hence may be less sensitive to spatial variations of one layer.
The errors of the SMP-derived parameters are more dif-ficult to assess. However, Proksch et al. (2015) showed that the SMP-derived density is a reliable measure. Their find-ing is supported by our measurements showfind-ing good re-producibility between SMP-derived and manually measured load (Fig. 2b). However, in particular the derivation of the effective elastic modulus is more prone to errors. In gen-eral, the variability of SMP-derived microstructural parame-ters is rather high. Thus, any value which is indirectly derived from these microstructural parameters will exhibit large vari-ations; in particular estimates of the deflection at rupture δ
are rather variable (Löwe and van Herwijnen, 2012). 4.3 Metrics of instability
The SMP-derived metrics of point snow instability, the fail-ure initiation criterion S and the crack propagation crite-rionrcSMP, were recently developed and validated (Reuter et al., 2015). Here, we applied them for the first time to moni-tor the temporal evolution of instability. The failure initiation criterionS increased with time, suggesting that initiating a failure in the weak layer became increasingly difficult during the sampling period. This tendency is supported by the re-sults of the two small column snow instability tests (Table 1, Fig. 6). CT/ECT scores increased from around 20 to 30 taps. The absolute values of S were rather high, in the range that was considered as rather stable by Reuter et al. (2015). Again, this is in agreement with the rather high scores of the CTs and ECTs and is related to the fact that by the end of January 2015 the weak layer was buried below a thick slab of more than 1 m. Weak layers buried deeper than 1 m are not frequently triggered by skiers (e.g. Schweizer and Jamieson, 2007).
The crack propagation criterion rcSMP overall increased in agreement with the observations (Fig. 2a). It showed a similar evolution with time as the SMP-derived weak layer specific fracture energy, which is used to calculatercSMP. A relative decrease towards the end of January was also ob-served but was less prominent than for rcOBS. Despite sub-stantial scatter, until early February about half of the values were between 35 and 45 cm. The crack propagation criterion
rcSMPincreased to about 70 cm only after mid-February. Con-sidering the threshold values indicating unstable conditions
S <234 andrcSMP<41 cm suggested by Reuter et al. (2015),
the two criteria predict unstable conditions in early January. In fact, signs of instability were observed by the field team on 6 and 28 January 2015; on the latter day the lowest val-ues of critical cut length were observed in PSTs. However, on that day the failure initiation criterion was already high (S≈590), since the slab thickness was>1 m.
Based on the simulated snow stratigraphy provided by SNOWPACK, we presented two corresponding metrics of instability. Overall, snow stratigraphy was well simulated, as exemplified by the comparison shown in Fig. 1. Despite large differences in vertical resolution, the simulated SNOWPACK profile, the manually observed profile and the SMP profile qualitatively agreed well.
The SNOWPACK-derived skier stability index SK38 var-ied between about 1.0 and 1.35 and did not show any trend with time. This is in contrast to the increasing scores obtained with CTs and ECTs. Whereas the skier stability index SK38 initially increased in agreement with the observation, it sub-sequently mainly reflected whether there was any loading by new snow. After the end of January when the weak layer was deeply buried, the SK38 no longer indicated skier triggering but yielded almost the same value as the natural stability in-dex (not shown) since1τ, the additional shear stress due to a skier, became negligibly small. Accordingly, increas-ing load due to snowfall resulted in a decreasincreas-ing SK38 as shown towards the end of February and in early March. In other words, the SK38 became dominated by the static shear stress. In contrast, the SMP-derived initiation criterionSdoes not include the static shear stress and hence showed a differ-ent behaviour with time. As Schweizer and Reuter (2015) pointed out, the dynamic load, rather than the static load due to the weight of the slab, is essential for initiating a failure due to the well-known deformation rate dependence of snow strength (e.g. Reiweger and Schweizer, 2010).
The modelled critical cut lengthrcSNP(Eq. 8) based on re-cent findings by Gaume et al. (2016) steadily increased over the 2-month period. All three essential variables, namely the load, the slab modulus and the weak layer shear strength in-creased overall with time. Whereas an increase of the load – all other variables remaining unchanged – would result in a decrease of the critical cut length, increasing slab modulus as well as increasing weak layer shear strength leads to increas-ing critical cut length. The latter two variables are directly related to snow density, which in general increases with time – except for the average slab density which may temporar-ily decrease after a snowfall. In our case, with regard to the critical crack lengthrcSNP, the effect of increasing load was clearly overcompensated by the effects of increasing slab ef-fective modulus and increasing weak layer shear strength.
Reiweger and Schweizer, 2010; Walters and Adams, 2014). Hence, the observed discrepancy seems mainly due to over-estimating weak layer density. Also, the SMP analysis of the weak layer strength (not shown) suggests that the increase was not as prominent as shown by SNOWPACK where the shear strength is parameterized based on the extensive shear frame measurements by Jamieson and Johnston (2001). Whereas Gaume et al. (2016) recently showed that the mod-elled critical cut length rcSNP of the weak layer we tested was lower than of the adjacent layers – suggesting that the modelled critical cut length can discriminate well between weak layers and other layers within a given snow stratigra-phy, it seems more challenging to predict changes over time since small changes of the contributing variables may decide whether the critical cut length increases or decreases. 4.4 Case studies
In general, considering the fracture mechanical approach (Anderson, 2005) reveals that in a first-order approxima-tionrc∼wσf2E; i.e. the critical crack length decreases with in-creasing load and increases with either inin-creasing slab elastic modulus or increasing specific fracture energy of the weak layer. To explore the complex interaction of these parameters described by Eq. (7), we presented four case studies. They show how the temporal evolution of the load and the modu-lus of the slab, as well as the specific fracture energy of the weak layer, affect the changes of the critical cut length with time. The most influential parameter seems to be the load. Even with an increasing weak layer specific fracture energy, the increasing load caused the cut length to decrease (Fig. 7c and d). This consistent decrease was, however, not observed in the field, where only towards the end of January did the critical crack length decrease and then clearly increase to-wards the end of the measurement period. This suggests that the increase in slab modulus and/or specific fracture energy (over-)compensated the effect of the increasing load. The fourth case, more or less mimicking the observed changes with time of the three variables, shows that under certain conditions the cut length may increase or decrease with time, primarily due to subtle changes of slab properties.
Alternatively, the sensitivity of the critical cut length could be explored with Eq. (8). In fact, if the temporal evolution of the shear strength followed the one assumed for the weak layer specific fracture energy, the same trends for the critical cut length were observed (not shown), confirming the find-ings of the case studies.
5 Conclusions
We monitored the temporal evolution of a weak layer of faceted crystals that was one of the critical weaknesses dur-ing the winter 2014–2015 in the region of Davos (Eastern Swiss Alps). We focused on the crack propagation
propen-sity and performed propagation saw tests on 7 sampling days during a 2-month period from early January to early March 2015. Tests were completed with objective measure-ments, namely by resistance profiles acquired with the snow micro-penetrometer and particle tracking velocimetry based on video images of the PSTs. Our dataset represents the first comprehensive time series of quantitative measures of criti-cal cut length and related mechanicriti-cal properties of slab layers and weak layer. In addition, we compared our field observa-tions to newly developed metrics of instability either derived from the SMP signal or from modelled snow stratigraphy.
The critical cut length, observed in the PSTs, showed an overall tendency to increase with time. However, the low-est values were observed towards the end of January/early February. These low values were not expected and seem to be the result of the complex interaction of slab and weak layer properties – rather than of measurements errors or large spa-tial variations within the study plot.
The relevant mechanical properties, the effective elas-tic modulus of the slab and the weak layer specific frac-ture energy overall increased, independent of the evalua-tion method. Only the SMP-derived effective elastic mod-ulusE*SMP showed a different behaviour. However, the in-crease was not steady and these small changes likely affected the critical cut length as exemplified with the case studies. These findings suggest that it is not possible to assess the crit-ical cut length, or in general crack propagation propensity, by simply monitoring a subset of these mechanical properties. One has to consider the complex interaction between the ef-fective elastic modulus of the slab, the load due to the slab and the weak layer specific fracture energy. Furthermore, these properties have to be determined with good accuracy since otherwise reliably modelling the critical cut length is not possible.
We then applied traditional (such as the SK38) and newly developed metrics of snow instability describing either the failure initiation or the crack propagation propensity. These metrics were derived from the SMP signal or calculated from simulated snow stratigraphy (SNOWPACK) and partially re-produced the observed temporal patterns. Whereas the SMP-derived initiation criterion appropriately indicated that trig-gering probability overall decreased, the skier stability index provided by SNOWPACK did not show this tendency but did indicate the period of increased avalanche activity towards the end of January. The predicted critical cut lengths,rcSMP
andrcSNP, overall increased with time. Whereas the SMP-derived propagation criterionrcSMPpartly reproduced the un-steady increase with some lower values towards the end of January, the SNOWPACK-derived critical cut length rcSNP
did not show any of the observed variation in critical cut length, apart from the overall increase.
outweighed if modelled metrics of instability become more reliable. This will require further validation studies – best performed by comprehensive field measurements in study plots equipped with an automatic weather station and pos-sibly an enhancement of the representation of mechanical properties in the model based on cold laboratory studies.
6 Data availability
SMP- and PTV-derived data, as well as the snow pit data, can be found in the Supplement. Raw data (SMP penetra-tion profiles and videos) are available upon request from J. Schweizer. The numerical snow cover model SNOWPACK can be downloaded from http://models.slf.ch/p/snowpack/. The weather data of AWS WAN7 are accessible from http: //www.osper.ch.
The Supplement related to this article is available online at doi:10.5194/tc-10-2637-2016-supplement.
Acknowledgements. We are grateful to Franziska Zahner and
Achille Capelli for help with the field work. Frank Techel provided the avalanche activity data. We thank Karl Birkeland and an anonymous reviewer for their constructive comments that helped to improve the paper. Benjamin Reuter was supported by a grant of the Swiss National Science Foundation (200021_144392) and Johan Gaume by an Ambizione grant of the Swiss National Science Foundation (PZ00P2_161329).
Edited by: G. Chambon
Reviewed by: K. W. Birkeland and one anonymous referee
References
Anderson, T. L.: Fracture Mechanics: Fundamentals and Applica-tions, 2005 Edn., CRC Press, Boca Raton, FL, USA, 640 pp., 2005.
Bair, E. H., Simenhois, R., van Herwijnen, A., and Birkeland, K.: The influence of edge effects on crack propagation in snow sta-bility tests, The Cryosphere, 8, 1407–1418, doi:10.5194/tc-8-1407-2014, 2014.
Birkeland, K. W.: Terminology and predominant processes associ-ated with the formation of weak layers of near-surface faceted crystals in the mountain snowpack, Arctic Alpine Res., 30, 193– 199, doi:10.2307/1552134, 1998.
Birkeland, K. W. and Landry, C.: Changes in spatial patterns of snow stability through time, Proceedings ISSW 2002, Interna-tional Snow Science Workshop, 29 September–4 October 2002, Penticton, BC, Canada, 482–490, 2002.
Birkeland, K. W., Kronholm, K., Schneebeli, M., and Pielmeier, C.: Changes in shear strength and micropenetration hardness of a buried surface-hoar layer, Ann. Glaciol., 38, 223–228, doi:10.3189/172756404781815167, 2004.
Birkeland, K. W., van Herwijnen, A., Knoff, E., Staples, M., Bair, E. H., and Simenhois, R.: The role of slabs and weak layers in fracture arrest, Proceedings ISSW 2014, International Snow Sci-ence Workshop, 29 September–3 October 2014, Banff, Alberta, Canada, 156–168, 2014.
Camponovo, C. and Schweizer, J.: Rheological measurements of the viscoelastic properties of snow, Ann. Glaciol., 32, 44–50, doi:10.3189/172756401781819148, 2001.
Chalmers, T. S.: Forecasting shear strength and skier-triggered avalanches for buried surface hoar layers, Faculty of Graduate Studies, University of Calgary, Calgary, AB, Canada, 107 pp., 2001.
Chalmers, T. S. and Jamieson, J. B.: Extrapolating the skier stabil-ity of buried surface hoar layers from study plot measurements, Cold Reg. Sci. Technol., 33, 163–177, doi:10.1016/S0165-232X(01)00043-X, 2001.
Conway, H. and Wilbour, C.: Evolution of snow slope sta-bility during storms, Cold Reg. Sci. Technol., 30, 67–77, doi:10.1016/S0165-232X(99)00009-9, 1999.
Crocker, J. C. and Grier, D. G.: Methods of digital video microscopy for colloidal studies, J. Colloid Interface Sci., 179, 298–310, doi:10.1006/jcis.1996.0217, 1996.
Fierz, C., Armstrong, R. L., Durand , Y., Etchevers, P., Greene, E., McClung, D. M., Nishimura, K., Satyawali, P. K., and Sokratov, S. A.: The International Classification for Seasonal Snow on the Ground, HP-VII Technical Documents in Hydrology, IACS Con-tribution No. 1, UNESCO-IHP, Paris, France, 90 pp., 2009. Föhn, P. and Hächler, P.: Prévision de grosses avalanches au
moyen d’un modèle déterministe-statistique, Comptes Rendues de la Deuxième Rencontre Internationale sur la Neige et les Avalanches, 12–14 April 1978, Grenoble, France, 151–165, 1978.
Föhn, P. M. B.: The stability index and various triggering mech-anisms, Symposium at Davos 1986 – Avalanche Formation, Movement and Effects, IAHS Publ., 162, 195–214, 1987. Gaume, J., Chambon, G., Reiweger, I., van Herwijnen, A., and
Schweizer, J.: On the failure criterion of weak-snow layers using the discrete element method, Proceedings ISSW 2014, Interna-tional Snow Science Workshop, 29 September–3 October 2014, Banff, Alberta, Canada, 681–688, 2014a.
Gaume, J., Schweizer, J., van Herwijnen, A., Chambon, G., Reuter, B., Eckert, N., and Naaim, M.: Evaluation of slope stability with respect to snowpack spatial variability, J. Geophys. Res., 119, 1783–1799, doi:10.1002/2014JF003193, 2014b.
Gaume, J., van Herwijnen, A., Chambon, G., Birkeland, K. W., and Schweizer, J.: Modeling of crack propagation in weak snowpack layers using the discrete element method, The Cryosphere, 9, 1915–1932, doi:10.5194/tc-9-1915-2015, 2015.
Gaume, J., van Herwijnen, A., Chambon, G., Wever, N., and Schweizer, J.: Snow fracture in relation to slab avalanche release: critical state for the onset of crack propagation, The Cryosphere Discuss., doi:10.5194/tc-2016-64, in review, 2016.
Gauthier, D. and Jamieson, J. B.: Evaluating a prototype field test for weak layer fracture and failure propagation, Proceedings ISSW 2006, International Snow Science Workshop, 1–6 Octo-ber 2006, Telluride, CO, USA, 107–116, 2006.
weak snowpack layers, Cold Reg. Sci. Technol., 51, 87–97, doi:10.1016/j.coldregions.2007.04.005, 2008.
Gauthier, D., Brown, C., and Jamieson, B.: Modeling strength and stability in storm snow for slab avalanche forecasting, Cold Reg. Sci. Technol., 62, 107–118, doi:10.1016/j.coldregions.2010.04.004, 2010.
Giraud, G.: MEPRA: an expert system for avalanche risk forecast-ing, Proceedings International Snow Science Workshop, 4–8 Oc-tober 1992, Breckenridge, Colorado, USA, 97–106, 1993. Greene, E., Atkins, D., Birkeland, K., Elder, K., Landry, C., Lazar,
B., McCammon, I., Moore, M., Sharaf, D., Sterbenz, C., Trem-per, B., and Williams, K.: Snow, Weather and Avalanches: Obser-vational Guidelines for Avalanche Programs in the United States, 2nd Edn., American Avalanche Association (AAA), Pagosa Springs, CO, USA, 152 pp., 2010.
Habermann, M., Schweizer, J., and Jamieson, J. B.: Influ-ence of snowpack layering on human-triggered snow slab avalanche release, Cold Reg. Sci. Technol., 54, 176–182, doi:10.1016/j.coldregions.2008.05.003, 2008.
Hayes, P., Wilbour, C., Gibson, R., Marshall, H. P., and Conway, H.: A simple model of snow slope stability during storms, Proceed-ings ISSW 2004, International Snow Science Workshop, 19– 24 September 2004, Jackson Hole, WY, USA, 165–171, 2005. Heierli, J., Gumbsch, P., and Zaiser, M.: Anticrack nucleation as
triggering mechanism for snow slab avalanches, Science, 321, 240–243, doi:10.1126/science.1153948, 2008.
Hendrikx, J., Birkeland, K., and Clark, M.: Assessing changes in the spatial variability of the snowpack fracture propagation propensity over time, Cold Reg. Sci. Technol., 56, 152–160, doi:10.1016/j.coldregions.2008.12.001, 2009.
Jamieson, B. and Johnston, C. D.: Snowpack factors associated with strength changes of buried surface hoar layers, Cold Reg. Sci. Technol., 30, 19–34, doi:10.1016/S0165-232X(99)00026-9, 1999.
Jamieson, J. B.: Avalanche prediction for persistent snow slabs, De-partment of Civil Engineering, University of Calgary, Calgary, AB, Canada, 258 pp., 1995.
Jamieson, J. B.: The compression test – after 25 years, Avalanche Rev., 18, 10–12, 1999.
Jamieson, J. B. and Johnston, C. D.: Refinements to the stability index for skier-triggered dry slab avalanches, Ann. Glaciol., 26, 296–302, 1998.
Jamieson, J. B. and Johnston, C. D.: Evaluation of the shear frame test for weak snowpack layers, Ann. Glaciol., 32, 59–68, doi:10.3189/172756401781819472, 2001.
Jamieson, J. B. and Schweizer, J.: Texture and strength changes of buried surface hoar layers with implications for dry snow-slab avalanche release, J. Glaciol., 46, 151–160, doi:10.3189/172756500781833278, 2000.
Jamieson, J. B., Zeidler, A., and Brown, C.: Explanation and limita-tions of study plot stability indices for forecasting dry snow slab avalanches in surrounding terrain, Cold Reg. Sci. Technol., 50, 23–34, doi:10.1016/j.coldregions.2007.02.010, 2007.
Johnson, J. B. and Schneebeli, M.: Characterizing the microstruc-tural and micromechanical properties of snow, Cold Reg. Sci. Technol., 30, 91–100, doi:10.1016/S0165-232X(99)00013-0, 1999.
LeBaron, A., Miller, D. A., and van Herwijnen, A.: Measurements of the deformation zone around a split-axis snow micropen-etrometer tip, Cold Reg. Sci. Technol., 97, 90–96, 2014. Lehning, M., Fierz, C., Brown, R. L., and Jamieson, J. B.:
Modeling instability for the snow cover model SNOWPACK, Ann. Glaciol., 38, 331–338, doi:10.3189/172756404781815220, 2004.
Logan, S., Birkeland, K. W., Kronholm, K., and Hansen, K. J.: Tem-poral changes in the slope-scale spatial variability of the shear strength of buried surface hoar layers, Cold Reg. Sci. Technol., 47, 148–158, doi:10.1016/j.coldregions.2006.08.002, 2007. Löwe, H. and van Herwijnen, A.: A Poisson shot noise model for
micro-penetration of snow, Cold Reg. Sci. Technol., 70, 62–70, doi:10.1016/j.coldregions.2011.09.001, 2012.
McClung, D. M.: Shear fracture precipitated by strain softening as a mechanism of dry slab avalanche release, J. Geophys. Res., 84, 3519–3526, doi:10.1029/JB084iB07p03519, 1979.
McClung, D. M.: Mode II fracture parameters of dry snow slab avalanche weak layers calculated from the cohesive crack model, Int. J. Fract., 193, 153–169, doi:10.1007/s10704-015-0026-1, 2015.
McClung, D. M. and Borstad, C. P.: Deformation and energy of dry snow slabs prior to fracture propagation, J. Glaciol., 58, 553–564, 2012.
McClung, D. M. and Schaerer, P.: The Avalanche Handbook, 3rd Edn., The Mountaineers Books, Seattle, WA, USA, 342 pp., 2006.
Monti, F., Gaume, J., van Herwijnen, A., and Schweizer, J.: Snow instability evaluation: calculating the skier-induced stress in a multi-layered snowpack, Nat. Hazards Earth Syst. Sci., 16, 775– 788, doi:10.5194/nhess-16-775-2016, 2016.
Pielmeier, C. and Schneebeli, M.: Measuring snow profiles with high resolution: Interpretation of the force-distance signal from a snow micro penetrometer, Proceedings ISSW 2000, International Snow Science Workshop, 1–6 October 2000, Big Sky, Montana, USA, 215–222, 2001.
Proksch, M., Löwe, H., and Schneebeli, M.: Density, specific surface area and correlation length of snow measured by high-resolution penetrometry, J. Geophys. Res., 120, 346–362, doi:10.1002/2014JF003266, 2015.
Proksch, M., Rutter, N., Fierz, C., and Schneebeli, M.: Intercom-parison of snow density measurements: bias, precision, and ver-tical resolution, The Cryosphere, 10, 371–384, doi:10.5194/tc-10-371-2016, 2016.
Reiweger, I. and Schweizer, J.: Failure of a layer of buried surface hoar, Geophys. Res. Lett., 37, L24501, doi:10.1029/2010GL045433, 2010.
Reiweger, I., Schweizer, J., Ernst, R., and Dual, J.: Load-controlled shear apparatus for snow, Cold Reg. Sci. Technol., 62, 119–125, doi:10.1016/j.coldregions.2010.04.002, 2010.
Reuter, B. and Schweizer, J.: The effect of surface warming on slab stiffness and the fracture behavior of snow, Cold Reg. Sci. Technol., 83–84, 30–36, doi:10.1016/j.coldregions.2012.06.001, 2012.