Evaluating the Stability of RNA-Seq
Transcriptome Profiles and Drug-Induced
Immune-Related Expression Changes in
Whole Blood
John F. Bowyer1*, Karen M. Tranter1, Joseph P. Hanig3, Nathaniel M. Crabtree1, Robert P. Schleimer4, Nysia I. George2
1Division of Neurotoxicology, National Center for Toxicological Research, United States Food and Drug Administration, Jefferson, Arkansas, United States of America,2Division of Bioinformatics and Biostatistics, National Center for Toxicological Research, United States Food and Drug Administration, Jefferson, Arkansas, United States of America,3Center for Drug Evaluation and Research, United States Food and Drug Administration, Silver Spring, Maryland, United States of America,4Division of Allergy and Immunology, Northwestern Feinberg School of Medicine, Chicago, Illinois, United States of America
Abstract
Methods were developed to evaluate the stability of rat whole blood expression obtained from RNA sequencing (RNA-seq) and assess changes in whole blood transcriptome profiles in experiments replicated over time. Expression was measured in globin-depleted RNA extracted from the whole blood of Sprague-Dawley rats, given either saline (control) or neuro-toxic doses of amphetamine (AMPH). The experiment was repeated four times (paired control and AMPH groups) over a 2-year span. The transcriptome of the control and AMPH-treated groups was evaluated on: 1) transcript levels for ribosomal protein subunits; 2) relative expression of immune-related genes; 3) stability of the control transcriptome over 2 years; and 4) stability of the effects of AMPH on immune-related genes over 2 years. All, except one, of the 70 genes that encode the 80s ribosome had levels that ranked in the top 5% of all mean expression levels. Deviations in sequencing performance led to significant changes in the ribosomal transcripts. The overall expression profile of immune-related genes and genes specific to monocytes, T-cells or B-cells were well represented and consistent within treat-ment groups. There were no differences between the levels of ribosomal transcripts in time-matched control and AMPH groups but significant differences in the expression of immune-related genes between control and AMPH groups. AMPH significantly increased expression of some genes related to monocytes but down-regulated those specific to T-cells. These changes were partially due to changes in the two types of leukocytes present in blood, which indicate an activation of the innate immune system by AMPH. Thus, the stability of RNA-seq whole blood transcriptome can be verified by assessing ribosomal protein subunits and immune-related gene expression. Such stability enables the pooling of samples from replicate experiments to carry out differential expression analysis with acceptable power.
OPEN ACCESS
Citation:Bowyer JF, Tranter KM, Hanig JP, Crabtree NM, Schleimer RP, George NI (2015) Evaluating the Stability of RNA-Seq Transcriptome Profiles and Drug-Induced Immune-Related Expression Changes in Whole Blood. PLoS ONE 10(7): e0133315. doi:10.1371/journal.pone.0133315
Editor:Emmanuel Dias-Neto, AC Camargo Cancer Hospital, BRAZIL
Received:March 10, 2015
Accepted:June 24, 2015
Published:July 15, 2015
Copyright:This is an open access article, free of all copyright, and may be freely reproduced, distributed, transmitted, modified, built upon, or otherwise used by anyone for any lawful purpose. The work is made available under theCreative Commons CC0public domain dedication.
Data Availability Statement:The RNA-seq data has been uploaded to the NCBI GEO site (accession numbers GSE62368 and GSE64778).
Introduction
From a clinical standpoint, transcriptomic profiling of human blood (peripheral), or its various cells types, can be a useful tool for identifying biomarkers related to disease, immune response, and exposure to irritants [1–5]. Transcriptome analysis of blood in animal studies has also shown potential for identifying candidate blood-based biomarkers [6]. Until recently, much of the prior research has been conducted using microarray technologies. However, due to greater precision, increased coverage, and larger dynamic range, RNA sequencing (RNA-seq) plat-forms offer a competitive alternative to analyze changes in transcriptome expression [7]. Although whole blood analysis faces a unique set of challenges because globin mRNA depletion is necessary to ensure data quality, the purported advantages of RNA-seq technologies in terms of dynamic range and novel differential expression have also been observed in whole blood transcriptome studies [2,8]. These researchers found that despite some of the advantages of RNA-seq over microarrays, RNA sequencing reported greater within-group variability in whole blood. Typically, RNA-seq expression demonstrates higher reproducibility and lower variability in genes with high expression [7,9,10] but globin reduction can affect signal variabil-ity in whole blood. Thus, we evaluated the stabilvariabil-ity of globin-depleted mRNA from whole blood RNA-seq expression over time. Since RNA-seq technologies have been approved for clinical use by the FDA [11], changes in blood transcriptome due to toxicity in laboratory ani-mals will play a large role in translating such changes to human data.
Globin transcripts compose over 70% of the expressed mRNA signal isolated from whole blood, and their removal has been reported to increase the integrity of transcript expression [12,13]. However, it has also been suggested that globin transcript depletion affects RNA yields, which would likely affect expression profiles [13]. As an additional means of assessing the over-all stability of globin-depleted whole blood RNA-seq profiles, we have studied two sets of important comparisons. One set of comparisons is based on subunits of the 80s ribosome. In humans and mammals, the 80s ribosome consists of over 70 protein subunits, each of which is encoded by its own specific transcript [14]. These subunits are relatively unaffected by most drug treatments and experimental manipulations and are often used as“housekeeping”genes for RT-PCR [15–18]. Because all the subunits are necessary for 80s ribosomal function, their transcripts should be expressed at high levels (relative to the entire transcriptome).
The second comparison profiles transcripts found in the various types of leukocytes (white blood cells). Here, we compared the expression of transcripts specific for monocytes/macro-phages, lymphocytes (T-cells and B-cells), and all leukocytes. In rat blood, there are roughly 10-times as many B- and T-cells (approximately equal in number) as monocytes. B-cells and T-cells make up approximately 80% of all leukocytes in rat blood and monocytes comprise only about 3%. Thus, one might suppose that the expression of monocyte specific transcripts to those specific for T-cells or B-cells might be 10-fold less and 30-fold less than transcripts expressed in all leukocytes. However, such an assumption is not correct for the chemokine, C-C motif, receptor 1 (Ccr1) since this gene is expressed at very high levels in monocytes. In contrast to this, neutrophils consist of over 10 to 20% of the white blood cells (WBC) in the cir-culating blood of rat but have relatively low levels of mRNA present, as is the case with most end stage cells including eosinophils and basophils [19].
The second primary objective of this study was to assess the stability of control and drug-treated transcriptome expression in the whole blood of Sprague-Dawley rats over time. Many laboratories often replicate the same experiment over time to ensure reproducibility of signifi-cant changes in expression resulting from drug or toxisignifi-cant exposure. Generally, data from all time points are then pooled. However, when detecting modest changes (e.g. 1.5- to 3-fold), pooling data can be problematic if the measured endpoints fluctuate by 2-fold or more over the Institutional Development Award (IDeA) Program
of the National Institutes of Health (NIH). Dr. Schleimer was supported by NIH grants R37HL068546, R01HL078860 and U19AI106683 from the NIH and by the Ernest S. Bazley Foundation.
time in the control group. In the current study, stability was assessed across four time points (ranging over a 2 year period) for a control group and a treatment group. Stability was evalu-ated primarily through comparisons of the expression profile of ribosomal subunit proteins and secondarily through comparisons profiling the entire transcriptome.
Methods
Animal Dosing and Sacrifice
This study was carried out in accordance with the declaration of Helsinki and the Guide for the Care and Use of Laboratory Animals as adopted and promulgated by the National Institutes of Health. The use of animal testing in this study was done under protocols E7295 and E7519 (issued to John Bowyer) that were approved by the NCTR institutional animal care and use committee (IACUC) which is fully accredited (Food and Drug Administration—National Cen-ter for Toxicological Research Accreditation #A4310-01) by NIH-OLAW. Nine- to ten-week-old (65 days) male Sprague-Dawley rats, ninety five total, were obtained from the Charles River Laboratories [Crl:CD(SD)]. Upon arrival at NCTR they received tail tattoos for identifi-cation. Prior to testing, rats were housed 2 per cage with food and water available ad libitum. Rats were housed on a daily 12 hr light cycle with lights on at 6:00 am and off at 6:00 pm. Dur-ing housDur-ing, the temperature (23°C) and humidity (53%) were controlled. The rats were tested between 12 and 13 weeks of age (87 days old).
The data used in this study (a cohort of a larger study contained in GSE62368 and
GSE64778) is comprised of data fromn= 22 saline dosed“control”rats andn= 21 rats given a neurotoxic exposure to AMPH. The larger study was carried out to identify mRNA biomarkers and to determine transcriptional immune-related responses present in circulating blood after neurotoxic exposures to hyperthermia, neurotoxic AMPH exposure, and non-neurotoxic AMPH exposure. Herein, we focus solely on the control and neurotoxic AMPH treatment groups. Multiple replicates of the same experiment were conducted over a 2 year period. This was done to ensure that any significant effects seen in transcript expression would be robust and reproducible over time and hopefully subsequently observable in other laboratories. The sample size of the control group at each time period was: Con1:n= 3, Con2:n= 7, Con3: n= 6, and Con4:n= 6. The size of the AMPH groups were: AMPH1:n= 5, AMPH2:n= 3, AMPH3:n= 6, and AMPH4:n= 7. The saline control and AMPH groups were sacrificed on: Con1 and AMPH1, September 2012; Con2 and AMPH2, June 2013; Con3 and AMPH3, Aug 2013; Con4 and AMPH4, July 2014.
Dosing commenced at 8:00 a.m. and ended at 2:00 p.m. AMPH-exposed animals were given 4 doses of amphetamine comprised of a sequential exposure to 5, 7.5, 10, and 10 mg/kg AMPH subcutaneously with 2 hr between each dose. The d-amphetamine-sulfate (Sigma-Aldrich, St. Louis, MO) dose was dissolved in normal saline (1 ml/ kg injected). This AMPH dosing paradigm was modified slightly from an original acute methamphetamine dosing paradigm that was shown to produce neurotoxicity [20,21]. The saline animals received 4 injections of 1 ml/kg s.c. In all groups, the behavior and body temperature of each rat were monitored hourly during saline or AMPH exposure and until at least 3 hr after the last dose (time of sacrifice). The lethal effects of hyperthermia and hyperpyrexia in the AMPH groups when body temperatures exceeded 41.4°C were prevented by placing the animals unrestrained on crushed ice for 15 to 30 min in a clean, wood chip free cage to allow their temperatures to drop below 40.0°C.
Collection and processing of cardiac blood
withdrawn from the heart using an 18 gauge needle attached to a 5 ml syringe, and the rats were then euthanatized with decapitation. Approximately 1 ml of the blood was immediately separated into approximately three 300μl aliquots, frozen on dry ice in cylindrical foil capsules, and then stored at -70°C for later RNA-seq analysis. The remainder of the blood was injected into a 7.0 ml BD (Franklin Lanes, NJ) Vacutainer containing 12 mg EDTA (data from these ali-quots are to be reported at later date). One ml was used to count the total RBC and WBC num-bers as well as the different types of WBC present. Within 12 h of collection of the cardiac blood in EDTA coated vacutainers, one ml was used to determine total RBC, WBC counts, and the numbers of lymphocytes (T- and B-cells), monocytes, neutrophils, basophils and eosino-phils present. Complete blood counts were determined on an ABX Pentra 60 C+ analyzer (ABX, Irvine CA). Maintenance and calibration was done according to the manufacturer’s rec-ommendations. Three levels of assayed controls were included in daily analyses as internal controls.
RNA isolation and RNA-seq processing
RNA isolation was performed using RNAzol BD (Molecular Research Center, Inc.,www. mrcgene.com) [9] with modified procedures for frozen blood. Just prior to RNA isolation, the frozen 300–400μl RBC or whole blood aliquots were placed on dry ice and cut into ap-proximately 100 to 150μl sections. Two or three of these smaller sections were immediately (were not allowed to thaw) homogenized in 1.6 ml of RNAzol BD containing 45μl of 5 N acetic acid using a 2 ml Teflon pestle homogenizer. Approximately 300 to 400μl of frozen whole blood was used for RNA isolation. Separation of the upper phase containing the extracted RNA with lower phases containing protein and DNA was accomplished by adding 350μl of 4-bromoanisole and centrifugations at 12,000 x g for 10 min. To precipitate the RNA, 600μl 2-propanol was added to 600 to 700μl the extracted upper phase. After 15 min, centrifugation at 12,000 x g was performed. The RNA ppt was washed once with 70% ethanol and water and a second wash of 100% ethanol. After1 min air drying the RNA was dissolved in 25 to 35μl of RNase-free water. The final total cellular RNA recovered ranged from 5 to 25μg and was stored at -70°C until shipment for data processing. Two to fourμl of each aliquot was set aside for purity analysis at NCTR using an Agilent 2200 TapeStation System (Agilent Technologies, Palo Alto, CA).
The isolated total RNA was then shipped overnight on dry ice to Expression Analysis Inc. [EA; Durham, NC] for globin transcript removal and sequencing. Alpha and Beta Globin mRNA were substantially depleted from total RNA samples using the GlobinClear-Mouse/Rat Kit (Life Technologies # AM1981), essentially as described by the vendor. Briefly, 1.25μg of total RNA isolated from whole blood was combined with biotinylated capture oligonucleotides complementary to globin mRNAs and the mixture incubated at 50°C for 15 minutes to allow duplex formation. Streptavidin magnetic beads were added to each specimen, and the resulting mixture was incubated for an additional 30 minutes at 50°C to allow binding of the biotin moieties by Streptavidin. These complexes, comprising Streptavidin magnetic beads bound to biotinylated oligonucleotides that are specifically hybridized to globin mRNAs, were then cap-tured using a magnet. The globin-depleted supernatant is transferred to a new container and further purified using RNA binding beads. The final globin mRNA-depleted RNA samples are quantitated by spectrophotometry using a NanoDrop ND-8000 spectrophotometer.
RNA-seq Expression Profiling
synthesis methods, as implemented via Illumina technology, were used to generate the RNA-seq data. Globin mRNA-depleted RNA samples were converted into cDNA libraries using the TruSeq Stranded mRNA Sample Prep Kit (Illumina, #RS-122-2103). Starting with 300 ng of globin mRNA-depleted RNA, polyadenylated RNA (primarily mRNA) was selected and puri-fied using oligo-dT conjugated magnetic beads. This mRNA was chemically fragmented and converted into single-stranded cDNA using reverse transcriptase and random hexamer prim-ers, with the addition of Actinomycin D to suppress DNA-dependent synthesis of the second strand. Double-stranded cDNA was created by removing the RNA template and synthesizing the second strand in the presence of dUTP in place of dTTP. A single A base was added to the 3’end to facilitate ligation of sequencing adapters, which contain a single T base overhang. Adapter-ligated cDNA was amplified by polymerase chain reaction to increase the amount of sequence-ready library. During this amplification the polymerase stalls when it encounters a U base, rendering the second strand a poor template. Accordingly, amplified material used the first strand as a template, thereby preserving the strand information. Final cDNA libraries were analyzed for size distribution using an Agilent 2200 TapeStation (D1000 Screentape, Agilent # 5067–5582), quantitated by qPCR (KAPA Library Quant Kit, KAPA Biosystems # KK4824), then normalized to 2 nM in preparation for sequencing.
The 2nM normalized samples were pooled. cDNA templates were denatured using fresh 0.1N NaOH, and then diluted to a final loading concentration of 13pM. Cluster generation was performed on an Illumina cBOT (v1.5.12.0) using an Illumina TruSeq Paired-End Cluster Kit v3 (Illumina # PE-401-3001) to cluster an Illumina Paired End Flow Cell. Templates were attached to the flowcell via a dense lawn of oligonucleotides that bind to the sequencing adapt-ers added during sample preparation, which are extended and then denatured. The flowcell was then sequenced through 51 bases, paired end, with an 8 base index cycle on an Illumina HiSeq 2000 (HiSeq Control Software v 1.5.15.1). During sequencing cycles, fluorescent revers-ible terminator dNTPs were added to the clusters, with only a single base per target being incorporated. Following imaging of the clusters, the terminator and fluorescent tag were cleaved so that the next base could be incorporated. Quality control files contained read length and depth results (before and after clipping), presence of artifact/ duplicate sequences, distribu-tion of base quality and base frequency by sample. Also, flow cell total yield, PF reads, barcode quality, alignment summaries and number of genes detected were determined. The basecall files were converted to fastq files using CASAVA 1.8.2. The fastq files were clipped using fastq-mcf with the parameters“—max-ns 4—qual-mean 25-H-p 5-q 7-l 25”[22]. The fastq files were aligned to the rat Ensembl release 70 transcriptome (rn5) using bowtie 0.12.9 with the parame-ters“-e 500–m 100–chunkmbs 256”. The alignments were quantified using RSEM v 1.2.0 with no special parameters.
RNA-seq Data Analysis
RNA-seq by Expectation-Maximization (RSEM) [23] data generated by EA was rounded to produce digital expression values. In total, 16,881 transcripts were mapped to the reference rat genome in all samples. Transcript-level outliers within each experimental group were identified by the iLOO method [24] and subsequently replaced with the trimmed mean. All reports of average transcript expression are summarized using DESeq2 normalized counts [25]. DESeq2 was also used to carry out differential expression analysis. Significance was assessed using p-values adjusted by the Benjamini-Hochberg method for multiple comparison testing. Tran-scripts with adjusted p-values lower than 0.05 and absolute log2(FC) values exceeding specific
A number of criteria were used to identify the most stable transcripts for RNA-seq data. Ide-ally, a stable transcript would show minimal variability, be consistently expressed in the high region of expression, and demonstrate consistent expression across treatment groups. Thus, can-didates for stable expression were transcripts with no detected outliers, no measurements in the low expressed region [26], and no significant difference between the control and treatment group.
All analyses were carried out in R (http://www.r-project.org).
Results
The RNA integrity number (RIN) for the control whole blood samples (n = 22) ranged from 7.0 to 9.4, averaging 8.3 ± 0.15 (mean ± SEM). The RIN for the AMPH group ranged from 6.9 to 9.3, averaging 8.1 ± 0.15 (mean ± SEM), and did not significantly differ from control. Although globin depletion is reported to reduce expression [2], hemoglobin alpha (Hba) remained the highest expressed transcript. Also, as would be expected, the expression of olfac-tory receptor genes (approximately 1,200 unique transcripts [10]) was virtually absent in blood with only 14 genes having counts greater than 1. In addition, we assessed whether high levels of myoglobin transcript (Mb) were present in the blood samples. Since cardiac muscle contains very high levels of myoglobin [27], high expression of the myoglobin transcript could indicate that cardiac muscle was“contaminating”the samples as a result of the cardiac punctures to obtain whole blood. Two of the control animals from the Con4 group had very high levels (>5000 counts) forMb. They were removed from further analysis resulting in n = 20 for the
control group. None of the animals in the AMPH group had to be removed from the study due to highMblevels. Mb expression for the remaining control and AMPH animals was relatively low with mean expressions of 29.8 ± 3.4 and 35.8 ± 1.8, respectively.
Average expression for the 70+ genes necessary to encode the 80s ribosome are shown in
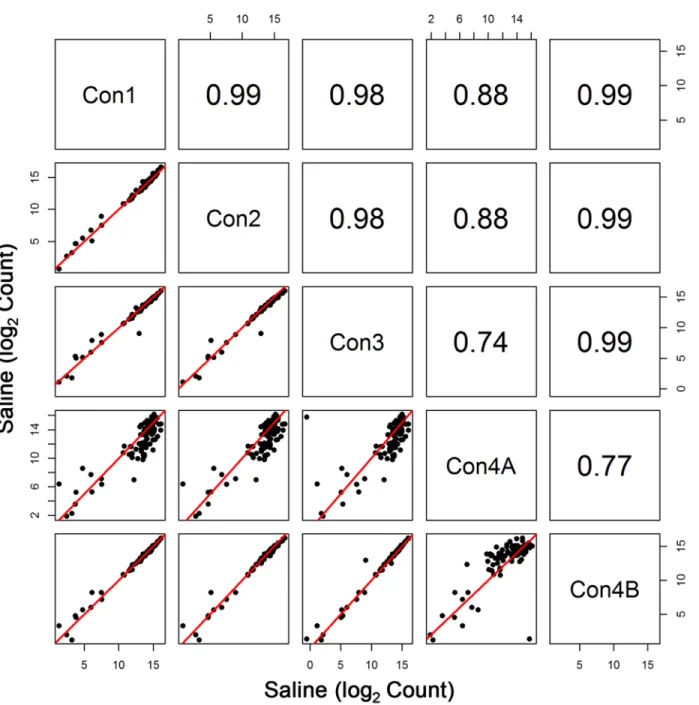
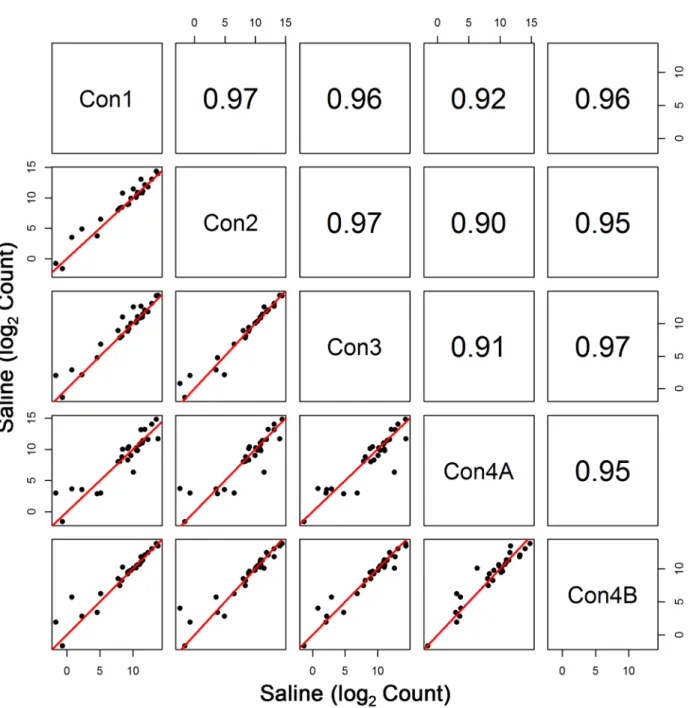
Table 1. The large 70s subunit transcripts are labeled with an NCBI gene symbol beginning with“Rpl,”while the small 30s subunit transcripts begin with“Rps.”Average expression for most of the transcripts was ranked in the top 5thpercentile of expression levels (i.e. rank of 844 or higher). All of the ribosomal subunit genes, except Rpl22, had at least one transcript (splice variant) in the top 5thpercentile; Rpl22 ranked 1010 in whole blood. RNA-seq expression of the ribosomal proteins for control animals were highly correlated (r0.98 for log2 expression data) across the first 3 time points (Fig 1).
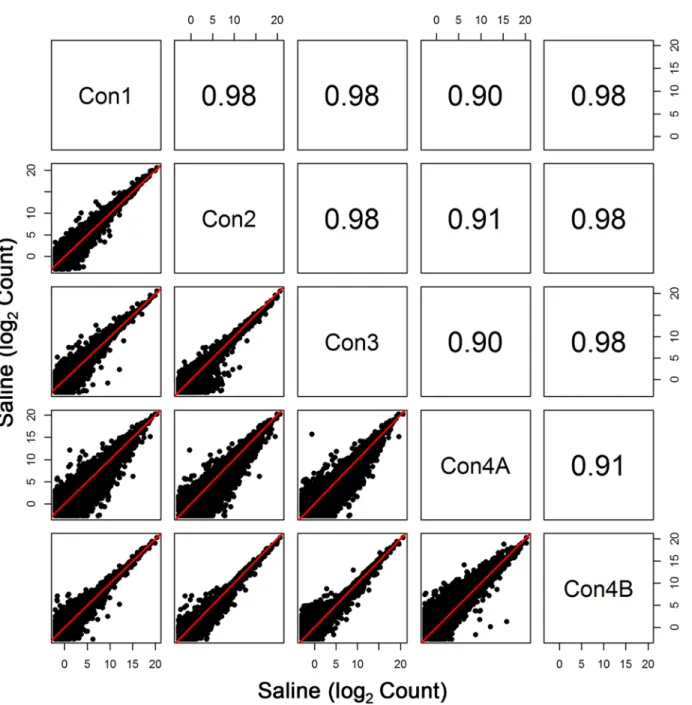
Initial sequencing of the Con4 group (denoted by Con4A) yielded poorer correlation with the other groups (r0.74 for log2 expression data) (Fig 1). To some extent, diminished correla-tion between Con4A and Con1–Con3 was also evident when assessing profiles of the entire transcriptome (Fig 2). Interestingly, this was the case despite the fact that total clusters, genes detected, % genes detected, % transcriptome mapped, skewness, median coverage, and % of all genes mapped did not differ between Con1, Con2, Con3, and Con4A. One noticeable fluctua-tion was the slight decrease in %(G+C), which ranged from 43% to 48% for Con4A, compared to the usual 48% to 53% range for the other groups. The less than optimal sequencing results shown with Con4A were due to an Illumina library preparation kit that contained a less than optimal PCR Master Mix reagent.
Table 1. Expression of Rat Ribosomal Subunit Transcripts in the Whole Blood of Control and Amphetamine Treated Rats.
Saline Control Amphetamine Treated
Expression Expression AMPH/
NCBI Gene Symbol Mean±S.E.M. Rank Mean±S.E.M. Rank Saline Control
Rpl10:ENSRNOG00000027149 31893.0± 421.9 105 34635.3± 401.4 98 1.3
Rpl10a:ENSRNOG00000000505 9887.6± 100.5 334 8928.4± 127.1 369 1.2
Rpl11:ENSRNOG00000026260 23073.5± 289.6 150 24913.7± 391.7 154 1.4
Rpl12:ENSRNOG00000016220 15528.6± 365.5 224 15192.8± 289.8 248 1.4
*Rpl12:ENSRNOG00000028993 7674.5± 167.0 401 7969.2± 210.0 408 1.2
*Rpl12:ENSRNOG00000029115 15150.2± 247.8 228 14472.4± 220.1 256 1.3
Rpl13:ENSRNOG00000015335 29819.8± 415.3 117 31336.5± 491.6 109 1.5
Rpl13a:ENSRNOG00000020618 28861.6± 308.3 120 29432.5± 507.0 121 1.4
Rpl14:ENSRNOG00000019007 12413.0± 141.1 274 9284.6± 112.9 356 0.9
Rpl15:ENSRNOG00000008140 15195.2± 166.8 227 13822.1± 183.4 263 1.2
Rpl17:ENSRNOG00000018680 21339.7± 288.1 167 19123.8± 214.3 198 1.1
Rpl18:ENSRNOG00000021035 8567.6± 81.7 372 8457.1± 138.5 389 1.4
Rpl18a:ENSRNOG00000018795 40188.2± 592.3 76 51024.5± 1097.5 64 1.8
Rpl19:ENSRNOG00000004741 25006.9± 290.9 135 23030.5± 352.5 169 1.2
Rpl21:ENSRNOG00000032803 16950.7± 275.5 209 16430.0± 243.4 226 1.0
Rpl22:ENSRNOG00000011104 2727.7± 31.8 1010 2837.7± 48.3 983 1.4
Rpl23:ENSRNOG00000004107 13309.8± 134.4 259 11163.5± 164.0 311 0.9
Rpl23a:ENSRNOG00000023344 17242.6± 186.9 205 14001.2± 178.8 260 0.9
Rpl24:ENSRNOG00000001611 22081.8± 302.1 155 23210.1± 337.5 165 1.4
Rpl26:ENSRNOG00000004214 31889.1± 499.8 106 33986.3± 570.6 101 1.3
Rpl27:ENSRNOG00000020674 7331.6± 71.5 415 6345.6± 69.5 505 1.1
Rpl27a:ENSRNOG00000014214 24434.3± 302.1 140 25924.0± 476.5 146 1.3
Rpl29:ENSRNOG00000011138 14791.7± 189.7 234 14602.4± 199.2 255 1.4
Rpl3:ENSRNOG00000016896 14420.0± 141.7 241 8603.1± 138.8 385 0.7
Rpl30:ENSRNOG00000005975 13539.3± 167.3 255 13097.6± 206.3 274 0.9
Rpl31:ENSRNOG00000013508 24249.5± 349.2 142 23430.2± 332.7 163 1.2
Rpl32:ENSRNOG00000010746 28258.2± 396.6 122 28800.5± 432.8 128 1.4
Rpl34:ENSRNOG00000016387 8489.6± 87.5 375 7677.0± 113.7 425 1.2
*Rpl34:ENSRNOG00000038045 28.2± 0.7 10918 31.5± 0.9 10455 1.5
Rpl35:ENSRNOG00000014272 33448.1± 591.9 99 35533.8± 514.4 94 1.5
Rpl35a:ENSRNOG00000031641 17519.3± 225.7 200 17619.4± 239.9 214 1.2
Rpl36:ENSRNOG00000033473 4599.4± 54.8 608 5142.6± 135.7 581 1.6
Rpl36a:ENSRNOG00000011494 3296.0± 32.0 833 2592.8± 42.7 1055 1.0
*Rpl36a:ENSRNOG00000031315 3262.0± 35.3 846 2692.5± 50.0 1026 1.0
Rpl37:ENSRNOG00000012538 38285.2± 804.7 81 47356.1± 957.2 72 1.7
*Rpl37:ENSRNOG00000033803 6.3± 0.4 13020 6.1± 0.2 12923 1.2
Rpl37a:ENSRNOG00000023385 19229.3± 296.9 186 23055.8± 452.0 167 1.6
*Rpl37a:ENSRNOG00000028883 4612.0± 61.7 606 6254.9± 146.9 512 1.8
Rpl38:ENSRNOG00000036729 34474.2± 989.8 93 42146.7± 1131.0 81 1.5
Rpl39:ENSRNOG00000043348 9446.1± 130.5 343 10128.0± 165.6 334 1.0
*Rpl39:ENSRNOG00000050074 1729.5± 22.5 1556 1868.1± 32.6 1424 1.3
Rpl4:ENSRNOG00000009378 45765.1± 487.7 70 38909.3± 557.6 87 1.0
Rpl41:ENSRNOG00000042233 80725.2± 1496.6 43 109715.4± 2532.4 36 1.8
Rpl5:ENSRNOG00000023529 24050.0± 243.6 143 16129.6± 204.8 233 0.7
Table 1. (Continued)
Saline Control Amphetamine Treated
Expression Expression AMPH/
NCBI Gene Symbol Mean±S.E.M. Rank Mean±S.E.M. Rank Saline Control
Rpl6:ENSRNOG00000025936 10268.5± 78.2 322 7202.2± 126.3 445 0.8
*Rpl6:ENSRNOG00000031889 3282.0± 36.0 838 1904.4± 31.8 1401 0.8
Rpl7:ENSRNOG00000006992 29977.4± 327.1 116 29814.7± 425.4 118 1.1
Rpl8:ENSRNOG00000032635 13255.6± 118.4 261 11086.7± 164.8 314 1.2
Rpl9:ENSRNOG00000026716 17304.3± 159.2 204 13393.7± 205.0 272 0.8
*Rpl9:ENSRNOG00000030476 153.6± 11.2 7710 264.4± 15.2 5606 2.7
Rplp0:ENSRNOG00000001148 73659.3± 1015.5 47 81630.6± 1118.8 44 1.5
Rplp1:ENSRNOG00000013874 40.9± 1.3 10316 79.4± 5.8 8646 0.9
*Rplp1:ENSRNOG00000011955 55821.4± 911.5 62 74504.6± 1882.8 49 1.9
Rplp2:ENSRNOG00000002116 17380.8± 256.1 203 19606.5± 394.2 194 1.6
Rps10:ENSRNOG00000000490 13917.0± 208.8 252 17008.0± 395.3 218 1.7
Rps11:ENSRNOG00000020595 26964.8± 283.4 126 21665.1± 248.7 176 1.0
Rps12:ENSRNOG00000016411 41375.2± 662.4 72 49498.5± 824.3 69 1.4
Rps13:ENSRNOG00000020502 12198.2± 126.3 278 10438.1± 143.2 328 1.0
Rps14:ENSRNOG00000018774 26173.5± 364.3 129 36716.1± 987.6 93 1.8
Rps15:ENSRNOG00000024603 22360.2± 351.5 152 25440.3± 462.5 149 1.4
Rps15a:ENSRNOG00000018320 12646.9± 138.8 272 12070.6 215.2 296 1.1
Rps16:ENSRNOG00000019578 29497.0± 348.7 118 32065.2 590.8 106 1.4
Rps17:ENSRNOG00000019106 25283.8± 343.9 133 25954.4 418.2 145 1.3
*Rps17:ENSRNOG00000045885 5.2± 0.2 13271 6.1 0.2 12921 1.5
Rps18:ENSRNOG00000028505 21474.0± 239.0 166 18142.0 259.0 210 1.2
*Rps18:ENSRNOG00000033152 179.6± 3.4 7301 204.3 8.9 6314 1.5
Rps19:ENSRNOG00000037897 8822.0± 106.2 363 8943.1 123.9 368 1.4
*Rps19:ENSRNOG00000048199 8822.0± 106.2 363 8943.1 123.9 368 1.4
Rps2:ENSRNOG00000014179 38904.8± 702.2 80 42806.2 800.0 78 1.5
Rps20:ENSRNOG00000008555 5637.0± 234.6 514 4117.5 199.2 708 1.1
*Rps20:ENSRNOG00000029627 7704.9± 125.6 399 11610.1± 382.7 304 2.1
Rps21:ENSRNOG00000006325 10307.7± 119.1 319 10628.3± 201.3 323 1.4
Rps23:ENSRNOG00000016580 24662.4± 393.2 139 25586.8± 427.8 148 1.3
Rps24:ENSRNOG00000010189 28135.8± 370.4 123 30522.1± 547.9 113 1.1
*Rps24:ENSRNOG00000031579 1800.8± 21.9 1497 2110.4± 48.2 1282 1.2
Rps25:ENSRNOG00000027503 21631.1± 276.9 162 22315.4± 341.5 173 1.1
Rps26:ENSRNOG00000005517 11789.5± 130.0 288 11758.4± 172.6 300 1.4
Rps27:ENSRNOG00000016961 17810.5± 178.1 197 15471.2± 277.0 247 1.0
Rps27a:ENSRNOG00000004426 36526.0± 507.4 85 42300.5± 764.1 80 1.2
Rps28:ENSRNOG00000049442 25.6± 0.8 11066 42.2± 1.8 9919 1.8
*Rps28:ENSRNOG00000042886 6562.1± 71.4 450 6716.2± 122.8 477 1.4
Rps29:ENSRNOG00000004196 62022.7± 1182.1 51 77274.0± 1721.9 48 1.7
*Rps29:ENSRNOG00000028939 398.2± 8.3 4979 542.5± 18.5 3683 1.9
*Rps29:ENSRNOG00000029443 79.9± 2.3 9166 94.3± 3.5 8251 1.1
Rps3:ENSRNOG00000017418 16506.2± 146.5 213 12966.6± 159.7 278 1.0
Rps3a:ENSRNOG00000011893 34804.9± 382.8 92 32152.9± 478.1 105 0.9
Rps4x:ENSRNOG00000029574 0.7± 0.1 15754 67.2± 8.5 8981 16.2
Rps4x:ENSRNOG00000003201 32176.8± 387.7 104 30607.2± 498.8 112 1.3
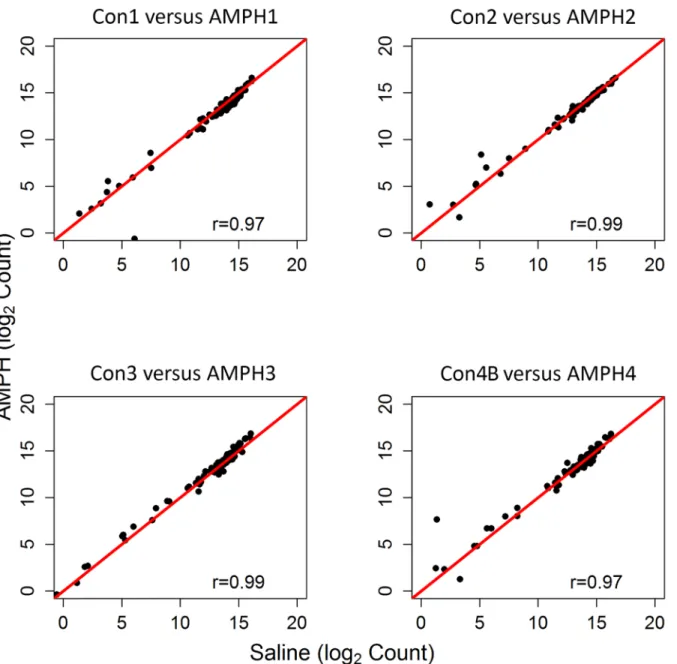
was maintained. When profiles of the ribosomal subunit expression for the four AMPH groups (AMPH1, AMPH2, AMPH3 and AMPH4) were compared to each other, pairwise correlation values were comparable to those observed for the control groups (correlation values among the four pairs ranged between 0.97 and 0.98). Somewhat surprisingly, correlation between each control group and the time-matched AMPH group was at least 0.97 (Fig 3).
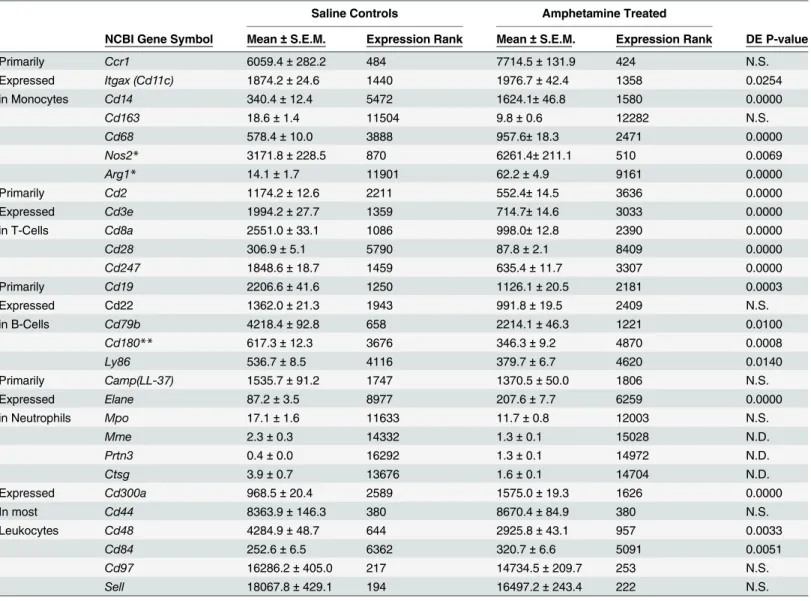
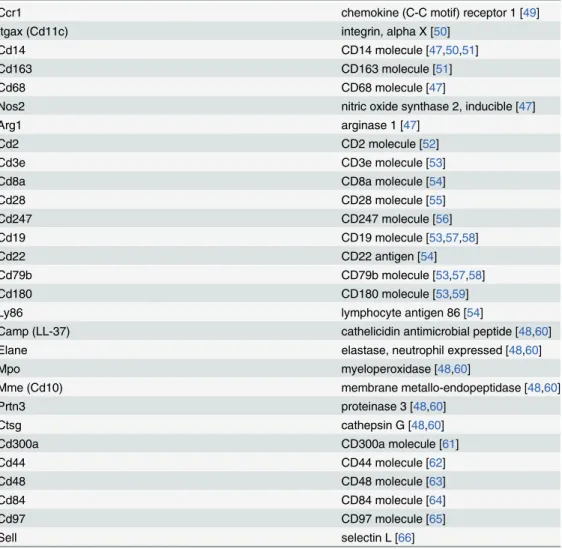
To further characterize repeatability of the control expression profiles, 29 genes specifically related to the immune system and found predominately on leukocytes were evaluated. The mean (and standard error) of each gene is reported in Tables2and3for both groups (all four sub-groups were included in the calculations). Most of the selected genes are classified as cluster of differentiation antigens (i.e. classification determinant) and are located on the outer membranes of leukocytes. The seven transcripts primarily expressed on monocytes/macrophages (Ccr1, Cd14,Cd163,Cd68,Itgax,Nos2andArg1) had a 1000-fold range if indeed interleukin 1βis exclusively produced in monocytes (Il1bcounts reached 18,000). Ten genes preferentially expressed in either T-cells (Cd2,Cd3e,Cd8a,Cd28,Cd247) or B-cells (Cd19,Cd22,Cd79b,Cd180 andLy86) had a median expression of 1921 with only slightly more than a 10-fold range. The median expression of 6 selected transcripts found in almost all leukocytes (Cd300a,Cd44,Cd48, Cd84,Cd97andSell) was 6342 but ranged over 70-fold. The neutrophil related genes (Camp, Elane,Mpo,Mme,Prtn3 and Ctsg) had expression levels below 100 except forCamp.
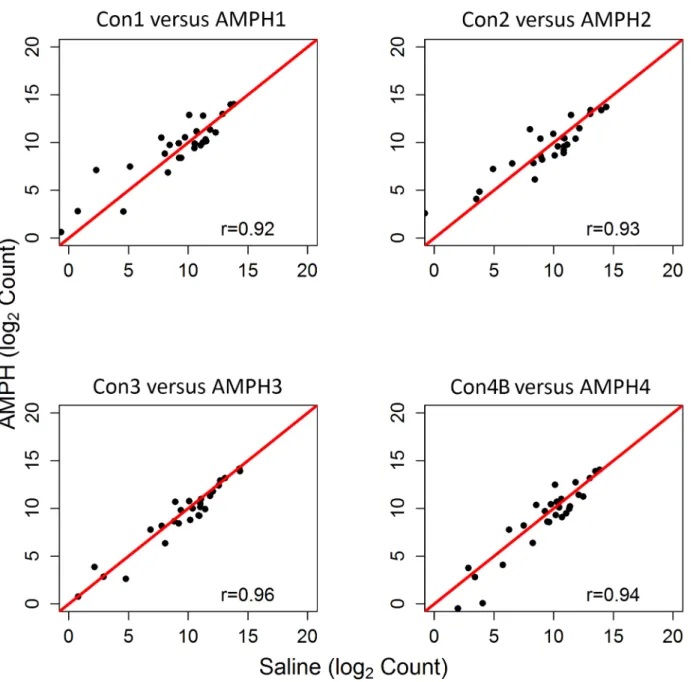
The expression of these immune-related genes had near-1 correlation (r0.97) among the four control groups (Con1-Con3 and Con4B) (Fig 4). However, as expected, the correlation between each control group and its paired time-matched AMPH group was not as strong because of the known effect of the drug on the immune system (Fig 5).Fig 6presents the log2
fold change of AMPH to control expression for the selected immune-related genes, except for the three neutrophil-related genes with very low expression. Relative expression is presented for all four time-matched groups and also for all of the data (denoted by a purple diamond). AMPH has a significant effect on 15 of the 26 genes. Relative to control, all of the genes primar-ily expressed in T-cells decreased approximately 1.5- to 3.0-fold, while 4 of the 7 monocyte-specific transcripts increased between 2.0 and 6-fold. Expression of 3 of the 5 genes relatively specific for B-cells decreased around 1.5-fold, and genes that are normally expressed in most leukocytes were not significantly different (less 1.5-fold), with only two of the six genes (Cd300a andCd84) reaching significance between AMPH and control.
Table 1. (Continued)
Saline Control Amphetamine Treated
Expression Expression AMPH/
NCBI Gene Symbol Mean±S.E.M. Rank Mean±S.E.M. Rank Saline Control
Rps5:ENSRNOG00000019453 12298.5± 132.2 277 12072.3± 193.8 295 1.4
Rps6:ENSRNOG00000007663 20594.8± 220.2 175 14431.5± 162.7 257 0.9
*Rps6:ENSRNOG00000049025 7738.2± 88.5 397 7193.3± 179.5 446 0.9
Rps7:ENSRNOG00000008551 23143.1± 257.8 149 18565.1± 248.2 204 1.0
*Rps7:ENSRNOG00000027694 3.6± 0.3 13751 3.5± 0.3 13723 0.8
Rps8:ENSRNOG00000018768 36417.7± 577.2 86 34246.2± 498.0 99 1.2
Rps9:ENSRNOG00000011355 11785.5± 175.2 289 14631.5± 208.2 254 1.8
*Rps9:ENSRNOG00000049813 3203.4± 32.0 861 4394.3± 72.6 672 1.7
*Indicates that more than one transcript was expressed for this particular ribosomal subunit gene.
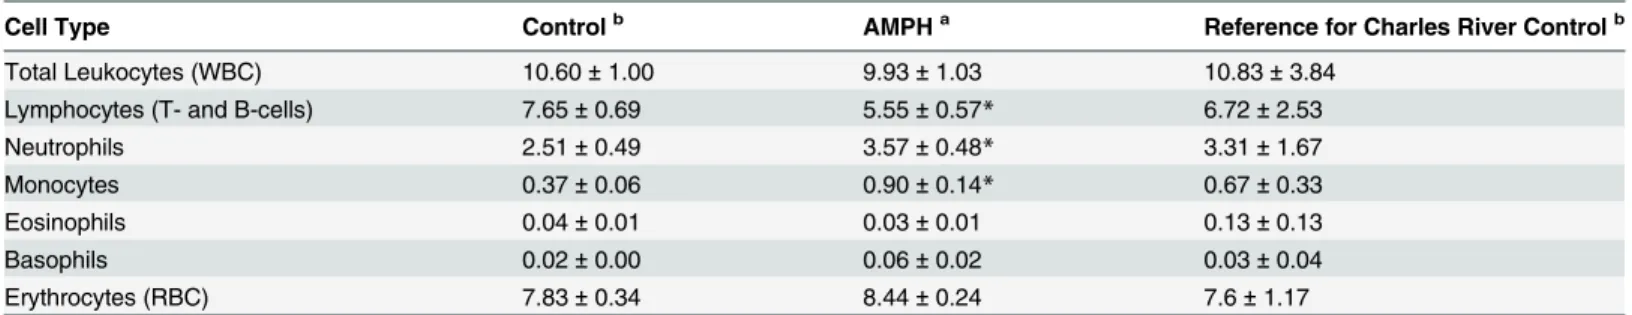
The levels of the major types of leukocytes in blood for control and AMPH are presented in
Table 4. The levels of the lymphocytes (72.3%), neutrophils (23.6%), monocytes (3.5%), eosino-phils (0.4%) and basoeosino-phils (0.2%) were as would be expected based on standard reported levels Monocytes were significantly upregulated by AMPH; the levels of neutrophils were also upre-gulated by AMPH and marginally significant. Lymphocytes were significantly down-reupre-gulated by AMPH.
Fig 1. Comparison of the Ribosomal Subunit Expression among Control Groups.Pearson correlation and scatterplot matrix of log2 normalized expression of the ribosomal subunit proteins in control groups, Con1-Con4B. The red solid line is the identity line. Note that the aberrant/anomalous results of Con4A are due to less than optimal amplification prior to sequencing.
Discussion
The results of our study demonstrate the stability of whole blood RNA-seq transcriptome pro-files after globin transcript depletion. Globin depletion was implemented since it has been observed to improve the transcriptome profile in whole blood in previous studies using RNA-seq methods [2]. Any loss of RNA due to globin removal was reasonably consistent since Fig 2. Comparison of All Transcripts among the Control Groups.Pearson correlation and scatterplot matrix of log2 normalized expression of all transcripts in control groups, Con1-Con4B. The red solid line is the identity line. Again, the aberrant results of Con4A are due to less than optimal amplification prior to sequencing.
comparisons of transcriptome profiles over a period of two years were highly correlated for both the control and treatment group. The level of agreement is also attributed to consistent expression of each experimental group across time. Our study provides evidence that the con-sistency and repeatability of RNA-seq of whole blood can be validated by profiling expression of the ribosomal subunits. However, further studies will be necessary to determine whether this approach is more sensitive than methods such as the detection of aberrant G-C profiles [28]. The utility of RNA-seq data from whole blood was further demonstrated by the completeness Fig 3. Expression of Ribosomal Subunits in the Control versus Amphetamine Groups.Pearson correlation and scatterplot matrix of log2 normalized expression of the ribosomal subunit proteins comparing each control group to its time-matched AMPH group. The red solid line is the identity line.
of the expression profile of immune-related genes as well as the consistent effect that drug treat-ment had on the expression of these genes, at least in the case of a toxic exposure to AMPH [29].
The 80s ribosome is a group of more than 70 transcripts, of which are all expressed at rela-tively very high levels [14]. Note that there are 10 transcripts with lower expression; however, the gene for each of these transcripts produced another transcript (splice variant) that mea-sured at much higher levels. As seen in this study, the one anomalous group of RNA-seq data (Con4A) that was less than optimal showed large variability in these transcript levels (Fig 1). This was solely due to a very rare instance of amplification kit variability. Although the observed variability in Con4A expression was somewhat apparent in the entire transcriptome (Fig 2), the deviant variation was readily apparent when profiling the ribosomal subunits. As an example, Pearson correlation values for Con4A were at least 0.90 for the whole genome but were as low as 0.74 when comparing expression levels of the ribosomal transcripts.
Table 2. Expression of Selected Immune-Related Transcripts in Control and Amphetamine Treated Rats.
Saline Controls Amphetamine Treated
NCBI Gene Symbol Mean±S.E.M. Expression Rank Mean±S.E.M. Expression Rank DE P-value
Primarily Ccr1 6059.4±282.2 484 7714.5±131.9 424 N.S.
Expressed Itgax (Cd11c) 1874.2±24.6 1440 1976.7±42.4 1358 0.0254
in Monocytes Cd14 340.4±12.4 5472 1624.1±46.8 1580 0.0000
Cd163 18.6±1.4 11504 9.8±0.6 12282 N.S.
Cd68 578.4±10.0 3888 957.6±18.3 2471 0.0000
Nos2* 3171.8±228.5 870 6261.4±211.1 510 0.0069
Arg1* 14.1±1.7 11901 62.2±4.9 9161 0.0000
Primarily Cd2 1174.2±12.6 2211 552.4±14.5 3636 0.0000
Expressed Cd3e 1994.2±27.7 1359 714.7±14.6 3033 0.0000
in T-Cells Cd8a 2551.0±33.1 1086 998.0±12.8 2390 0.0000
Cd28 306.9±5.1 5790 87.8±2.1 8409 0.0000
Cd247 1848.6±18.7 1459 635.4±11.7 3307 0.0000
Primarily Cd19 2206.6±41.6 1250 1126.1±20.5 2181 0.0003
Expressed Cd22 1362.0±21.3 1943 991.8±19.5 2409 N.S.
in B-Cells Cd79b 4218.4±92.8 658 2214.1±46.3 1221 0.0100
Cd180** 617.3±12.3 3676 346.3±9.2 4870 0.0008
Ly86 536.7±8.5 4116 379.7±6.7 4620 0.0140
Primarily Camp(LL-37) 1535.7±91.2 1747 1370.5±50.0 1806 N.S.
Expressed Elane 87.2±3.5 8977 207.6±7.7 6259 0.0000
in Neutrophils Mpo 17.1±1.6 11633 11.7±0.8 12003 N.S.
Mme 2.3±0.3 14332 1.3±0.1 15028 N.D.
Prtn3 0.4±0.0 16292 1.3±0.1 14972 N.D.
Ctsg 3.9±0.7 13676 1.6±0.1 14704 N.D.
Expressed Cd300a 968.5±20.4 2589 1575.0±19.3 1626 0.0000
In most Cd44 8363.9±146.3 380 8670.4±84.9 380 N.S.
Leukocytes Cd48 4284.9±48.7 644 2925.8±43.1 957 0.0033
Cd84 252.6±6.5 6362 320.7±6.6 5091 0.0051
Cd97 16286.2±405.0 217 14734.5±209.7 253 N.S.
Sell 18067.8±429.1 194 16497.2±243.4 222 N.S.
*These genes may also be in dendritic cells as well as monocytes but the levels of dendritic cells are much lower in circulating blood than monocytes.
**This gene is also present in plasma cells but the levels of these types of cells in blood would be much lower than B cells in circulating blood.
An additional benefit of using ribosomal transcripts rather than the entire genome is that the majority of ribosomal transcripts do not change much with AMPH treatment. Only two of the ribosomal transcripts were significantly differentially expressed between control and AMPH (p<0.05 and FC>2). However, it is not yet known how other types of drug/toxicant
treatments will affect subunit expression relative to control. Several ribosomal proteins have been used as“housekeeping”genes to normalize RT-PCR expression across individual RNA samples, although they may not be optimal in all tissues [11–14]. As an example, in our study, ribosomal protein L7, Rpl7, was identified as the highest consistently expressed transcript across all 41 samples. Finally, a relatively high expression for at least one transcript of each gene in the ribosomal subunit is almost as important as consistent expression. This is because expression of all of the genes is necessary to form one of the most numerous protein complexes in an organism. Our data showed that at least one transcript for each ribosomal gene ranked in the upper 5thpercentile of expression. One could argue that the use of a set of 10 or so genes commonly used to normalize RT-PCR data would provide a better way to determine the poten-tial for significant variation in whole blood RNA-seq. However, such analysis would be limited in some respects because the specific genes in a set of housekeeping genes for RT-PCR are not linked by a common process or protein complex. Thus, unlike the set of ribosomal transcripts, Table 3. Citations for Gene Expression within Leukocyte Cell Types.
Ccr1 chemokine (C-C motif) receptor 1 [49]
Itgax (Cd11c) integrin, alpha X [50]
Cd14 CD14 molecule [47,50,51]
Cd163 CD163 molecule [51]
Cd68 CD68 molecule [47]
Nos2 nitric oxide synthase 2, inducible [47]
Arg1 arginase 1 [47]
Cd2 CD2 molecule [52]
Cd3e CD3e molecule [53]
Cd8a CD8a molecule [54]
Cd28 CD28 molecule [55]
Cd247 CD247 molecule [56]
Cd19 CD19 molecule [53,57,58]
Cd22 CD22 antigen [54]
Cd79b CD79b molecule [53,57,58]
Cd180 CD180 molecule [53,59]
Ly86 lymphocyte antigen 86 [54]
Camp (LL-37) cathelicidin antimicrobial peptide [48,60]
Elane elastase, neutrophil expressed [48,60]
Mpo myeloperoxidase [48,60]
Mme (Cd10) membrane metallo-endopeptidase [48,60]
Prtn3 proteinase 3 [48,60]
Ctsg cathepsin G [48,60]
Cd300a CD300a molecule [61]
Cd44 CD44 molecule [62]
Cd48 CD48 molecule [63]
Cd84 CD84 molecule [64]
Cd97 CD97 molecule [65]
Sell selectin L [66]
it is much more difficult to determine whether the relative levels of the various genes previously used to normalize RT-PCR are as they should be (in relationship to each other).
In this study, we profiled the expression of immune-related genes (mostly cell determinant genes that are expressed on leukocytes). The stability and consistency of the expression of these immune-related genes are also important as these are the genes in whole blood, along with cytokines and chemokines protein levels in blood, that are used to evaluate how the immune system is responding to a given disease, treatment or toxic insult [30–37]. These genes are Fig 4. Comparison of Immune-Related Transcripts among the Control Groups.Pearson correlation and scatterplot matrix of log2 normalized expression of the selected immune-related genes in control groups, Con1-Con4B. The red solid line is the identity line.
major effectors in the chemokine and cytokine signaling system of leukocytes. There have been previous reports on how gene expression, as determined by microarray or RNA-seq, is affected in human blood in anorexic patients or after acute ethanol exposure [38,39]. However, these studies focused primarily on genes not necessary directly related to cytokines, chemokines, or receptors that are exclusively or predominately localized to leukocytes. One very recent RNA-Fig 5. Expression of Immune-Related Genes in the Control versus Amphetamine Groups.Pearson correlation and scatterplot matrix of log2
normalized expression of the selected immune-related genes comparing each control group to its time-matched AMPH group. The red solid line is the identity line.
Fig 6. Expression Changes in Genes Primarily Expressed in Monocytes, B-cells or T-cells, and all Leukocytes as a Result of Neurotoxic AMPH Exposure.Scatterplot of log2 fold change (AMPH to control) expression of the selected immune-related genes. For each gene, values of log2FC are presented for each time-matched subgroup comparison using a different colored dot for each subgroup (AMPH1/Con1, black; AMPH2/Con2, red; AMPH3/ Con3, blue and AMPH4/Con4B green). The pooled expression of AMPH to control over all subgroups (AMPH/Con) is represented by a purple diamond. Differential expression was assessed for the latter comparison. Log2FC expression for genes with adjusted p-values smaller than 0.05 and 0.58<|log2FC|< 1 is marked by one asterisk. Likewise, expression for genes with adjusted p-values smaller than 0.05 and |log2FC|1 is marked with two asterisks.
doi:10.1371/journal.pone.0133315.g006
Table 4. Analysis of Leukocyte Cell Types Present in the Whole Blood of Control and Amphetamine Treated Rats.
Cell Type Controlb AMPHa Reference for Charles River Controlb
Total Leukocytes (WBC) 10.60±1.00 9.93±1.03 10.83±3.84
Lymphocytes (T- and B-cells) 7.65±0.69 5.55±0.57* 6.72±2.53
Neutrophils 2.51±0.49 3.57±0.48* 3.31±1.67
Monocytes 0.37±0.06 0.90±0.14* 0.67±0.33
Eosinophils 0.04±0.01 0.03±0.01 0.13±0.13
Basophils 0.02±0.00 0.06±0.02 0.03±0.04
Erythrocytes (RBC) 7.83±0.34 8.44±0.24 7.6±1.17
aValues for the total and various cell types of leukocytes are measured in thousands (103) per cubic mm of blood and erythrocyte levels are given in
millions (106) per cubic mm of blood. Reported values represent mean±SEM for blood samples collected from 16 control and 16 AMPH animals. bReference values for the total and various cell types of leukocytes and RBCs for 56 to 70 day old adult male Charles River Crl:CD(SD) rats were
obtained fromhttp://www.criver.com/files/pdfs/rms/cd/rm_rm_d_cd_rat.aspx. The mean±standard deviation levels are given.
*p<0.05; Mann-Whitney U test.
seq study investigated the effects of immunosuppression on the expression of genes related to cytokine/chemokine signaling in mononuclear cells isolated from peripheral blood in patients involved in [40]. A pronounced 10-fold or more down regulation of these genes was observed due to the immunosuppression. Our data clearly indicates that RNA-seq methods are also a sensitive method for detecting changes in gene expression related to cytokine and chemokine signaling resulting from toxic exposures, in this case AMPH.
We observed that the levels of transcripts relatively specific for monocytes, T-cells, B-cells, neutrophils or present in all leukocytes were roughly as expected in the circulating blood of rat. Transcript levels relatively specific for monocytes, the least abundant cell type (3%), were read-ily detectable in the control and amphetamine groups, and some such asCcr1had very high expression. All but one of the genes specific for neutrophils, which are 8 to 15% of the all WBCs in rat, were at low levels. This would be expected due to the nature of mature neutro-phils present in circulating blood. However, some genes, mostly those also present in other types of WBCs, can be induced [19]. Therefore, some of the expression that we observed in blood of interleukin 1b (Il1b) and neutrophil cytosolic factor 1 (Ncf1), which were at very high levels (data not shown), could have been due to expression in neutrophils as well as monocytes. Thus, the overall profile of immune expression was well represented.
There was a significant difference between the control and amphetamine groups for several of the selected immune-related genes. Specifically, 10 of the 26 immune-related genes had 2-fold or greater change in expression and 5 additional genes demonstrated at least 1.5-fold change in expression. Two genes,Cd14andArg1, increased expression more than 4-fold as a result of amphetamine exposure. Importantly, the response (change in transcript levels) of all these genes, exceptCd163, was very consistent across all four treatment groups. In general, many of the changes observed in these immune related genes might be expected to be due to AMPH exposure, including the increase inβ-adrenergic stimulation produced by AMPH releasing norepinephrine [41–44]. Finding treatment-induced changes in immune-related transcripts is of the utmost importance since previous, and likely subsequent, animal studies involving gene expression in blood or serum have focused on changes related to immune sys-tem function.
Our data on cell counts of monocytes and lymphocytes (T-cells and B-cells) in circulating blood indicate that the transcript expression changes may be partially explained by increased or decreased numbers of specific types of leukocytes present in circulating blood after AMPH. The monocyte count increased slightly over two fold while the lymphocyte levels decreased approximately 30%. In regards to the monocytes, the increase in their numbers could partially explain the increase in expression of genes specifically found in them. Nonetheless, the changes in numbers/counts cannot explain all the gene expression changes seen. The expression increases in monocyte-specific genes range from a less than 1.5-fold increase (Ccr1andItgax) to almost a 6-fold increase forCd14, which would strongly argue that there is likely a relative change in the relative expression of the genes present within the circulating monocytes. Like-wise, the 30% decreases in the number of circulating T-cells and B-cells may not explain the much greater fold change decreases, particularly in T-cell-related genes. Overall, the increases in the circulating blood expression profile and monocyte and neutrophil cells numbers indicate an activation of the innate immune system by AMPH [45–48].
expressed transcripts. The ability to show reproducibility of treatment effect on the transcrip-tome over time lends to the validation of the expression changes that are reported.
Author Contributions
Conceived and designed the experiments: RPS JFB NIG NMC JPH KMT. Performed the exper-iments: JFB KMT NMC. Analyzed the data: JFB NIG RPS NMC JPH KMT. Contributed reagents/materials/analysis tools: JFB KMT NIG NMC. Wrote the paper: JFB NIG RPS JPH NMC.
References
1. Mohr S, Liew CC (2007) The peripheral-blood transcriptome: new insights into disease and risk assess-ment. Trends Mol Med 13: 422–432. PMID:17919976
2. Raghavachari N, Xu X, Munson PJ, Gladwin MT (2009) Characterization of whole blood gene expres-sion profiles as a sequel to globin mRNA reduction in patients with sickle cell disease. PLoS One 4: e6484. doi:10.1371/journal.pone.0006484PMID:19649296
3. Kam SH, Singh A, He JQ, Ruan J, Gauvreau GM, O'Byrne PM, et al. (2012) Peripheral blood gene expression changes during allergen inhalation challenge in atopic asthmatic individuals. J Asthma 49: 219–226. doi:10.3109/02770903.2011.654300PMID:22316092
4. Brouard S, Mansfield E, Braud C, Li L, Giral M, Hsieh SC, et al. (2007) Identification of a peripheral blood transcriptional biomarker panel associated with operational renal allograft tolerance. Proc Natl Acad Sci U S A 104: 15448–15453. PMID:17873064
5. Broderick G, Ben-Hamo R, Vashishtha S, Efroni S, Nathanson L, Barnes Z, et al. (2013) Altered immune pathway activity under exercise challenge in Gulf War Illness: an exploratory analysis. Brain Behav Immun 28: 159–169. doi:10.1016/j.bbi.2012.11.007PMID:23201588
6. O'Loughlin A, Lynn DJ, McGee M, Doyle S, McCabe M, Earley B (2012) Transcriptomic analysis of the stress response to weaning at housing in bovine leukocytes using RNA-seq technology. BMC Geno-mics 13: 250. doi:10.1186/1471-2164-13-250PMID:22708644
7. Marioni JC, Mason CE, Mane SM, Stephens M, Gilad Y (2008) RNA-seq: an assessment of technical reproducibility and comparison with gene expression arrays. Genome Res 18: 1509–1517. doi:10. 1101/gr.079558.108PMID:18550803
8. Raghavachari N, Barb J, Yang Y, Liu P, Woodhouse K, Levy D, et al. (2012) A systematic comparison and evaluation of high density exon arrays and RNA-seq technology used to unravel the peripheral blood transcriptome of sickle cell disease. BMC Med Genomics 5: 28. doi:10.1186/1755-8794-5-28 PMID:22747986
9. Li S, Tighe SW, Nicolet CM, Grove D, Levy S, Farmerie W, et al. (2014) Multi-platform assessment of transcriptome profiling using RNA-seq in the ABRF next-generation sequencing study. Nat Biotechnol 32: 915–925. doi:10.1038/nbt.2972PMID:25150835
10. Zhao S, Fung-Leung WP, Bittner A, Ngo K, Liu X (2014) Comparison of RNA-Seq and microarray in transcriptome profiling of activated T cells. PLoS One 9: e78644. doi:10.1371/journal.pone.0078644 PMID:24454679
11. Sheridan C (2014) Milestone approval lifts Illumina's NGS from research into clinic. Nat Biotechnol 32: 111–112. doi:10.1038/nbt0214-111PMID:24509734
12. Shin H, Shannon CP, Fishbane N, Ruan J, Zhou M, Balshaw R, et al. (2014) Variation in RNA-Seq tran-scriptome profiles of peripheral whole blood from healthy individuals with and without globin depletion. PLoS One 9: e91041. doi:10.1371/journal.pone.0091041PMID:24608128
13. Mastrokolias A, den Dunnen JT, van Ommen GB, t Hoen PA, van Roon-Mom WM (2012) Increased sensitivity of next generation sequencing-based expression profiling after globin reduction in human blood RNA. BMC Genomics 13: 28. doi:10.1186/1471-2164-13-28PMID:22257641
14. Yusupova G, Yusupov M (2014) High-Resolution Structure of the Eukaryotic 80S Ribosome. Annu Rev Biochem 83: 467–486. doi:10.1146/annurev-biochem-060713-035445PMID:24580643
15. Cai JH, Deng S, Kumpf SW, Lee PA, Zagouras P, Ryan A, et al. (2007) Validation of rat reference genes for improved quantitative gene expression analysis using low density arrays. Biotechniques 42: 503–512. PMID:17489238
17. Martinez-Beamonte R, Navarro MA, Larraga A, Strunk M, Barranquero C, Acin S, et al. (2011) Selec-tion of reference genes for gene expression studies in rats. J Biotechnol 151: 325–334. doi:10.1016/j. jbiotec.2010.12.017PMID:21219943
18. Vandesompele J, De Preter K, Pattyn F, Poppe B, Van Roy N, De Paepe A, et al. (2002) Accurate nor-malization of real-time quantitative RT-PCR data by geometric averaging of multiple internal control genes. Genome Biol 3: RESEARCH0034. PMID:12184808
19. Subrahmanyam YV, Yamaga S, Prashar Y, Lee HH, Hoe NP, Kluger Y, et al. (2001) RNA expression patterns change dramatically in human neutrophils exposed to bacteria. Blood 97: 2457–2468. PMID: 11290611
20. Bowyer JF, Thomas MT, Schmued LC, Ali SF (2008) Brain region-specific neurodegenerative profiles showing the relative importance of amphetamine dose, hyperthermia, seizures and the blood-brain bar-rier. Ann NY Acad Sci 1139: 127–139. doi:10.1196/annals.1432.005PMID:18991857
21. Sonsalla PK, Nicklas WJ, Heikkila RE (1989) Role for excitatory amino acids in methamphetamine-induced nigrostriatal dopaminergic toxicity. Science 243: 398–400. PMID:2563176
22. Aronesty E (2013) Comparison of sequencing utility programs. Open Bioinform J 7: 1–8.
23. Li B, Dewey CN (2011) RSEM: accurate transcript quantification from RNA-Seq data with or without a reference genome. BMC Bioinformatics 12: 323. doi:10.1186/1471-2105-12-323PMID:21816040
24. George NI, Bowyer JF, Crabtree NM, Chang CW (2015) An Iterative Leave-One-Out Approach to Out-lier Detection in RNA-Seq Data. PLoS One 10: e0125224. doi:10.1371/journal.pone.0125224PMID: 26039068
25. Love M, Huber H, Anders S (2014) Moderated estimation of fold change and dispersion for RNA-Seq data with DESeq2. bioRxiv. Preprint Published online February 19: 2014.
26. George NI, Chang CW (2014) DAFS: a data-adaptive flag method for RNA-sequencing data to differen-tiate genes with low and high expression. BMC Bioinformatics 15: 92. doi:10.1186/1471-2105-15-92 PMID:24685233
27. Hendgen-Cotta UB, Flogel U, Kelm M, Rassaf T (2010) Unmasking the Janus face of myoglobin in health and disease. J Exp Biol 213: 2734–2740. doi:10.1242/jeb.041178PMID:20675542
28. Lehning EJ, Balaban CD, Ross JF, Reid MA, LoPachin RM (2002) Acrylamide neuropathy. I. Spatio-temporal characteristics of nerve cell damage in rat cerebellum. Neurotoxicology 23: 397–414. PMID: 12387366
29. Bowyer JF, Patterson TA, Saini UT, Hanig JP, Thomas M, Camacho L, et al. (2013) Comparison of the global gene expression of choroid plexus and meninges and associated vasculature under control con-ditions and after pronounced hyperthermia or amphetamine toxicity. BMC Genomics 14: 147. doi:10. 1186/1471-2164-14-147PMID:23497014
30. Mirantes C, Passegue E, Pietras EM (2014) Pro-inflammatory cytokines: Emerging players regulating HSC function in normal and diseased hematopoiesis. Exp Cell Res.
31. Rabinovitch M, Guignabert C, Humbert M, Nicolls MR (2014) Inflammation and immunity in the patho-genesis of pulmonary arterial hypertension. Circ Res 115: 165–175. doi:10.1161/CIRCRESAHA.113. 301141PMID:24951765
32. Wu D, Zhou J, Bi H, Li L, Gao W, Huang M, et al. (2014) CCL11 as a potential diagnostic marker for asthma? J Asthma 51: 847–854. doi:10.3109/02770903.2014.917659PMID:24796647
33. Menard-Katcher C, Furuta GT (2014) Non- and semi-invasive methods of monitoring eosinophilic esophagitis. Dig Dis 32: 102–106. doi:10.1159/000357295PMID:24603390
34. Locke BA, Dasu T, Verbsky JW (2014) Laboratory diagnosis of primary immunodeficiencies. Clin Rev Allergy Immunol 46: 154–168. doi:10.1007/s12016-014-8412-4PMID:24569953
35. Signorelli SS, Fiore V, Malaponte G (2014) Inflammation and peripheral arterial disease: the value of circulating biomarkers (Review). Int J Mol Med 33: 777–783. doi:10.3892/ijmm.2014.1657PMID: 24535646
36. Visconti L, Nelissen K, Deckx L, van den Akker M, Adriaensen W, Daniels L, et al. (2014) Prognostic value of circulating cytokines on overall survival and disease-free survival in cancer patients. Biomark Med 8: 297–306. doi:10.2217/bmm.13.122PMID:24521026
37. Wiseman S, Marlborough F, Doubal F, Webb DJ, Wardlaw J (2014) Blood markers of coagulation, fibri-nolysis, endothelial dysfunction and inflammation in lacunar stroke versus lacunar stroke and non-stroke: systematic review and meta-analysis. Cerebrovasc Dis 37: 64–75. doi:10.1159/000356789 PMID:24401164
39. Kupfer DM, White VL, Strayer DL, Crouch DJ, Burian D (2013) Microarray characterization of gene expression changes in blood during acute ethanol exposure. BMC Med Genomics 6: 26. doi:10.1186/ 1755-8794-6-26PMID:23883607
40. Dorr C, Wu B, Guan W, Muthusamy A, Sanghavi K, Schladt DP, et al. (2015) Differentially expressed gene transcripts using RNA sequencing from the blood of immunosuppressed kidney allograft recipi-ents. PLoS One 10: e0125045. doi:10.1371/journal.pone.0125045PMID:25946140
41. Bellinger DL, Lorton D (2014) Autonomic regulation of cellular immune function. Auton Neurosci 182: 15–41. doi:10.1016/j.autneu.2014.01.006PMID:24685093
42. Felten DL, Felten SY, Bellinger DL, Carlson SL, Ackerman KD, Madden KS, et al. (1987) Noradrenergic sympathetic neural interactions with the immune system: structure and function. Immunol Rev 100: 225–260. PMID:3326822
43. Nance DM, Sanders VM (2007) Autonomic innervation and regulation of the immune system (1987– 2007). Brain Behav Immun 21: 736–745. PMID:17467231
44. Mahajan SD, Hu Z, Reynolds JL, Aalinkeel R, Schwartz SA, Nair MP (2006) Methamphetamine modu-lates gene expression patterns in monocyte derived mature dendritic cells: implications for HIV-1 patho-genesis. Mol Diagn Ther 10: 257–269. PMID:16884330
45. Akira S, Misawa T, Satoh T, Saitoh T (2013) Macrophages control innate inflammation. Diabetes Obes Metab 15 Suppl 3: 10–18. doi:10.1111/dom.12151PMID:24003916
46. Di Santo JP (2014) Staying innate: transcription factor maintenance of innate lymphoid cell identity. Immunol Rev 261: 169–176. doi:10.1111/imr.12202PMID:25123284
47. Lauvau G, Chorro L, Spaulding E, Soudja SM (2014) Inflammatory monocyte effector mechanisms. Cell Immunol 291: 32–40. doi:10.1016/j.cellimm.2014.07.007PMID:25205002
48. Amulic B, Cazalet C, Hayes GL, Metzler KD, Zychlinsky A (2012) Neutrophil function: from mechanisms to disease. Annu Rev Immunol 30: 459–489. doi:10.1146/annurev-immunol-020711-074942PMID: 22224774
49. Cook DN, Beck MA, Coffman TM, Kirby SL, Sheridan JF, Pragnell IB, et al. (1995) Requirement of MIP-1 alpha for an inflammatory response to viral infection. Science 269: MIP-1583–MIP-1585. PMID:7667639
50. Geissmann F, Jung S, Littman DR (2003) Blood monocytes consist of two principal subsets with distinct migratory properties. Immunity 19: 71–82. PMID:12871640
51. Biswas SK, Mantovani A (2010) Macrophage plasticity and interaction with lymphocyte subsets: cancer as a paradigm. Nat Immunol 11: 889–896. doi:10.1038/ni.1937PMID:20856220
52. Bierer BE, Burakoff SJ (1988) T cell adhesion molecules. FASEB J 2: 2584–2590. PMID:2838364
53. Painter MW, Davis S, Hardy RR, Mathis D, Benoist C, Immunological Genome Project Consortium (2011) Transcriptomes of the B and T lineages compared by multiplatform microarray profiling. J Immu-nol 186: 3047–3057. doi:10.4049/jimmunol.1002695PMID:21307297
54. Kioussis D, Ellmeier W (2002) Chromatin and CD4, CD8A and CD8B gene expression during thymic differentiation. Nat Rev Immunol 2: 909–919. PMID:12461564
55. Moretta A, Ciccone E, Pantaleo G, Tambussi G, Bottino C, Melioli G, et al. (1989) Surface molecules involved in the activation and regulation of T or natural killer lymphocytes in humans. Immunol Rev 111: 145–175. PMID:2697680
56. Moretta A, Bottino C, Vitale M, Pende D, Cantoni C, Mingari MC, et al. (2001) Activating receptors and coreceptors involved in human natural killer cell-mediated cytolysis. Annu Rev Immunol 19: 197–223. PMID:11244035
57. Horcher M, Souabni A, Busslinger M (2001) Pax5/BSAP maintains the identity of B cells in late B lym-phopoiesis. Immunity 14: 779–790. PMID:11420047
58. Mansson R, Welinder E, Ahsberg J, Lin YC, Benner C, Glass CK, et al. (2012) Positive intergenic feed-back circuitry, involving EBF1 and FOXO1, orchestrates B-cell fate. Proc Natl Acad Sci U S A 109: 21028–21033. doi:10.1073/pnas.1211427109PMID:23213261
59. Miyake K, Yamashita Y, Ogata M, Sudo T, Kimoto M (1995) RP105, a novel B cell surface molecule implicated in B cell activation, is a member of the leucine-rich repeat protein family. J Immunol 154: 3333–3340. PMID:7897216
60. Sigal LH (2012) Basic science for the clinician 59: polymorphonuclear cells: mechanisms in human defense and in the pathogenesis of autoimmune disease. J Clin Rheumatol 18: 443–449. doi:10.1097/ RHU.0b013e31827732f1PMID:23211587
62. Merzaban JS, Burdick MM, Gadhoum SZ, Dagia NM, Chu JT, Fuhlbrigge RC, et al. (2011) Analysis of glycoprotein E-selectin ligands on human and mouse marrow cells enriched for hematopoietic stem/ progenitor cells. Blood 118: 1774–1783. doi:10.1182/blood-2010-11-320705PMID:21659548
63. Boles KS, Stepp SE, Bennett M, Kumar V, Mathew PA (2001) 2B4 (CD244) and CS1: novel members of the CD2 subset of the immunoglobulin superfamily molecules expressed on natural killer cells and other leukocytes. Immunol Rev 181: 234–249. PMID:11513145
64. Krause SW, Rehli M, Heinz S, Ebner R, Andreesen R (2000) Characterization of MAX.3 antigen, a gly-coprotein expressed on mature macrophages, dendritic cells and blood platelets: identity with CD84. Biochem J 346 Pt 3: 729–736. PMID:10698700
65. Safaee M, Clark AJ, Ivan ME, Oh MC, Bloch O, Sun MZ, et al. (2013) CD97 is a multifunctional leuko-cyte receptor with distinct roles in human cancers (Review). Int J Oncol 43: 1343–1350. doi:10.3892/ ijo.2013.2075PMID:23969601