ComputerizedMedicalImagingandGraphics37 (2013) 409–417
ContentslistsavailableatScienceDirect
Computerized
Medical
Imaging
and
Graphics
j ou rn a l h om ep a ge :w w w . e l s e v i e r . c o m / l o c a t e / c o m p m e d i m a g
Automatic
localization
of
the
optic
disc
by
combining
vascular
and
intensity
information
Ana
Maria
Mendonc¸
a
a,b,∗,
António
Sousa
a,c,
Luís
Mendonc¸
a
d,
Aurélio
Campilho
a,b aINEB–InstitutodeEngenhariaBiomédica,UniversidadedoPorto,Porto,PortugalbFEUP–FaculdadedeEngenharia,UniversidadedoPorto,Porto,Portugal
cISEP–InstitutoSuperiordeEngenharia,InstitutoPolitécnicodoPorto,Porto,Portugal dServic¸odeOftalmologia–HospitaldeBraga,Braga,Portugal
a
r
t
i
c
l
e
i
n
f
o
Articlehistory:
Received7December2012
Receivedinrevisedform19April2013 Accepted25April2013
Keywords:
Retinalimageanalysis Opticdisclocalization Retinalvesselsegmentation Entropy
a
b
s
t
r
a
c
t
Thispaperdescribesanewmethodologyforautomaticlocationoftheopticdiscinretinalimages,basedon thecombinationofinformationtakenfromthebloodvesselnetworkwithintensitydata.Thedistribution ofvesselorientationsaroundanimagepointisquantifiedusingthenewconceptofentropyofvascular directions.TherobustnessofthemethodforODlocalizationisimprovedbyconstrainingthesearchfor maximalvaluesofentropytoimageareaswithhighintensities.Themethodwasabletoobtainavalid locationfortheopticdiscin1357outofthe1361imagesofthefourdatasets.
© 2013 Elsevier Ltd. All rights reserved.
1. Introduction
Theopticdisc(OD)isoneofthemajorlandmarksthatstand outfromtheobservationofahumanretina.ODlocalizationis fre-quentlyrequiredfortheimplementationofimageanalysis-based solutionsfortheassessmentandfollow-upofseveraleye condi-tions.DetectionoftheODisrelevantinglaucomatouseyesasthis disorderaffectstheshapeandappearanceofthedisc,butitcanalso beusefulfordifferentiatingfromwhitelesionsrelatedtodiabetic retinopathy,orfromdrusenassociatedwithage-relatedmacular degeneration[1].KnowledgeaboutODpositionisalsorequiredfor automatingthedeterminationofdiagnosticindexesfor hyperten-siveretinopathy,suchastheArteriolar-to-Venulardiameterratio (AVR)[2].
TheODistheentrypointofthenervousand bloodsystems intotheretinaandisoftenthebrightestregioninafundusimage. These two distinctive features have been the major strategies forautomatingthelocalizationanddetectionoftheODreported intheliterature.Approachesthatrely onfeatures derivedfrom colorincludetheuseofmaximalintensity,maximalvariance,or theevaluationofimagevariationalongspecificdirections[3–6], template-matching[7,8],Houghtransform[4,10]anddeformable
∗Correspondingauthorat:INEB,CampusdaFEUP,RuaDr.RobertoFrias,s/n,
4200-465Porto,Portugal.Tel.:+351225081859.
E-mailaddresses:[email protected](A.M.Mendonc¸a),[email protected] (A.Sousa),[email protected](L.Mendonc¸a),[email protected] (A.Campilho).
models[8,9].Severalauthorshaveproposedmethodsthatusethe bloodvesselnetworkasastartingpointforODdetection[11–15]. Solutionscombiningthesimultaneousdetectionofseveralretinal structuresaredescribedin[16,17].
Thispaperdescribesamethodforautomatingthelocalization oftheODincoloreyefundusimages,bycombininginformation extractedfromthevascularnetworkwithintensitydataobtained fromthered(R)andgreen(G)channelsoftheRGBrepresentation. Thedistributionandvariabilityofvesselsaroundeachimagepoint areestimatedusingtheconceptofentropyofvasculardirections, whichassociateshighvaluesofthismeasurewiththeoccurrenceof alargenumberofvesselswithmultipleorientations.This informa-tionisthencombinedwiththehighestimageintensities,withthe goaloflocalizingpixelswherebothentropyandintensityare maxi-mized.Thehereinproposedapproachisanimprovedandextended versionofthemethodpreviously presentedbytheauthorsofa conferencepaperin[18].Themajordifferencesbetweenthetwo solutionsare:theinitialcalculationoftheentropyofvascular direc-tionsusinga lowresolutionimage;theuseoftheentropymap forevaluatingthequalityofthevascularsegmentationand decid-ingonthecriteriaforestimatingthelocalizationofthedisc;and theinclusionofapost-processingstepforobtainingthefinalOD position.
The paper is organized as follows. Section 2 describes the methodologythatwasdevelopedforautomatingthelocalization of thedisc.Theresultsobtainedusingthe imagesof four pub-liclyavailabledatabases,DRIVE[19],STARE[20],MESSIDOR[21], andINSPIRE-AVR[22],arereportedinSection3.Finally,Section4
presentssomeconclusions.
410 A.M.Mendonc¸aetal./ComputerizedMedicalImagingandGraphics37 (2013) 409–417
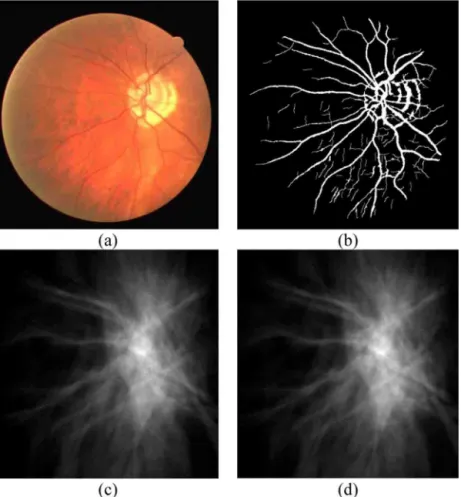
Fig.1. Originalimages(left),segmentedvascularnetworks(middle),andentropymaps(right).
2. Methodologyforopticdisclocalization
2.1. Overviewofthemethodology
ThefirstphaseofthemethodistheestimationofaninitialOD positionthroughtheapplicationofthealgorithmdescribedin[18]
toalowresolutionversionoftheoriginalimage.Inthismethod theentropyofvasculardirectionsisusedforquantifyingboththe occurrenceandthediversityofvesselorientationsaroundapixel. Afterthesegmentationofthevascularnetwork,amapwiththe entropyofvasculardirectionsiscalculatedforthefundusimage. AnintensitymaprepresentingtheEuclideandistanceofthered (R)andgreen(G)componentstotheoriginoftheRGBcolor coor-dinatesisgeneratedfromthecolorimageoftheretina;thismap isafterwardssegmentedtoretainjustthepixelswiththelargest distancevalues,whicharefurtheranalyzedtogeneratearestricted setofhighintensityODcandidates.TheinitialODlocationisthe candidatewherethemaximumvalueofentropyoccurs.
Thesecondphaseofthealgorithm,whichisnewintheherein proposedsolution,iseitheravalidationorarecalculationofthe discposition.Whenvalues ofentropyarelow,andinparticular theabsolutemaximumofentropyortheentropyintheestimated ODlocation,thequalityofthevascularsegmentationisnotreliable andanewestimatefordiscpositionissearchedforusingmainly intensitycriteria.Forhighvaluesofentropy,theinitialOD posi-tionisvalidatedifallotherlocalmaximaofentropyoccurringin differentimagelocationsshowlowervalueswhencomparedwith theonecorrespondingtothecurrentestimationforODposition.On theotherhand,ifseveralidenticallocalmaximaarefound,the pro-cessforestimatingtheODpositionisrepeatedonceagainusingthe fullresolutionimage.Afinalpost-processingphaseisappliedtoa restrictedregionaroundtheestimatedpositionofthedisc,inorder togetthefinalODlocationastheweightedcentroidoftheregion formedbythecombinationofvesselandintensitysegmentation locationresults.Themainprocessingphasesrequiredforlocating theODaredetailedinthefollowingsubsections.
2.2. Entropyofvasculardirections
TheODisaregionoftheeyefunduswherethevesselsaremore orlessdistributedinallpossibledirections.Forevaluatingthe con-vergenceandvariabilityofvesseldirectionsintheneighborhood
ofeachpointinaretinalimage,anewmeasurewasproposedin
[18]basedonthedefinitionofentropyproposedbyShannon.The entropyofvasculardirectionsiscalculatedusing(1),wherenisthe numberofdirectionsandpitheprobabilityofoccurrenceofvessels
indirectioni.
H=−
n
i=1
pi logpi (1)
Inordertocalculatetheentropymapofaretinalimage,adirection needstobeassociatedtoeveryvesselpixel.Thesegmentationof retinalbloodvesselsisaccomplishedusingthealgorithmproposed in[23],andtoobtainthevesseldirectioninformationa matched-filteringapproachsimilartotheonedescribedin[24]isapplied. Forthispurposeagrey-scaleversionoftheoriginalRGBimageis sequentiallyprocessedwithtwelvetwo-dimensionalmatched fil-ters,eachoneadaptedtoaspecificdirection;thehighestfiltering outputforavesselpointdefinesthedirectionofthevesselatthat point.
Theentropymapisdeterminedbasedonthenormalized his-togramofvesseldirectionsinawindowcenteredoneachimage point.Foreveryvesselpixelinsidethiswindow,twodirectionsare considered:anabsolutedirection,takenfromthevesseldirection map,andarelativedirectionwhichisthedirectionofthevector thatlinksthevesselpixeltothewindowcenter.Thehistogramof vesseldirectionsonlyretainsinformationforthosevesselpoints whoseabsoluteandrelativedirectionsarecoincident.
Fig.1showstwooriginalretinalimages,theirsegmented vas-cularnetworksandthecorrespondingentropymaps.Ascanbe observed,entropyvaluesclearlyincreasenearandinsidevessels andinparticularintheODregion.
Tocalculatetheentropyateachimagepoint,ahistogramof ves-seldirectionsneedstobedeterminedinawindowcenteredatthat point.Thesizeofthiswindowshouldbelargeenoughtocapturethe diversityofvesseldistributionaroundthepoint,andsmallenough tokeepprocessingtimelow.In[18]awindowsizeof351×151
pixelswassetfortheimagesoftheDRIVEandSTAREdatabases. Inthemethodhereindescribed,theimagesareinitiallyreducedto halfineachdimensionandthewindowforentropycalculationis decreasedaccordinglyto[175×75]pixels.Inbothcases,
A.M.Mendonc¸aetal./ComputerizedMedicalImagingandGraphics37 (2013) 409–417 411
Fig.2.(a)Originalretinalimage;(b)segmentedvascularnetwork;(c)entropymapcalculatedusingfullresolutionimages;(d)entropymapcalculatedusinglowresolution images.
tendtospreadmainlyintheverticaldirectionbeforeformingthe twomainvesselarcadesaroundthemacula.Asaresult,theentropy valuesontheserectangularwindowsaremoreselectivethanthose obtainedusingsquareneighborhoods.Moreover,anincreased dis-criminationbetweentheODareaandotherretinalregionswhere relevantconcentrationsofvesselsoccurisachieved.
Entropymapsforboththeoriginalretinalimageandits size-reduced version are presented in Fig. 2. As can be observed, nooverallsignificantdifferencescanbefoundbetweenthetwo entropymaps,althoughamoredetailedanalysisoflocal distribu-tionofvaluescanrevealsharperlocalmaximaforthefullresolution image. Despite this, in good quality images thelow resolution entropyvalueshavenoinfluenceonthefinalcalculatedOD posi-tion.
2.3. InitialestimationofODlocation
Thedirectcalculationoftheabsolutemaximumofentropyis sufficientforestimatingtheODlocationinmostretinalimages. However,whenthevesselsaroundthediscarenotwellsegmented, mainlyduetopoorimagequalityorpathologicalconditions,the entropymapcontainsseverallocalmaximaandthesimple detec-tionofthelargestvaluemaynotbeabletoidentifythecorrect ODlocation.Inordertorestricttheareasinwhichthelocal maxi-mumofentropyissearchedfor,brightintensity,whichisanother characteristicfeatureofanormalOD,istakenintoaccount.
AstheODisusuallyayellowishbrightregioninanormalimage oftheretina,anddoesnotcontainimportantcontentsintheblue channel,wederiveanimagefromthered(R)andgreen(G) com-ponentsfromtheoriginalRGBimage,using(2).Inthisimage,I,a
pixelvalueisrepresentedastheEuclideandistance,intheRGplane, fromtheoriginofthecolorcoordinatesystem.
I(x,y)=
R(x,y)2+G(x,y)2 (2)
Aimingatreducingtheinfluenceofthevesselsinthesubsequent selectionofcandidateregions,theimageisprocessedwitha clos-ingmorphologicaloperatorusingastructuringelementadapted tovesselsize.Thisimageisafterwardssubmittedtoillumination equalization,asdescribedbyEq.(3),whereIW(x,y)isthe
aver-ageintensityofpixelsinsideawindowWcenteredonthespatial coordinates(x,y).
Ieq(x,y)=I(x,y)+0.5−IW(x,y) (3)
Eq. (3) performs an intensity rescaling operation aiming at obtaininganimagewithaspecifiedaveragevalueequalto0.5, whichcorrespondstothecentralvalueinthe[0–1]rangeusedfor representingintensities.
Toselectaninitialsetofcandidateareasonly10%ofthehighest intensitypointsofimageIeqarekept.Asthenumberofregionsis
stilllarge,animage-dependentthresholdiscalculatedandapplied toobtainthefinalsetofcandidateareaswhereinthemaximum valueofentropywillbesearchedfor,andthenusedforobtaining theODposition.Thethresholdvalue,T,iscalculatedbasedonthe mean,mmax,andstandarddeviation,smax,ofintensitymaximain
theconnectedregionsoftheinitialset,asestablishedin(4).These intensitymaximaaretakenfromthegreencomponentofthe orig-inalRGBimageafterilluminationequalization(Geq).Thisimage
isusedinsteadofIeqforthresholdestimationbecauseofitshigher
412 A.M.Mendonc¸aetal./ComputerizedMedicalImagingandGraphics37 (2013) 409–417
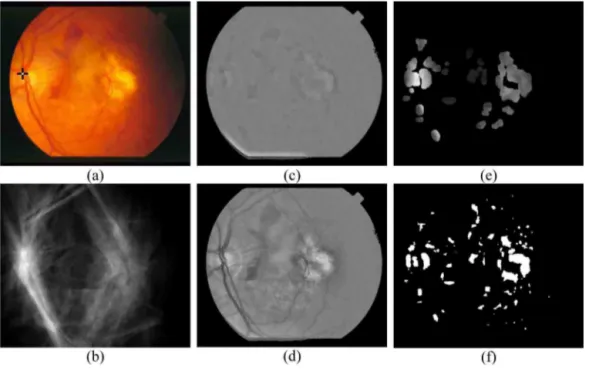
Fig.3. (a)OriginalimageshowingtheestimatedODlocation(blackcross)andabsolutemaximumofentropy(whitedot);(b)lowresolutionentropymap;(c)Ieq;(d)Geq; (e)intensitysegmentedimage;(f)finalsetofsegmentsafterdilationwiththevaluesofentropyoverlapped.
Thresholdedareasaredilatedusingastructuringelementadapted tovesselcaliber;thiswideningoperationisparticularlyimportant neartheODasthevesselshavehighvaluesofentropyandarenot includedinthesetofcandidateareasduetotheirlowintensity val-ues.Finally,thepointwiththemaximumvalueofentropyissetas theinitialestimationofODlocation.
T=
mmax ifsmax>0.1mmax mmax+2smax allothercases
(4)
Finalandintermediateresultsoftheprocessingsequencefor attaininganinitialODpositionareillustratedinFig.3.Fig.3ashows theoriginalimagewiththeestimatedODposition(blackcross);in thisimage,theabsolutemaximumofentropy(whitedot)is coin-cidentwiththeestimatedODlocation.Fig.3b–dpresentthelow resolutionentropymap,Ieq,andGeq,respectively.Finally,theinitial
andfinalsetsofcandidatesobtainedfromtheintensity-segmented imageareshowninFig.3eandf;inthislastimage,thevaluesof entropyforeachselectedimagepixelarealsodepicted.
2.4. ValidationofestimatedODlocation
Theevaluationofthemaximumoftheentropyprovedableto locatetheODinthegreatmajority ofretinalimages.However, whenthevascularstructureneartheODisnotentirelyvisibleor isaffectedbysomepathology,thesearchfortheabsolute maxi-mumofthemeasuremaybeinsufficientforreachingasuitablefinal result.Nevertheless,inmostsituationsthesearchforthemaximal valueofentropy,combinedwiththeoccurrenceofhighintensities, isadequateforachievingacorrectODlocation.
Inafewsituations,especiallywhenthequalityoftheretinal imageislow(mainlyduetoproblemsinimageacquisition),the segmentedvasculaturearoundthedisciseitherinaccurateor sim-plymissing,andtheestimatedpositionoftheODasdescribedin theprevioussubsectiondoesnothittheopticdisc.Inothercases, theexistenceofveryintensepathologicallesionsnearthevessels mayintroduceerroneoussegmentsinthevasculartreeand mis-leadtheODestimationalgorithm.Anotherproblemisthattheuse oflowresolutionimagesforentropycalculationcangiverisetothe
existenceofseverallocalmaximawithsimilarvaluesindistinct imagepositions,which,injustafewcases,canpreventthe abso-lutemaximumofentropyfrombeingassociatedwiththeactualOD location.
Inordertocopewiththeselimitations,avalidation phaseis included.Forthispurpose,thefollowingpropertiesareevaluated onthelowresolutionentropymap:(i)theabsolutemaximumof entropy;(ii)therelationoftheentropyvaluefortheestimatedOD positiontotheabsolutemaximumofentropy;(iii)thepresenceof otherlocalmaximawhosevaluesaresimilartotheentropyvalue oftheestimatedODposition.
Theabsolutemaximumofentropyprovedaneffectivemeasure forassessingthequalityofthevascularsegmentation,withlow values ofthis indicatorgenerally associatedwithunreliableOD estimation.Ontheotherhand,whentheabsolutemaximumvalue ishigh, theentropyvaluefortheestimatedODpositionshould notbebelowanimage-dependentthresholdvalue(setas60%of theimageabsolutemaximum),topreventsituationswherethe intensitycriterionmostlydeterminestheselectedODlocation.
A.M.Mendonc¸aetal./ComputerizedMedicalImagingandGraphics37 (2013) 409–417 413
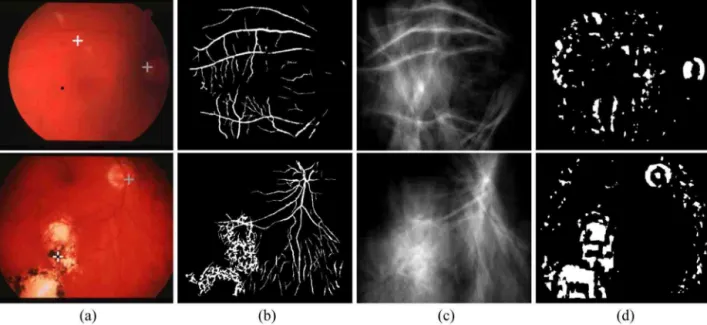
Fig.4. Resultsofvalidationphase.(a)Originalimagesshowingtheabsolutemaximumofentropy(blackdot),theinitialODpositionestimation(whitecross)andtheresult ofnewODlocationestimationresultingfromthevalidationphase(graycross);(b)segmentedvascularnetworks;(c)entropymaps;(d)selectedsetofintensitycandidates.
theabsolutemaximumofentropyobtainedinthefirstphasewas belowthespecifiedthresholdandwasconsideredunreliable;the exampledepictedinthebottomrowpresentsanimageshowing severalhighentropymaxima,wheretherecalculationofOD posi-tionusingthefullresolutionimagesallowedacorrectsolutionin thevalidationphase.
2.5. RefinementofODlocation
Thefinalphaseoftheproposedmethodologyaimsatrefining thediscpositionpreviouslyestimated.Thisfinalpost-processing phaseisappliedonarestrictedcircularregioncenteredonthe esti-matedODpositionwithdiameterequalto1.5timestheexpected discdiameter.Theunderlyingideaisthattheregionofthedisccan bereconstructedifthevessel-andintensity-segmentedimagesare addedtogether.Anewvalue,combiningentropyandintensityby theirgeometricmean,isassignedtoeachpixelofthisnewimage. Theweightedcentroidofthecircularregioncenteredonthe previ-ouslyestimatedODlocationisconsideredthefinalpositionofthe opticdisccenter.
TheprocessforobtainingthefinalODpositionisillustratedin
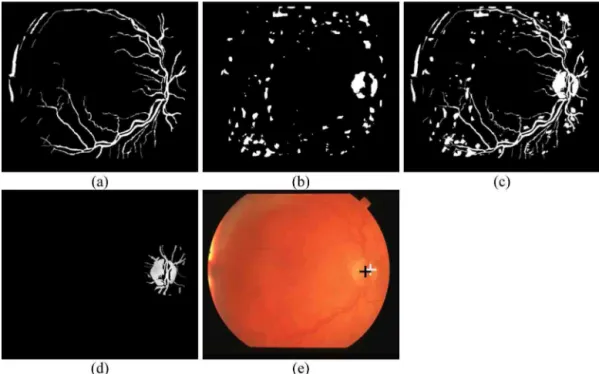
Fig.5.Thesegmentedvasculature(Fig.5a)andthesetofintensity candidates(Fig.5b)arecombinedtogettheimagepresentedin
Fig.5c.ThecircularrestrictedareacenteredontheestimatedOD location,witheachpixelweightedbythecombinationofentropy andintensityvalues,isshowninFig.5d.Finally,Fig.5eshowsthe originalimagewiththeODpositionsbefore(whitecross)andafter (blackcross)therefinementstep.
3. Results
ThemethodologyforODlocalizationwasevaluatedusingthe imagesoffourpubliclyavailabledatabases,DRIVE[19],STARE[20], MESSIDOR[21],andINSPIRE-AVR[22].TheDRIVEdatabaseconsists of40colorimagesoftheretina(565×584,24bits),where33do
notshowsignsofpathology.NoinformationregardingODposition ispubliclyavailableforthisdataset.
TheSTAREdatabasecontains81eyefundusimages(700×605,
24bits)thatwereinitiallyselectedbyHooveretal.[11]for eval-uatingtheirmethodforODlocalization.Thisdatasetconsistsof 31imagesofnormalretinas,and50imagesshowingsomekind of pathology. The MESSIDOR database consistsof 1200 images
groupedintothreesubsetsfromdifferentophthalmologic depart-ments.Thisdatasetcontainsimageswithdistinctsizes(980×1440,
1488×2240,1536×2304,24bits).Allimageswereacquiredusing
anon-mydriaticretinographwitha45◦fieldofview,800withand
400withoutpupildilation.Thelastsetofimagesisformedfrom the40imagesofthetestsetoftheINSPIRE-AVRdatabase.These highresolutionimages(2048×2392,24bits)arecenteredonthe
discandwereacquiredwitha30◦fieldofview.
Theentropymapsusedinthefirstphaseofthemethodwere obtainedbasedonvesseldirectionhistogramscalculatedona rect-angularwindowof175×75pixelscenteredineachimagepixel.
TheimagesoftheMESSIDORandINSPIRE-AVRdatasetswere ini-tiallydownsizedtodimensionssimilartotheDRIVEandSTARE images(usingscalefactorsof1/1.5and1/2.5forMESSIDOR,and 1/4forINSPIRE).Beforecomputationofentropy,allimageswere onceagainreducedbyhalfineachdimension.Although computa-tiontimeisstillslightlydependentontheoriginalsizeoftheimage, assomeoftheoperationsareperformedusingthefullimagesize(or thesizethatresultsfromthefirstscalingstepfortheMessidorand Inspire-AVRdatabases),areductionof1/12intheprocessingtime wasingeneralachievedforalldatabases.Forinstance,inDRIVE imagesthetimerequiredtoprocessfullresolutionimages(about 90s)wasreducedtoanaveragevalueof8s.
Theparametervaluesthatrequiredadaptationtoeachspecific datasetinthepreviousmethod[18]arenowfixedandidenticalfor alldatabases.Theproposedapproachonlydependsontwo param-eters:oneisthescalingfactorjustmentioned,andtheotheristhe lowerlimitfortheabsolutemaximumofentropy,whichisusedto decidewhethertheentropymapisorisnotreliableforODlocation, asexplainedinSection2.4.Whilethevalueofthescaling parame-terisautomaticallyderivedfromtheoriginalimagesize,thelimit forentropyisobtainedfromtheaverageandstandarddeviation oftheentropymaximaforeachdataset.Identicallimitswereused foralldatabasesexceptMESSIDOR,asentropyvaluesforthisset areslightlysmaller,because,onaverage,thenumberofsegmented vesselpixelsinthedownscaledimagesislower.
414 A.M.Mendonc¸aetal./ComputerizedMedicalImagingandGraphics37 (2013) 409–417
Fig.5.(a)Vesselsegmentedimage;(b)intensitycandidates;(c)combinationof(a)and(b);(d)circularregionaroundestimatedOD;(e)originalretinalimagewithfinal (blackcross)andestimated(whitecross)ODpositions.
180pixelsasestablishedin[25].Duetothevariabilityofthe MESSI-DORimages,thedefinitionofonesinglecriterionfordiscdiameter isnotpossible,soadetectedpositionwasconsideredvalidifitwas insidetheOD;theseresultswereassessedbytheauthorsunderthe guidanceofanexpert.
Theresultsobtainedforthefourdatabasesaresummarizedin
Table1.ThenumbersofsuccessfulODdetectionswiththe pro-posedmethodareshowninthethirdcolumnofthistable.Inorder toclarifytheinfluenceonOD detectionofthe twomain crite-ria(entropyandintensity)whicharecombinedintheproposed methodology,wehaveappliedeachcriterionseparately,andwe haveconsideredasODpositiontheimagelocationwherethe max-imumvaluefor thecriterionis achieved.Thetwo lastcolumns ofthetablecontainthenumberof successfuldetectionswhere theOD location was associated withthe position of the abso-lutemaximumofentropy(fourthcolumn)andwiththeabsolute
maximumofintensity(fifthcolumn).Fromtheanalysisofthe val-uesinTable1,wecanconcludethatbothentropyandintensity areusefulfeaturesfor ODlocation; however,thesefeaturesare sensitivetoimagequalityand totheoccurrenceofpathological conditions,whichhaveasignificantinfluenceontheperformance of discdetection.Nevertheless, thecombination of information frombothfeaturesimprovestherobustnessofODlocalization,as clearlydemonstratedbytheresultsobtainedusingtheproposed methodology.
Table2detailstheresultsofthecombinationofentropyand intensity,byindicatingthenumberofimageswheretheODhas beensuccessfullylocatedineachphaseofthealgorithm.Besides thetotalnumberofcorrectlydetectedODpositions,ineachroware presentedthenumberofimageswherethefinalODlocation corre-spondstotheinitialestimation,andthecorrectODlocationsthat wereaccomplishedinthevalidationphase,eitherbythemaximum
Table1
Resultsoftheproposedmethodcomparedwiththestand-alonedetectionbasedonthemaximumofentropyandthemaximumofintensity.
Database Numberof
images
Number(percentage)of successfulODlocations
Absolutemaximumof entropy(reduced resolutionimages)
Absolute maximumof intensity
DRIVE 40 40(100%) 39 37
STARE 81 80(98.8%) 63 58
MESSIDOR 1200 1197(99.8%) 1192 1155
INSPIRE-AVR 40 40(100%) 40 38
Table2
CriteriaforODlocalization.
Database Numberof
successfulOD locations
Initial estimation
Validation
Maximumofentropyin intensitycandidates(reduced resolutionimages)
Maximumofentropyin intensitycandidates
Maximumofintensityin largestareasegment
DRIVE 40 40 0 0
STARE 80 74 1 5
MESSIDOR 1197 1193 3 1
A.M.Mendonc¸aetal./ComputerizedMedicalImagingandGraphics37 (2013) 409–417 415
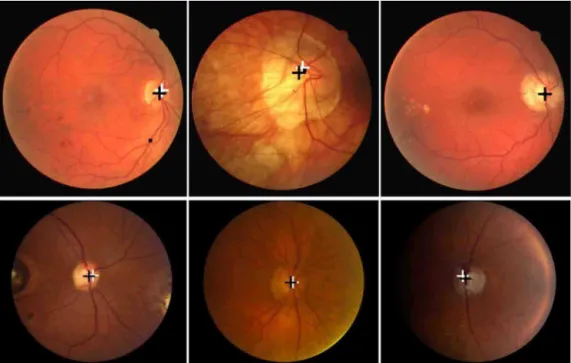
Fig.6.Sixoriginalimageswiththeinitialestimationafterthefirstphaseofthealgorithm(whitecross)andthefinalODlocation(blackcross).Imagesonthetoproware fromDRIVEdatabasewhilethebottomrowshowsimagesfromtheINSPIRE-AVRdatabase.
valueofentropycalculatedontheoriginalimages(followingthe detectionofseverallocalmaximaofentropy)orbythemaximum valueofintensityinthelargestsegment(whentheentropyvalues werenotreliable).
Table3comparestheresultsofourmethodwiththe perfor-manceofothersolutionsreportedintheliteratureforthesame datasets.
Fig.6showssomeresultsfortheDRIVE(toprow)and INSPIRE-AVR(bottomrow)images.Inthetoprow,wecanobserveontheleft thesinglecasewheretheabsolutemaximumofentropywasnot associatedwiththeODlocation,whileinthecenterispresented thesingleimagewheretheintensitymaximumdidnotbelongto theOD;inbothcases,theproposedmethodwasabletoachievea
correctsolution.Finally,intherightmostimagetheabsolute max-imumofentropyiscoincidentwiththefinalODlocation.Thetwo leftmostimagesinthebottomrowofFig.6aretheINSPIRE-AVR imageswherethehighestintensitypixelsdonotcoincidewiththe disc.Inalltheseimagestheblackdotmarksthepositionofthe absolutemaximumofentropy,andthewhiteandblackcrossesare theinitialandfinalODpositions,respectively.
Fig.7presentstheresultsofODlocalizationinsixSTAREimages. Thetop-leftimageistheonlyimagewherethealgorithmfailedOD localization.Fig.7(b)and(c)showtwoimageswheretheinitial esti-mation(firstphase)gotawrongsolution,butacorrectpositionwas achievedinthesecondphasewherethefinalODpositionis asso-ciatedwithtothecentroidofthelargestsegmentintheintensity
416 A.M.Mendonc¸aetal./ComputerizedMedicalImagingandGraphics37 (2013) 409–417
Fig.8.OriginalMESSIDORimageswiththefinalODlocation(blackcross),theinitialestimationafterthefirstphaseofthealgorithm(whitecross),theresultafterthesecond phase(graycross),whenapplicable,andtheabsolutemaximumofentropy(blackdot).ThetoprowcontainsthethreeimageswherethemethodfailedtodetecttheOD location,whilethebottomrowshowssuccessfulresults.
Table3
PerformanceofmethodsforODlocalization.
Method Database Percentageof
correctOD locations
Proposedmethod DRIVE 100%
STARE 98.8%
MESSIDOR 99.8%
Hoover[11] STARE 89.0%
Foracchia[12] STARE 97.5%
Haar[13] STARE 93.8%
Perez-Rovira[16] STARE 91.4%
Youssif[14] DRIVE 100%
STARE 98.8%
Lu[6] STARE 98.8%
MESSIDOR 99.8%
segmentedimage.AsuccessfulestimationofODpositionusinglow resolutionimageswasobtainedforeachoneofthethreeimagesin thebottomrowofFig.7.
ThethreeimagesoftheMESSIDORdatabasewheretheproposed algorithmfailedatlocalizingtheODaredepictedinthetoprowof
Fig.8.Fortheimagesontheleftandcenter,theabsolutemaximum ofentropyisinsidethedisc,butthediscareawasnotincludedin theintensityimage;thelargestareacandidatewasselectedinthe leftmostimage,whileintheimageshowninthecentertheinitial ODposition(whitecross)wasrefinedbutcouldnotreachthedisc. Inthethirdimage,afinalpositionneartheborderoftheODwas finallyselected.
4. Conclusions
AmethodologyforautomatingthelocalizationoftheODincolor imagesoftheretinawasdescribed,basedonthecombinationof vascularandintensityinformation.Thenewmeasureofentropyof vasculardirectionsprovedtobeagoodsolutionforassessingvessel
convergence,whichisonemajorfeatureoftheopticdiscregionin aretinalimage.Althoughformostnormalandpathologicalimages thesimpledetectionoftheabsolutemaximumofentropyis suffi-cientforcorrectlylocalizingtheOD,therobustnessofthemethod wasincreasedbyincludingadditionalintensityconstraints.
Theperformanceofthemethodhereindescribedwasgreatly improvedbythedeterminationofaninitialODpositionusinga lowresolutionentropymap,andfurtherbytheinclusionofa sub-sequentvalidationphasewhereanalternativesolutionissearched forifthecalculatedentropyvaluesarenotconsideredreliable.A significantreductionincomputationtime,andtheattainmentofa usefulODlocalizationeveninimageswhereeitherthedisc inten-sitycontrastorthequalityofthesegmentedvasculatureislow, arethemostrelevantimprovements.Theinclusionofarefinement phasealsoallowedafinalpositionthatingeneralisnearertothe idealODcenter.
Themethodwasevaluatedusingimagesfromfourdatabases withverypromisingresults,outperformingmostofthe previously-knownsolutions.TheODlocationobtainedwiththisautomatic approachwillbeusedasaninitialstepforthecomplete segmen-tationofthediscarea.
Acknowledgment
Wewanttothanktheauthorsofthefourpublicdatabasesfor makingtheirimagesavailableThisworkwassupportedbyFEDER fundsthroughtheProgramaOperacionalFactoresde Competitivi-dade-COMPETEandbyPortuguesefundsthroughFCT-Fundac¸ão paraaCiênciaeaTecnologiaintheframeworkoftheproject PEst-C/SAU/LA0002/2011.
References
A.M.Mendonc¸aetal./ComputerizedMedicalImagingandGraphics37 (2013) 409–417 417
[2]CouperDJ,KleinR,HubbardLD,WongTY,SorlieP,CooperLS,etal.Reliability ofretinalphotographyintheassessmentofretinalmicrovascular charac-teristics:Theatherosclerosisriskincommunitiesstudy.AmJOphthalmol 2002;133(1):78–88.
[3]SinthanayothinC,BoyceJF,CookHL,WilliamsonTH.Automatedlocalization oftheopticdisc,fovea,andretinalbloodvesselsfromdigitalcolourfundus images.BrJOphthalmol1999;83:902–10.
[4]AquinoA,Gegúndez-AriasME,MarinD.Detectingtheopticdiscboundaryin digitalfundusimagesusingmorphological,edgedetectionandfeature extrac-tiontechniques.IEEETransMedImagingNov2010;29(11):1860–9. [5]AquinoA,Gegúndez-AriasME,MarinD.Automatedopticdiscdetectionin
reti-nalimagesofpatientswithdiabeticretinopathyandriskofmacularedema.Int JBiolLifeSci2012;8(2):87–92.
[6]LuS.Accurateandefficientopticdiscdetectionandsegmentationbyacircular transform.IEEETransMedImaging2011;30(12):2126–33.
[7]LalondeM,BeaulieuM,GagnonL.Fastandrobustopticdiscdetectionusing pyramidaldecompositionandHausdorff-basedtemplatematching.IEEETrans MedImagingNov2001;20(11):1193–200.
[8]OsarehA,MirmehdiM,ThomasB,MrkhamR.Classificationandlocalisationof diabetic-relatedeyedisease.In:HeydenA,etal.,editors.ECCV2002. Heidel-berg:Springer;2002.p.502–16.
[9]LowellJ,HunterA,SteelD,BasuA,RyderR,FletcherE,etal.Opticnervehead segmentation.IEEETransMedImaging2004;23(February(2)):256–64. [10]Abdel-GhafarRA,MorrisT.Progresstowardsautomateddetectionand
charac-terizationoftheopticdiscinglaucomaanddiabeticretinopathy.MedInform InternetMed2007;32(1):19–25.
[11]HooverA,GlodbaumM.Locatingtheopticnerveinaretinalimageusing the fuzzy convergence of the blood vessels. IEEE Trans Med Imaging 2003;22(August(8)):951–8.
[12]ForacchiaM,GrisanE,RuggeriA.Detectionofopticdiscinretinalimagesby meansofageometricalmodelofvesselstructure.IEEETransMedImaging 2004;23(October(10)):1189–95.
[13]HaarF.Automaticlocalizationoftheopticdiscindigitalcolourimagesofthe humanretina.UniversityofUtrecht;2005[M.Scthesis].
[14]YoussifA,GhalwashAZ,GhoneimA.Opticdiscdetectionfromnormalized dig-italfundusimagesbymeansofavessels’directionmatchedfilter.IEEETrans MedImaging2008;27(January(1)):11–8.
[15]NiemeijerM,AbràmoffMD,vanGinnekenB.Fastdetectionoftheopticdisc andfoveaincolorfundusphotographs.MedImageAnal2009;13:859–70. [16]Perez-RoviraA,TruccoE.Robustopticdisclocationviacombinationofweak
detectors. In:30th AnnualInternational IEEEEMBS Conference.2008. p. 3542–5.
[17]XuX,GravinMK,AbràmoffMD,ReinhardtJM.Simultaneousautomatic detec-tionoftheopticdiscandfoveaonfundusphotographs.In:DawantBM,Haynor DR,editors.Proc.SPIEmedicalimaging2011:imageprocessing,vol.7962.2011. p.7962T.
[18]Mendonc¸aA,CardosoF,SousaA,CampilhoA.Automaticlocalizationofthe opticdiscinretinalimagesbasedontheentropyofvasculardirections.In: Imageanalysisandrecognition;2012.p.424–31[LNCS7325].
[19]ImageScienceInst.,http://www.isi.uu.nl/Research/Databases/DRIVE
[20]TheSTAREproject,http://www.ces.clemson.edu/∼ahoover/stare [21]MESSIDORproject,http://messidor.crihan.fr/
[22]NiemeijerM,XuX,DumitrescuA,GuptaP,vanGinnekenB,FolkJ,etal. Auto-matedmeasurementofthearteriolar-to-venularwidthratioindigitalcolor fundusphotographs.IEEETransMedImaging2011;30(November(11)). [23]Mendonc¸aAM,CampilhoAC.Segmentationofretinalbloodvesselsby
combin-ingthedetectionofcenterlinesandmorphologicalreconstruction.IEEETrans MedImaging2006;25(September(9)):1200–13.
[24]ChaudhuriS,ChattererjeeS,KatzN,GlodbaumM.Detectionofbloodvesselsin retinalimagesusingtwo-dimensionalmatchedfilters.IEEETransMedImaging 1989;8(March(3)):263–9[datasetsII,ICML,Washington].
[25]Niemeijer M, Xu X, Dumitrescu A, Gupta P, van Ginneken B, Folk J, etal. Automatedmeasurementofthearteriolar-to-venularwidthratioin digital color fundusphotographs. IEEETrans Med Imaging 2011;30(11): 1941–50.
AnaMariaMendonc¸areceivedthePh.D.degreeinElectricalEngineeringfromthe FacultyofEngineering,UniversityofPorto(FEUP)in1994.Currently,sheisAssociate ProfessorattheDepartmentofElectricalandComputerEngineeringattheFacultyof Engineering,UniversityofPorto,Portugal.ShejoinedINEB–InstituteforBiomedical Engineering–in1989,whereshehasbeenaresearcheroftheBioimagingGroup. Herresearchinterestsincludeimageprocessingandanalysis,and,morespecifically, medicalimageanalysis.
AntónioV.SousareceivedthePh.D.degreeinEngineeringSciencesfromtheFaculty ofEngineering,UniversityofPorto(FEUP)in2008.Presently,heisAdjoinedProfessor attheDepartmentofMathematicsofISEP,PolytechnicInstituteofPorto,Portugal. HeisaresearcheroftheBioimagingGroupofINEB.Hisresearchinterestsinclude imageprocessingandclassification.
LuísMendonc¸aisaboardcertifiedophthalmologistfromtheHospitaldeBraga (Braga,Portugal).HereceivedhisMDdegree(1999–2005)fromtheFacultyof MedicineoftheUniversityofPortoandcompletedhisophthalmologyresidency (2007–2010)attheDepartmentofOphthalmologyofHospitalSãoJoão(Porto, Portugal).HeattendedaRetinalResearchFellowship(2010–2011)atLuEstherT. MertzRetinalResearchCentre/VitreousRetinaMaculaConsultantsofNewYork (NewYork,NY,USA)andhasclinicalandresearchinterestinretinalandchoroidal disorderssuchasdiabeticretinopathy,age-relatedmaculardegenerationandretinal vascularocclusions.