ACPD
11, 20667–20712, 2011Continental outflow and atmospheric
chemistry
B. Srinivas et al.
Title Page
Abstract Introduction
Conclusions References
Tables Figures
◭ ◮
◭ ◮
Back Close
Full Screen / Esc
Printer-friendly Version Interactive Discussion
Discussion
P
a
per
|
Dis
cussion
P
a
per
|
Discussion
P
a
per
|
Discussio
n
P
a
per
|
Atmos. Chem. Phys. Discuss., 11, 20667–20712, 2011 www.atmos-chem-phys-discuss.net/11/20667/2011/ doi:10.5194/acpd-11-20667-2011
© Author(s) 2011. CC Attribution 3.0 License.
Atmospheric Chemistry and Physics Discussions
This discussion paper is/has been under review for the journal Atmospheric Chemistry and Physics (ACP). Please refer to the corresponding final paper in ACP if available.
Impact of continental outflow on
chemistry of atmospheric aerosols over
tropical Bay of Bengal
B. Srinivas, A. Kumar, M. M. Sarin, and A. K. Sudheer
Physical Research Laboratory, Navarangapura, Ahmedabad 380 009, India
Received: 4 May 2011 – Accepted: 7 July 2011 – Published: 20 July 2011
Correspondence to: M. M. Sarin (sarin@prl.res.in)
ACPD
11, 20667–20712, 2011Continental outflow and atmospheric
chemistry
B. Srinivas et al.
Title Page
Abstract Introduction
Conclusions References
Tables Figures
◭ ◮
◭ ◮
Back Close
Full Screen / Esc
Printer-friendly Version Interactive Discussion
Discussion
P
a
per
|
Dis
cussion
P
a
per
|
Discussion
P
a
per
|
Discussio
n
P
a
per
|
Abstract
The continental outflow from Indo-Gangetic Plain and south-east Asia dominates the widespread dispersal of pollutants over tropical Bay of Bengal (BoB) during the late NE-monsoon (January–March). It is thus pertinent to assess the impact on marine atmospheric boundary layer of BoB. The chemical data, based on analyses of size-5
segregated (PM2.5 and PM10) aerosols, suggest the dominance of nss-SO24− (range:
1.3 to 28 µg m−3) in PM2.5. Almost all SO24− is of anthropogenic origin and accounts
for as much as 65 % of the water-soluble inorganic constituents. The impact of anthro-pogenic sources is further evident from the widespread depletion of chloride (range: 40 to 100 %) compared to sea-salt composition. The carbonaceous species (EC and 10
OC) contribute nearly 25 % to PM2.5; and significant linear relationship with K+ sug-gests biomass burning as their dominant source (biofuels and agricultural waste). The enhancement in the fractional solubility of aerosol Fe, as assessed in PM2.5,
re-emphasizes the impact of combustion sources (biomass and fossil-fuel) and chemical processing (of dust) during the long-range transport. The high enrichment factors of 15
heavy metals (Pb and Cd) further demonstrate the influence of pollution sources on the chemistry of MABL. The downwind transport of pollutants and exchange across air-sea interface can, thus, have profound impact on the ocean surface biogeochemistry.
1 Introduction
Suspended particulate matter (SPM), ubiquitous in the Earth’s atmosphere, has poten-20
tial to perturb radiation budget of the atmosphere directly by scattering and absorbing the incoming solar radiation or indirectly by acting as cloud condensation nuclei (CCN) (Twomey, 1977; Charlson et al., 1991; Ramanathan et al., 2001a, b). In addition, SPM provide the substrate for various chemical reactions occurring in the atmosphere which result in the change in surface properties (hydrophobic to hydrophilic) and eventually 25
ACPD
11, 20667–20712, 2011Continental outflow and atmospheric
chemistry
B. Srinivas et al.
Title Page
Abstract Introduction
Conclusions References
Tables Figures
◭ ◮
◭ ◮
Back Close
Full Screen / Esc
Printer-friendly Version Interactive Discussion
Discussion
P
a
per
|
Dis
cussion
P
a
per
|
Discussion
P
a
per
|
Discussio
n
P
a
per
|
et al., 1996; Andreae and Crutzen, 1997). All these factors lead to a large degree of uncertainty in the evaluation of climate change (Intergovernmental Panel on Climate Change (IPCC), 2001) which has been further constrained by having large number of real time measurements of chemical and physical properties of aerosols in different environments (e.g. marine, urban, remote) (IPCC, 2007).
5
The densely populated south Asian region is undergoing rapid industrialization leading to enhanced emission of a variety of air pollutants including anthropogenic aerosols making this region climatically sensitive in the global perspective (Lawrence and Lelieveld, 2010, and references therein). The dominance of anthropogenic sources over Indo-gangetic Plain, during wintertime have been confirmed based on several field 10
experiments in recent years (Ram et al., 2010; Rengarajan et al., 2007; Ram and Sarin, 2010; Tare et al., 2006) as well as their significant impact on the radiative forcing (Ra-machandran et al., 2006; Nair et al., 2007). The long-range transport of continental aerosols from natural and anthropogenic sources to the remote marine environment has been recognized as a major source for many bio-geochemically important trace 15
metals and nutrients to the oceanic regions (Martin, 1989; Jickells et al., 2005; Duce et al., 1991, 2008; Jickells, 1999; Arimoto et al., 2003; Duce, 1986; Prospero, 1981a). These nutrients may perturb the phytoplankton productivity and subsequently impact on climate (Spokes et al., 2000; Jickells et al., 2005; Mahowald et al., 2005; Doney et al., 2007).
20
The Bay of Bengal (BoB; situated in the eastern part of northern Indian Ocean) is one of the ideal region, confined by land from three side, to study the impact of continen-tal aerosols transported to the marine environment. This region is largely affected by the winds originating from north/north-eastern region of Indian subcontinent as well as from south-east Asian countries (Burma, Thailand, Bangladesh and China) during the 25
ACPD
11, 20667–20712, 2011Continental outflow and atmospheric
chemistry
B. Srinivas et al.
Title Page
Abstract Introduction
Conclusions References
Tables Figures
◭ ◮
◭ ◮
Back Close
Full Screen / Esc
Printer-friendly Version Interactive Discussion
Discussion
P
a
per
|
Dis
cussion
P
a
per
|
Discussion
P
a
per
|
Discussio
n
P
a
per
|
Kumar et al., 2010; Ganguly et al., 2005; Moorthy et al., 2008, 2010). One of the previous studies, during the spring inter-monsoon (March–April, 2006; (Kumar et al., 2008a) season, had shown that air flow influences both the abundance and composi-tion of the particulate matter over the BoB using the chemical characteristics of bulk (TSP) aerosols. Till date, this is the first study undertaken, to quantify the anthro-5
pogenic impact over the marine atmospheric boundary layer (MABL) of BoB based on the chemical composition of aerosols. The abundances and atmospheric reactivity of major pollutants (nitrate, sulphate, ammonia) and their removal processes depend critically on their size distribution (Song and Carmichael, 2001). Thus, one of the major limitations of current models relates to the lack of real-time data on size depen-10
dent chemical composition of atmospheric aerosols and the associated spatio-temporal variability. The measurements based on bulk-aerosols are inadequate to constrain the model scenario made in recent years. It is thus essential to have a comprehensive study on the size-dependent chemical composition of aerosols over this region.
In the present study, a cruise was undertaken in the Bay of Bengal during the na-15
tional programme “Integrated campaign of aerosols, trace gases and radiation budget-Winter” (ICARB-W) in the month of December–January, 2009. This study provides a comprehensive and unique data set for water-soluble constituents, crustal elements and carbonaceous species in PM2.5 and PM10 (particulate matter less than 2.5 and 10 µm aerodynamic diameter respectively) and provides evidences for continental in-20
fluence over the Bay of Bengal.
2 Experimental methods
2.1 Cruise track and meteorological conditions
Aerosol samples were collected over the Bay of Bengal (BoB), onboard ORV Sagar Kanya (SK254), during December–January, 2008–2009. The cruise (cruise track 25
ACPD
11, 20667–20712, 2011Continental outflow and atmospheric
chemistry
B. Srinivas et al.
Title Page
Abstract Introduction
Conclusions References
Tables Figures
◭ ◮
◭ ◮
Back Close
Full Screen / Esc
Printer-friendly Version Interactive Discussion
Discussion
P
a
per
|
Dis
cussion
P
a
per
|
Discussion
P
a
per
|
Discussio
n
P
a
per
|
30 January 2009 at Kochi, by making several transects between 4 to 22◦N and 76 to
98◦E and hence covering entire BoB. The dots along the cruise track show the position
of the ship at 05:30 UTC on each day. During first half (27 December to 10 January) of SK 254, prevailing winds were north-westerlies, i.e. winds are originating from north and north-eastern part of India as well as from Bangladesh. However, during later part 5
of cruise (11 to 28 January), a change in wind pattern is observed such that the typi-cal air mass originated over eastern Asian region e.g. Burma, Thailand and as far as from China. This pattern is evidenced from the average wind patterns observed over the study region as shown in Fig. 2a and b. The meteorological parameters such as wind speed, relative humidity, and air temperature were measured onboard at a height 10
of 15 m from the sea level on hourly basis. The relative humidity varied from 49.1 to 79.8 %, with mean of about 64.2 % during the campaign period. The measured winds were corrected for the ship’s motion and found in the range of 1.2 to 6.3 m s−1, whereas
surface-level pressure variations were recorded between 1007 to 1017 mb.
2.2 Aerosol sampling and analysis
15
The ambient aerosol in PM2.5and PM10size-range were collected onboard ORV Sagar Kanya, simultaneously by operating two high-volume samplers (Thermo Andersen); with sampling inlets having 50 % cutoffsize at 2.5 and 10 µm aerodynamic diameters. The samplers were set up on the upper deck, 15 m a.s.l., in front of ship’s navigation room. The hi-volume samplers (HVS) were equipped with volume flow controller to 20
maintain a constant flow rate. However, periodic calibration of samplers was performed to check on variation, if any, in the flow rate. Typically, the flow rate varied from 1.08– 1.18 m3min−1 with an uncertainty of 5 %. Each sample was collected over a time
period ranging from 20 to 22 h when ship was cruising at a speed ∼10 knots/hrs or above conforming to the protocol that the relative wind direction is from the bow, thus 25
ACPD
11, 20667–20712, 2011Continental outflow and atmospheric
chemistry
B. Srinivas et al.
Title Page
Abstract Introduction
Conclusions References
Tables Figures
◭ ◮
◭ ◮
Back Close
Full Screen / Esc
Printer-friendly Version Interactive Discussion
Discussion
P
a
per
|
Dis
cussion
P
a
per
|
Discussion
P
a
per
|
Discussio
n
P
a
per
|
A total of 33 (PM10) and 31 (PM2.5) samples were collected over a span of 35 days during the campaign over Bay of Bengal. After the sampling, filters were packed in zip-lock bags and preserved in the deep-freezer (at ca.−19◦C) during the cruise. Later,
these samples were brought to the laboratory and stored in a freezer until analysis. The mass concentrations of PM10and PM2.5samples were ascertained gravimetrically 5
by weighing the full filters (with a precision of 0.1 mg) before and after the sampling. Prior to their weighing, all filters were conditioned at a relative humidity of 40±5 % and temperature of 23±1◦C for 5–6 h.
Water soluble inorganic constituents (Na+, NH+4, K+, Mg2+, Ca2+, Cl−, NO−
3, and
SO24−) in the aerosols were determined using one fourth of the filter. The analytical 10
details related to ionic components measured during this study have been described in (Kumar et al., 2010; Kumar and Sarin, 2010). In brief, the anions (Cl−, NO−
3 and
SO2−
4 ) and cations (Na
+, NH+
4, K
+, Mg2+, and Ca2+) were analyzed on DIONEX®
Ion-Chromatograph equipped with suppressed conductivity detector (ED-50) (Kumar et al., 2010).
15
For trace metals (Cd and Pb) and crustal constituents (Al, Fe, Ca and Mg), ca. 1.0 cm diameter filter punches were digested using 0.5 mL distilled HF, 5.0 mL distilled 8 N HNO3 and 3.0 mL Milli-Q water (>18.2M-cm specific resistivity) in Teflon digestion vessels using a high pressure Microwave digestion system (Milestone). After digestion these solutions were made to suitable volume (25 mL) with Milli-Q water and stored in 20
pre cleaned polypropylene bottles. These solutions were subsequently analyzed for Al, Fe, Ca and Mg on Inductively Coupled Atomic Emission Spectrometer (ICP-AES, HORIBA, JobinYvon–ULTIMA model), as well as Cd and Pb on Graphite Furnace-Atomic Absorption Spectrophotometer (GF-AAS). Based on the repeat measurements of procedural blanks and repeat samples, the overall uncertainty in the measurement 25
of these metals is found to be less than±10%.
ACPD
11, 20667–20712, 2011Continental outflow and atmospheric
chemistry
B. Srinivas et al.
Title Page
Abstract Introduction
Conclusions References
Tables Figures
◭ ◮
◭ ◮
Back Close
Full Screen / Esc
Printer-friendly Version Interactive Discussion
Discussion
P
a
per
|
Dis
cussion
P
a
per
|
Discussion
P
a
per
|
Discussio
n
P
a
per
|
(Rengarajan et al., 2007; Sudheer and Sarin, 2008a; Ram et al., 2008). For water soluble iron (Fews), ca. 2.0 cm dia filter punches were extracted with 10.0mL of Milli-Q water (18.2MΩ-cm specific resistivity). This water extract is filtered using 0.45 µm PTFE syringe filter cartridge and acidified to pH∼2 with double distilled HNO3,
subse-quently measured on GF-AAS for soluble Fe. The details of the extraction procedure 5
are given in (Kumar et al., 2010).
3 Results and discussion
3.1 Air mass back trajectory analysis and mass concentrations of PM10 and
PM2.5
To identify the potential sources contributing to aerosol chemical composition over the 10
Bay of Bengal, 7-days air-mass back trajectories (AMBT) were computed by using NOAA Air Resource Laboratory HYSPLIT-Model (Draxler, 2002) (GADS data set) at different arrival heights (100 m, 500 m and 1000 m). The back-trajectory analyses sug-gest the dominance of air-masses transported from Indo-Gangetic Plains (IGP) during initial period (27 December 2008 to 10 January 2009). However, in the later part of 15
the cruise (i.e. in south Bay of Bengal), most of the air-masses were originating from south-east Asia. The air-masses observed in the Bay of Bengal during campaign pe-riod have been classified into three different categories as IGP (air masses originating from Indo Gangetic Plain) and SEA (air masses originating from South East Asian Countries) and MAP (air masses which are also originated from south east Asian 20
countries but spent more time in the Marine atmospheric boundary layer) (Kumar et al., 2010). Albeit, distinctions were made based on the air-mass back trajectories, it was observed that samples collected in the northern part of Bay of Bengal are mainly affected by the IGP and southern bay witnesses SEA and MAP. Based on the wind pat-terns (shown in Fig. 2), we have divided our data set into two groups, N-BoB (Samples 25
ACPD
11, 20667–20712, 2011Continental outflow and atmospheric
chemistry
B. Srinivas et al.
Title Page
Abstract Introduction
Conclusions References
Tables Figures
◭ ◮
◭ ◮
Back Close
Full Screen / Esc
Printer-friendly Version Interactive Discussion
Discussion
P
a
per
|
Dis
cussion
P
a
per
|
Discussion
P
a
per
|
Discussio
n
P
a
per
|
11 January–28 January) for documenting the spatial distribution of different aerosol components.
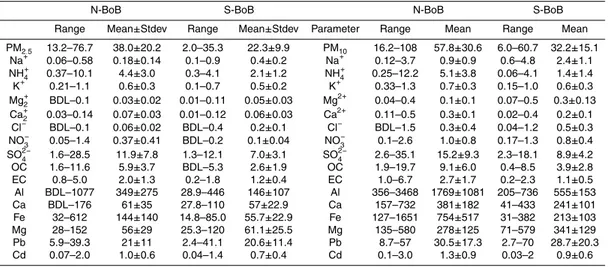
Table 1 gives the average mass concentration of PM10 and PM2.5 along with their maximum and minimum value during transects in N-BoB and S-BoB. The mass con-centrations of PM2.5 and PM10 exhibit a strong temporal variability, with higher value 5
in N-BoB (range: 13.2 to 76.7 and 16.2 to 108 µg m−3 respectively) compared to that in S-BoB (range: 2.0 to 35.3 and 6.0 to 60.7 µg m−3 respectively). High mass load-ing of PM10 and PM2.5 in N-BoB is mainly attributed to the proximity of sampling lo-cations near to continents associated with favourable continental outflow from Indian subcontinent during initial part of the cruise. However, the PM10 mass was found 2-10
3 times higher than the mass loading (total suspended particulate) observed during inter-monsoon period (March–April) in BoB (Kumar et al., 2008b). The average wind patterns observed during the campaign (Fig. 2a, b) were originating from continents compared to the mixed wind-pattern found (land to sea vis- `a-vis sea to land) during ICARB-2006 (Kumar et al., 2008b). A very significant correlation is observed between 15
PM2.5and PM10in N-BoB (r2=0.93; Fig. 3) as well as in S-BoB (r2=0.84; Fig. 3) indi-cating the similar sources (i.e. continental outflow) for fine and coarse mode aerosols. During the study period, the percent contribution of PM2.5mass to PM10 found to vary from 46 to 96 % (Av.=67 %) and 34 to 88 % (Av.=63 %) in N-BoB and S-BoB re-spectively. On an average, PM2.5 contributes significantly (∼65 % of PM10) to ambient
20
aerosol over Bay of Bengal. The studies based on optical properties of atmospheric aerosols, during ICARB-2006, have shown higher ˚Angstr ¨om exponent values (1.12) over the Bay of Bengal and indicated the predominance of fine mode aerosols (Kedia and Ramachandran, 2008; Moorthy et al., 2008).
3.2 Chemical composition of PM10 and PM2.5 25
The various components of ambient aerosol (PM10 and PM2.5) in Bay of Bengal,
ACPD
11, 20667–20712, 2011Continental outflow and atmospheric
chemistry
B. Srinivas et al.
Title Page
Abstract Introduction
Conclusions References
Tables Figures
◭ ◮
◭ ◮
Back Close
Full Screen / Esc
Printer-friendly Version Interactive Discussion
Discussion
P
a
per
|
Dis
cussion
P
a
per
|
Discussion
P
a
per
|
Discussio
n
P
a
per
|
species), mineral dust and carbonaceous species. An attempt has been made to achieve chemical mass closure by summing up the measured chemical species and comparing it with gravimetrically measured mass loading in PM10 and PM2.5at the end of this section.
3.2.1 Water-soluble ionic composition
5
The sum of cations (Na+, NH+4, K+, Mg2+, Ca2+) and anions (Cl−, NO−
3, and SO 2−
4 )
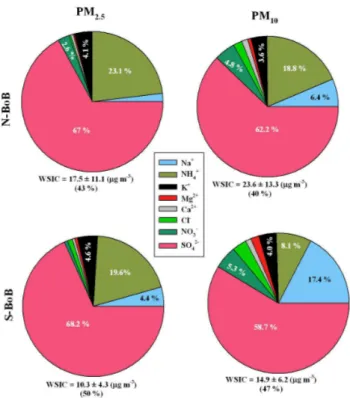
constitute the water-soluble ionic composition (WSIC expressed in µg m−3) which
var-ied from 3.0 to 40.2 (Av.=17.5±11.1) µg m−3 in the fine (PM2.5) and 6.6 to 50.3
(Av.=23.6±13.3) µg m−3 in PM10 over northern Bay of Bengal. The WSIC shows a
decreasing trend as cruise proceeded to the southern region (Table-1). The contribu-10
tion of WSIC to total mass loading of PM2.5 and PM10 was more or less consistent (∼45 %) throughout Bay of Bengal (Table-1). The percentage contribution of an individ-ual ionic component to the WSIC is shown as the pie-charts (Fig. 4) for PM2.5and PM10 in N-BoB and S-BoB. SO24− and NH+4 are the major contributors to WSIC in PM10 and PM2.5over N-BoB with minor contributions from K+ in PM2.5and that of NO−
3 and Na
+
15
in PM10. In S-BoB, the contribution of SO2−
4 and NH+4 remained consistent in PM2.5,
however, there is an increase in the contribution from Na+ and NO−
3 in PM10. Overall,
SO24− is the dominant contributor to the ionic budget of aerosols over Bay of Bengal during winter monsoon.
The non sea salt (nss) components of K+, Mg2+, Ca2+ and SO2−
4 have been
20
calculated by using the following equations: nss-K+= K+−0.037·Na+; nss-Ca2+= Ca2+−0.038·Ca2+; nss-Mg2+= Mg2+−0.12·Na+; nss-SO24−=SO42−−0.25·Na+; where 0.037, 0.038, 0.12, 0.25 are weight ratios of K+, Ca2+, Mg2+ and SO24− to Na+ in seawater (Keene et al., 1986) and considering Na+as a reference element for the cor-rection of sea-salt contribution. On an average, nss-sulphate constitutes 99 and 94 % 25
ACPD
11, 20667–20712, 2011Continental outflow and atmospheric
chemistry
B. Srinivas et al.
Title Page
Abstract Introduction
Conclusions References
Tables Figures
◭ ◮
◭ ◮
Back Close
Full Screen / Esc
Printer-friendly Version Interactive Discussion
Discussion
P
a
per
|
Dis
cussion
P
a
per
|
Discussion
P
a
per
|
Discussio
n
P
a
per
|
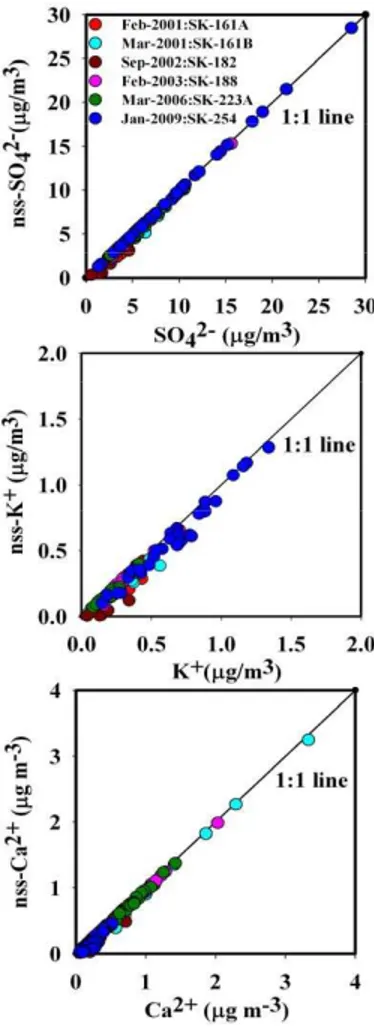
in the MABL of Bay of Bengal. Comparison of the winter-ICARB (ICARB-W) data with earlier data from Bay of Bengal (Sarin et al., 2011), suggests the strong anthropogenic impact over the MABL during the north-east monsoon. This is evident from the scatter plots between (a) SO24− versus nss-SO24− (b) K+ versus nss-K+ and (c) Ca2+ versus nss-Ca2+ (Fig. 5). The spatio-temporal distribution of major ions for PM2.5 and PM10 5
are shown in Fig. 6. In general, lower values were observed for the concentration of each ion during S-BoB transects closely resembling the feature observed for PM2.5and
PM10 mass, except a higher values for Na+ is found over S-BoB in PM10. The spatio-temporal variability further reflects to the dominance of NH+4, nss-K+ and nss-SO2−
4 in
PM2.5 than in PM10, emphasizing their abundance in fine mode. However, Na+, NO−
3,
10
and nss-Ca2+ are abundant in PM10 suggest their association with coarser particle viz sea-salt and dust (Fig. 6). The neutralization of anthropogenic nitrates by sea-salts and/or alkaline dust is one of the possible reasons for occurrence of nitrate in PM10. The spatial variation of nss-Ca2+ in PM10 exhibits the higher concentrations in the northern Bay where the continental influence is more pronounced, however, its contri-15
bution is almost negligible in PM2.5. Another major constituent in water soluble species is nss-K+ which can be used as a tracer for bio-mass burning emissions. The mass concentration of nss-K+ shows a similar spatial distribution to that of anthropogenic components SO2−
4 and NH
+
4 (Fig. 6).
The relationship between the concentrations of nss-SO2−
4 and NH
+
4 in PM2.5 and
20
PM10 over N-BoB and S-BoB is shown in Fig. 7. Both species showed excellent cor-relation in PM2.5(r2=0.98) for entire BoB. However, relatively large scatter (r2=0.75) is observed in PM10, during the S-BoB transect compared to N-BoB (r2=0.92). Such significant correlation suggests that nss-SO24− exist as ammonium salt in fine mode (PM2.5), similar to the observation reported from coastal (Zhuang et al., 1999b) as well 25
ACPD
11, 20667–20712, 2011Continental outflow and atmospheric
chemistry
B. Srinivas et al.
Title Page
Abstract Introduction
Conclusions References
Tables Figures
◭ ◮
◭ ◮
Back Close
Full Screen / Esc
Printer-friendly Version Interactive Discussion
Discussion
P
a
per
|
Dis
cussion
P
a
per
|
Discussion
P
a
per
|
Discussio
n
P
a
per
|
nss–SO2−
4 in PM2.5 is found close to 1 in N-BoB and S-BoB (Fig. 7) suggesting the
complete neutralization of acidic sulphate by NH+4. However, lower ratios were seen in PM10 (0.56±0.34) suggests that particulate nss-SO24− is not completely neutralized by NH+4 (due to lower contribution of NH+4 in PM10 over N-BoB and S-BoB); and hence near absence of particulate ammonium nitrate (Matsumoto and Tanaka, 1996). As a 5
result, neutralization of nitrate is favoured by its uptake on the coarser sea-salt parti-cles, thus leading to relatively higher concentration of NO−
3 in PM10 (Fig. 5).
The mass ratio of NO−3 and nss-SO24− in aerosol samples has been used to assess the relative importance of emissions from stationary versus mobile sources (Wang et al., 2006; Arimoto et al., 1996; Yao et al., 2002). In the present study, the ratio varied 10
from 0.01 to 0.18 with an average of 0.03 in PM2.5samples, whereas the same for PM10 samples varied from 0.01 to 0.43 with an average of 0.10. Over the marine region, due to the reaction of sea salt and dust with HNO3, nitrate exists in coarse mode, however, sulfate exists in both fine and coarse mode due to the formation of (NH4)2SO4, CaSO4, Na2SO4. The mass ratio of NO−3/nss-SO24−, during long range transport, will be low 15
in PM2.5 because of the various processes such as evaporative loss of NH4NO3 and the complete neutralization reaction of NH3 with H2SO4, as a result of which sulfate concentrations are far more higher compared to nitrate mass concentrations in fine mode aerosols.
3.2.2 Carbonaceous species
20
The spatio-temporal variability of EC and OC is shown in Fig. 8 and mean concen-trations along with maximum and minimum value in N-BoB and S-BoB have been re-ported in Table-1. The average EC concentrations in PM2.5 and PM10 are 2.0±1.3 (range: 0.8–5.0) µg m−3and 2.7±1.7 (range: 1.0–6.7) µg m−3respectively over N-BoB. The spatial variability is found to be similar to that of mass loading, showing a decreas-25
ing trend in the mass concentration of EC towards S-BoB with average concentration of 1.2±0.4 (range: 0.2–1.8) µg m−3 and 1.1
ACPD
11, 20667–20712, 2011Continental outflow and atmospheric
chemistry
B. Srinivas et al.
Title Page
Abstract Introduction
Conclusions References
Tables Figures
◭ ◮
◭ ◮
Back Close
Full Screen / Esc
Printer-friendly Version Interactive Discussion
Discussion
P
a
per
|
Dis
cussion
P
a
per
|
Discussion
P
a
per
|
Discussio
n
P
a
per
|
PM10 respectively. It is interesting to note that EC concentration is more or less similar in PM10 and PM2.5 over S-BoB (Fig. 8), suggesting its existence in sub-micron size particles leading to longer lifetime in the atmosphere. In a previous study over Bay of Bengal by (Kumar et al., 2008b), in the bulk aerosol samples, the mean concentra-tion (0.4 µg m−3) was order of magnitude lower than that found in the present study.
5
However, spatial distribution was similar (decreasing trend from north to south) to the present study. The relative contribution of EC towards PM2.5ranged from 2.7 to 9.6 % with an average contribution remaining similar (∼6%) over N-BoB and S-BoB. However, the contribution of EC to PM10was averaged around 4 %, almost twice the contribution observed during background condition within the MABL of Bay of Bengal (Kumar et al., 10
2008b; Sudheer and Sarin, 2008).
The OC concentrations show similar kind of spatial distribution as that of EC, over the N-BoB and S-BoB as illustrated in Fig. 8. The OC concentration varied from 1.6– 11.6 µg m−3(Av=5.9
±3.7 µg m−3) and 1.9–19.7 µg m−3(Av=9.1±6.0 µg m−3) in PM2.5
and PM10respectively, over N-BoB. In contrast to the predominance of EC in fine mode 15
(PM2.5), OC is abundant in both PM2.5and PM10(Fig. 8), exhibiting a bimodal distribu-tion over Bay of Bengal. Particulate organic matter (POM) concentradistribu-tions, estimated from the measured OC multiplied by a factor of 1.6, contribute significantly to PM2.5 (25 % and 14 %) and PM10 (24 % and 16 %) over N-BoB and S-BoB respectively. This factor 1.6 is the ratio of average organic molecular weight per carbon weight suggested 20
by (Turpin and Lim, 2001). Using the similar factor, the POM estimated during ICARB-2006 was averaged around 11 % of total mass loading (Sudheer and Sarin, 2008) almost two times lower than that during winter monsoon.
The linear regression analysis performed between EC and OC, for N-BoB and S-BoB in PM2.5 and PM10 is shown in Fig. 9. A significant correlation between EC and OC 25
ACPD
11, 20667–20712, 2011Continental outflow and atmospheric
chemistry
B. Srinivas et al.
Title Page
Abstract Introduction
Conclusions References
Tables Figures
◭ ◮
◭ ◮
Back Close
Full Screen / Esc
Printer-friendly Version Interactive Discussion
Discussion
P
a
per
|
Dis
cussion
P
a
per
|
Discussion
P
a
per
|
Discussio
n
P
a
per
|
and Sarin, 2008), and several plausible reasons including preferential removal of one component over the other during long-range transport and additional sources of OC has been discussed. As evident from the spatial distribution of carbonaceous species (Fig. 8), a decrease in OC and EC concentration is observed as cruise moved to S-BoB. However, the spatial distribution of OC/EC (Fig. 8c), show an increase in the 5
ratio (11 to 17 January), suggesting the relatively higher contribution of OC caused by biomass burning during S-BoB transects when winds were from south-east Asia. The evidence for biomass burning as a dominant source for OC is further illustrated from the significant linear relationship between OC and nss-K+ (Fig. 10) for the IGP and SEA outflow in PM2.5and PM10.
10
During the campaign, in most of the samples OC/EC ratio lies in the range of 2.0–4.0 (Fig. 8). Earlier studies suggest that (OC/EC) ratio more than 2.0 can have contribution from biomass burning and any value less than this can be explained by their origin derived from fossil fuel combustion (Turpin et al., 1991; Turpin and Huntzicker, 1991; Chow et al., 1996). In the N-BoB, OC/EC ratio for PM2.5 varied from 1.9 to 4.9 with a 15
mean and standard deviation of 2.9±0.8 where as for S-BoB, it varied from 0.9 to 4.0 with mean (±stdev)=2.4±1.3. Surprisingly, in the Southern Bay, 4 samples having their EC values higher compared to their OC values and hence their OC/EC values are less than one. These four samples were collected during the MAP wind regime. The spatio-temporal variability observed in the OC/EC ratio can be explained owing to 20
the differences in chemical reactivity, volatile nature and scavenging rates of OC and EC. Due to the non-volatile nature and thermal stability, residence time of EC is more compared to OC (Lim et al., 2003). This particulate organic carbon may contain semi-volatile organic compounds which can evaporate during their long range transport from the source regions and may partition themselves between gas-particle phases. Hence 25
ACPD
11, 20667–20712, 2011Continental outflow and atmospheric
chemistry
B. Srinivas et al.
Title Page
Abstract Introduction
Conclusions References
Tables Figures
◭ ◮
◭ ◮
Back Close
Full Screen / Esc
Printer-friendly Version Interactive Discussion
Discussion
P
a
per
|
Dis
cussion
P
a
per
|
Discussion
P
a
per
|
Discussio
n
P
a
per
|
et al., 2002; Castro et al., 1999; Turpin and Huntzicker, 1995).
In this study, a suite of diagnostic ratios have been used to decipher the relative con-tribution of carbonaceous species from biomass and fossil fuel burning emissions. The TC/EC ratio (where TC is total carbon defined as the sum of EC and OC measured in aerosol) have been used by several investigators in order to identify and quantify the source characteristics (i.e. emissions from biomass and fossil-fuel combustion) (An-5
dreae and Merlet, 2001; Novakov et al., 2005). For this, we adopted the mixing model approach, similar on the line of (Mayol-Bracero et al., 2002), in which biomass burning and fossil fuel combustion are considered as two end members. The TC/EC value for biomass burning from a diverse vegetation and wood fuel (bio fuel) is averaged around 9.1 (Andreae and Merlet, 2001) and that for fossil fuel combustion sources is about 2.0 10
(Mayol-Bracero et al., 2002; Novakov et al., 2000). Assuming these as representative value of two end members (viz. 2.0 for fossil fuel and 9.1 for biomass burning), the TC/EC averaging around 4.3 over entire BoB for PM10 indicates∼35 and 65 % contri-bution from biomass and fossil fuel combustion respectively. Similarly for PM2.5, this value averages around 3.5, suggesting that the carbonaceous species in fine mode 15
have 20 % and 80 % contribution from biomass and fossil fuel combustion sources respectively. Such observation point towards mixed contribution from both sources contrary to the previous study by (Sudheer and Sarin, 2008b), reporting the dominant (more than 80 %) contribution from biomass burning over Bay of Bengal during spring inter-monsoon.
20
According to (Andreae and Merlet, 2001), the K+/EC ratio in the bio mass burn-ing emission lies in between 0.1 to 0.63 and the observed ratio over Bay of Bengal for PM2.5 and PM10 averaged around 0.35±0.10 and 0.39±0.15 respectively, which signifies the source of K+ and carbonaceous aerosol from biomass burning as fossil fuel combustion produces insignificant amount of K+. In order to quantify the relative 25
ACPD
11, 20667–20712, 2011Continental outflow and atmospheric
chemistry
B. Srinivas et al.
Title Page
Abstract Introduction
Conclusions References
Tables Figures
◭ ◮
◭ ◮
Back Close
Full Screen / Esc
Printer-friendly Version Interactive Discussion
Discussion
P
a
per
|
Dis
cussion
P
a
per
|
Discussion
P
a
per
|
Discussio
n
P
a
per
|
from biomass burning is more than 50% in PM2.5and PM10. This further supports our inference of mixed contribution from both (fossil fuel and biomass burning) sources to-wards carbonaceous aerosols over Bay of Bengal. It is also interesting to note that the nss-K+/EC ratio are relatively higher in S-BoB (0.39±0.09 for PM2.5and 0.47±0.15 for
PM10) as compared to N-BoB (0.29±0.09 for PM2.5and 0.29±0.08 for PM10). This
sug-gests the dominant contribution of biomass burning emissions during SEA outflow over 5
S-BoB. Except one study by (Sudheer and Sarin, 2008a), previous studies (INDOEX) attributed the carbonaceous mass concentration over the northern Indian Ocean is mainly from fossil-fuel combustion sources. Our study, together with high concentra-tions of nss-K+and EC in PM2.5aerosols further suggests the significant contribution of carbonaceous aerosol mass concentration is from bio-mass burning during the ICARB-10
2009 campaign.
3.2.3 Mineral dust
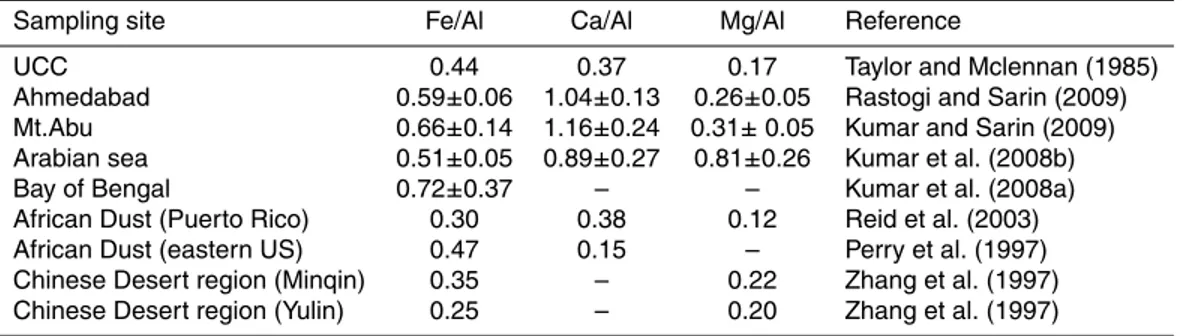
In the PM2.5 and PM10 Fe and Al are well correlated (Fig. 11) and the average ratio of Fe/Al in PM2.5 is about 0.51 (±0.30), whereas in PM10 it is about 0.40 (±0.09). In
PM10, Fe/Al ratio is close to the reported value of upper continental crust (UCC value 15
of Fe/Al=0.43; (Taylor and McLennan, 1985). The relative enrichment of Fe in PM2.5, which contains fine mode aerosols, can be attributed to the anthropogenic combustion sources (Kumar et al., 2010). Similarly Ca/Al and Mg/Al in PM10 aerosols are close to the UCC values (Ca/Al=0.37, Mg/Al=0.17) reported by (Taylor and McLennan, 1985), where as the relative enrichment in PM2.5can have contributions from anthropogenic 20
sources. The average values of Fe/Al, Ca/Al and Mg/Al along with the standard de-viations are given in the Table-2 for both PM2.5 and PM10 aerosols collected from the MABL of Bay of Bengal during the campaign. Surprisingly in some samples, depleted values of Fe/Al, Ca/Al, Mg/Al ratios (lower than the upper continental crustal value re-ported by (Taylor and McLennan, 1985) were observed. Such lower Fe/Al ratios are 25
ACPD
11, 20667–20712, 2011Continental outflow and atmospheric
chemistry
B. Srinivas et al.
Title Page
Abstract Introduction
Conclusions References
Tables Figures
◭ ◮
◭ ◮
Back Close
Full Screen / Esc
Printer-friendly Version Interactive Discussion
Discussion
P
a
per
|
Dis
cussion
P
a
per
|
Discussion
P
a
per
|
Discussio
n
P
a
per
|
4000 m indicates the transport of air-parcels from African and central Asian regions rich in dust content. In some regions of these deserts, the transport of mineral dust from Puerto Rico, African desert (Reid et al., 2003) and from Chinese desert regions (Zhang et al., 1997; Arimoto et al., 2006; Buck et al., 2010a), are reported with low Fe/Al ratio. Some back trajectories are showing localized pattern within the marine boundary layer for which Fe/Al ratio is also low (MAP type). The variability of Ca/Al, 5
Fe/Al and Mg/Al is quite larger in PM2.5 because of low dust concentrations. Table-3 presents the comparison of these crustal derived elemental ratios with other studies reported elsewhere.
In the present study, Al concentration has been used to calculate the mineral dust mass by assuming that on average, the upper continental crust contains 8.04% of Al 10
(Taylor and McLennan, 1985). Mineral dust contributes to about 11% to the PM2.5 mass, suggests the presence of fine dust. Though, total Ca concentration is low in PM2.5, the mass ratio of soluble Ca2+ to total aerosol Ca is ∼100%, indicates that atmospheric processing of dust by anthropogenic acids such as nss-SO24− and NO−3 and hence leads to its enhanced solubility in PM2.5 aerosols. Similarly in the PM10 15
aerosols, percentage contribution of water soluble Ca2+towards total Ca is about 76%, where the mineral dust contribution to average PM10mass is about 33%. In the N-BoB, significant correlation (r2=0.53;p-value<0.01) observed between Ca and NO−
3further
confirms the acid uptake by mineral aerosol. No such significant linear relationship is observed over the south Bay, where the dust levels significantly low in compared to that 20
over N-BoB.
3.2.4 Mass closure
Mass concentrations of PM2.5 and PM10 aerosols were estimated from the measured constituents in aerosol samples and compared with the gravimetrically obtained PM2.5 and PM10 mass concentrations. In the present study, particulate mass concentration 25
ACPD
11, 20667–20712, 2011Continental outflow and atmospheric
chemistry
B. Srinivas et al.
Title Page
Abstract Introduction
Conclusions References
Tables Figures
◭ ◮
◭ ◮
Back Close
Full Screen / Esc
Printer-friendly Version Interactive Discussion
Discussion
P
a
per
|
Dis
cussion
P
a
per
|
Discussion
P
a
per
|
Discussio
n
P
a
per
|
PMx=Mineral dust+Sea Salt+Anthropogenic+Organic Matter+EC=(Al·12.5)
+(Cl− +1.47
·Na+) +(NH+4 +NO−3 +nss-SO24−) +(1.6·OC)+EC Here X=2.5 or 10 respectively.
Sea-Salt concentrations were estimated by the following relation (Quinn et al 2007): Sea Salt=Cl− (µg m−3)+1.47
·Na+ (µg m−3)
5
Here, 1.47 is the ratio of (Na+ + K+ +Mg2+ +Ca2+ +SO2−
4 + HCO
−
3)/ Na
+. This
approach of calculating sea salt is solely based on the assumption that Na+ and Cl− are mainly derived from sea water and hence excluding the contribution from non sea salt (nss) -components such as K+, Mg2+, Ca2+, SO2−
4 , HCO
−
3 there by allowing for the
Cl− loss from sea salt through chemical reactions with acidic constituents of the am-10
bient particulate matter. This approximation is fairly good enough in the present study because of the fact that collected aerosol samples are of marine region. Estimated concentration of PM2.5 and PM10 in N-BoB and S-BoB are in well agreement with the gravimetrically obtained mass concentrations (Fig. 12).
The relative contributions of chemical species to average PM2.5 and PM10 mass 15
in north and south BoB were also shown as pie diagrams (Fig. 13). The anthro-pogenic components constitute the major fraction in both sizes throughout Bay of Ben-gal whereas mineral dust is next major contributor in PM10with significantly lower con-tribution in PM2.5. The contribution of sea-salts is insignificant in PM2.5, however, sig-nificant contribution is observed in PM10 over S-BoB. The carbonaceous components 20
(POM+EC) also constitute the significant fraction in PM2.5and PM10over entire Bay of Bengal. Our work presents the quantitative chemical composition of size-segregated aerosols (PM2.5and PM10) in the MABL of Bay of Bengal during winter period (27 De-cember 2008–30 January 2009). This study also emphasize the impact of biomass burning over the north Indian ocean and also as a significant source of carbonaceous 25
ACPD
11, 20667–20712, 2011Continental outflow and atmospheric
chemistry
B. Srinivas et al.
Title Page
Abstract Introduction
Conclusions References
Tables Figures
◭ ◮
◭ ◮
Back Close
Full Screen / Esc
Printer-friendly Version Interactive Discussion
Discussion
P
a
per
|
Dis
cussion
P
a
per
|
Discussion
P
a
per
|
Discussio
n
P
a
per
|
3.3 Impact of continental outflow
3.3.1 Cl−depletion over of Bay of Bengal
Chloride depletion in marine aerosols collected over a polluted marine region is a com-mon phenomenon and is investigated by several researchers (Yao et al., 2003; Hsu et al., 2007; Zhuang et al., 1999a). The reaction of sea salt with acidic pollutants such 5
as H2SO4and HNO3can replace chloride from the sea salt and thus leads to the for-mation of nitrate and sulphate. These reactions further shift NO−3 and SO24− aerosols from fine mode to coarse mode thereby increasing the dry deposition velocities and scavenging efficiency of these particles. As a result of chloride depletion the Cl−/Na+
ratio can be much lower in marine aerosols than their actual mass ratio from seawater 10
(Cl−/Na+ sea-water ratio is 1.8) (Pakkanen, 1996; Zhuang et al., 1999a, b; Yao et al., 2003). The chloride deficit (%) is calculated for all samples by the following equation.
Cl− defect (%)
=([Cl−
sw−Cl−meas]/[Cl−sw])·100=[(1.16·Na+meas- Cl−meas)/ (1.16·Na+)]
·100
In this equation Na+measand Cl−
measare expressed in equivalent concentrations. Here
15
factor 1.16 is the ratio of equivalent concentrations of chloride and sodium in sea-water. This approach is very much similar to that (Yao et al., 2003; Zhuang et al., 1999a; Pakkanen et al., 1996). The calculation is based on the assumption that Na+ in aerosol samples is solely derived from seawater and does not have significant an-thropogenic source. In the present study over Bay of Bengal large chloride deficit have 20
been observed ranging from 39–100 and 13–100 % with a mean value of 86±20 and 89±20 % in PM2.5and PM10 respectively. The magnitude of Cl-deficit exhibits a linear increase with the excess-nss-SO24− (excess over NH+4); suggesting that displacement of HCl from sea-salt particles by H2SO4 is a dominant reaction mechanism for the chloride-depletion (Sarin et al., 2011). It is thus suggested that sea-salts could serve 25
ACPD
11, 20667–20712, 2011Continental outflow and atmospheric
chemistry
B. Srinivas et al.
Title Page
Abstract Introduction
Conclusions References
Tables Figures
◭ ◮
◭ ◮
Back Close
Full Screen / Esc
Printer-friendly Version Interactive Discussion
Discussion
P
a
per
|
Dis
cussion
P
a
per
|
Discussion
P
a
per
|
Discussio
n
P
a
per
|
chlorine and has implications to the oxidation of hydrocarbons and dimethyl sulphide (DMS) in the MABL.
3.3.2 Dry-deposition of mineral dust
In the present study, the mineral dust mass concentrations in PM10 aerosols varied from 2.6–43.4 µg m−3 with an average value of 13.8
±11.9 µg m−3. Average mass
con-5
centration of mineral dust contributes almost 11 % in PM2.5and 33 % to PM10aerosols respectively. Further, mineral aerosol mass concentrations were converted into dry-deposition fluxes (fmineral dust=mineral dust (µg m−3) · (0.02 m s−1); Here 0.02 m s−1is the dry-deposition velocity of mineral dust, adopted from (Duce et al., 1991). The av-erage dry-deposition flux of mineral dust for PM10 is ∼1.0×10¹³g yr−1, is compared
10
with earlier estimates over the northern Indian Ocean (2.0×10¹³g yr−1) by Goldberg and Griffin, (1979). Further, we also compared the mineral dust input to the Bay of Bengal from the present study with the dust estimates (2.9×10¹³g yr−1) of (Duce et al., 1991). It is noteworthy that on a decadal scale, there were no substantial changes in the amount of dust flux to the northern Indian Ocean.
15
3.3.3 Anthropogenic sources and aerosol iron solubility
Aeolian supply of soluble iron has significant impact on the ocean surface biogeochem-istry. In the present-day scenario of growing anthropogenic activities from south and south-east Asia, it is expected to have substantial changes in the abundance of solu-ble Fe in aerosols (mineral dust vis- `a-vis anthropogenic combustion sources). In the 20
present study, the water-soluble aerosol Fe (FeWS) and total aerosol Fe (FeTot) have been measured in both sizes (Kumar et al, 2010). The transport of alluvial dust from the Indo-Gangetic Plain is a dominant source of mineral dust to the Bay of Bengal. During the study period, Fews (%) varied from 3.5–49.7 % and 1.4–23.9 % for PM2.5 and PM10respectively (Kumar et al., 2010). The high FeWS (%) over the Bay of Bengal 25
ACPD
11, 20667–20712, 2011Continental outflow and atmospheric
chemistry
B. Srinivas et al.
Title Page
Abstract Introduction
Conclusions References
Tables Figures
◭ ◮
◭ ◮
Back Close
Full Screen / Esc
Printer-friendly Version Interactive Discussion
Discussion
P
a
per
|
Dis
cussion
P
a
per
|
Discussion
P
a
per
|
Discussio
n
P
a
per
|
Plain and south-east Asia. Our study has revealed that atmospheric processing of mineral dust by acidic species contribute significantly towards the soluble aerosol Fe, as evident from the linear relationship between Fews(%) and nss-SO24− in PM2.5over
north Bay of Bengal (Kumar et al., 2010). Furthermore, the aerosol Fe from combus-tion sources (biomass burning vis- `a-vis fossil-fuel combuscombus-tion) were found to contribute 5
towards aerosol soluble Fe over the Bay. The significant linear correlation observed among nss-K+, EC, OC and WS-Fe suggest their common source of bio-mass burning (Kumar et al., 2010). Several studies highlighted the importance of bio-mass burn-ing as a potential source for the supply of soluble Fe (Guieu et al., 2005; Paris et al., 2010). During the study period, the high mass concentration of nss-K+further confirms 10
the bio-mass burning as the significant source of aerosol Fe over the Bay.
3.3.4 Anthropogenic trace metals
In the present study, Cd and Pb have shown spatio-temporal variability within the MABL. These metals are introduced in to the atmosphere mainly from the high tem-perature combustion processes and exist mostly in fine mode (Lind et al., 1998). The 15
scatter plot of Cd, Pb between PM2.5 and PM10 aerosols suggest their predominant
fine mode existence. Similarly, the significant linear correlations observed among Pb, Cd and nss-SO2−
4 confirms their anthropogenic origin. Therefore, in PM2.5 aerosols,
crustal enrichment factors of trace metals (Cd and Pb) were calculated in order to com-pare their abundance with upper continental crust using Al as a reference element. In 20
ACPD
11, 20667–20712, 2011Continental outflow and atmospheric
chemistry
B. Srinivas et al.
Title Page
Abstract Introduction
Conclusions References
Tables Figures
◭ ◮
◭ ◮
Back Close
Full Screen / Esc
Printer-friendly Version Interactive Discussion
Discussion
P
a
per
|
Dis
cussion
P
a
per
|
Discussion
P
a
per
|
Discussio
n
P
a
per
|
4 Summary and conclusions
A comprehensive study of PM2.5and PM10, its mass concentration and chemical
com-position have been undertaken during wintertime to understand the atmospheric chem-istry within the MABL of Bay of Bengal impacted by large continental outflow. The important conclusions are:
5
1. A strong spatio-temporal variability has been observed for mass loading of PM2.5
and PM10 with relatively higher concentration in the northern Bay and dominated by fine (PM2.5) mode aerosols constituting∼65 % of PM10 during wintertime. 2. The fractional contribution of WSIC to total mass of PM2.5 and PM10 was more
or less similar (∼45 %) throughout Bay of Bengal, with dominant contribution from
10
sulphate to the ionic budget. On average, nss-SO2−
4 constitutes∼65 % of the total
water-soluble ionic species and is primarily associated with the fine mode (PM2.5) aerosols.
3. The spatial distribution of carbonaceous species (EC and OC) exhibit a similar pattern as that of mass loading, showing a decreasing trend in the EC and OC 15
concentration towards S-BoB. The mixed contribution of fossil-fuel and biomass burning sources has been observed towards carbonaceous species in N-BoB where as S-BoB is more influenced by biomass combustion sources.
4. The mineral dust accounts for∼30 % of PM10; however, insignificant contribution of dust is observed towards PM2.5.
20
5. On average, anthropogenic component including carbonaceous species are the major contributor towards PM2.5and PM10, however natural constituents (mineral dust and sea-salts) are insignificant in PM2.5with some contribution in PM10over
Bay of Bengal during winter monsoon.
The impact of continental outflow to the atmospheric chemistry of aerosols in the MABL 25
ACPD
11, 20667–20712, 2011Continental outflow and atmospheric
chemistry
B. Srinivas et al.
Title Page
Abstract Introduction
Conclusions References
Tables Figures
◭ ◮
◭ ◮
Back Close
Full Screen / Esc
Printer-friendly Version Interactive Discussion
Discussion
P
a
per
|
Dis
cussion
P
a
per
|
Discussion
P
a
per
|
Discussio
n
P
a
per
|
The transport of continental aerosols to the oceanic region has implication in the bio-geochemistry of various elements due to atmospheric deposition as well as in the cli-mate forcing which needs further consideration.
Acknowledgements. This study was supported by the office of ISRO-GBP (Bangaluru, India) as a part of Indian national programme on Integrated Campaign on Aerosols Trace Gases and 5
Radiation Budget-Winter (ICARB-W). We wish to thank K. Krishnamurthy and C. B. S. Dutt for their critical role in organizing the campaign and logistic help.
References
Andreae, M. O. and Crutzen, P. J.: Atmospheric Aerosols: Biogeochemical Sources and Role in Atmospheric Chemistry, Science, 276, 1052–1058, doi:10.1126/science.276.5315.1052, 10
1997.
Andreae, M. O. and Merlet, P.: Emission of trace gases and aerosols from biomass burning, Global Biogeochem. Cy., 15, 955-966, doi:10.1029/2000gb001382, 2001.
Arimoto, R., Duce, R. A., Savoie, D. L., Prospero, J. M., Talbot, R., Cullen, J. D., Tomza, U., Lewis, N. F., and Ray, B. J.: Relationships among aerosol constituents from 15
Asia and the North Pacific during PEM-West A, J. Geophys. Res., 101, 2011–2023, doi:10.1029/95jd01071, 1996.
Arimoto, R., Duce, R. A., Ray, B. J., and Tomza, U.: Dry deposition of trace elements to the western North Atlantic, Global Biogeochem. Cy., 17, 1010, doi:10.1029/2001gb001406, 2003.
20
Arimoto, R., Kim, Y. J., Kim, Y. P., Quinn, P. K., Bates, T. S., Anderson, T. L., Gong, S., Uno, I., Chin, M., Huebert, B. J., Clarke, A. D., Shinozuka, Y., Weber, R. J., Anderson, J. R., Guazzotti, S. A., Sullivan, R. C., Sodeman, D. A., Prather, K. A., and Sokolik, I. N.: Charac-terization of Asian Dust during ACE-Asia, Global Planet. Change, 52, 23–56, 2006.
Buck, C. S., Landing, W. M., Resing, J. A., and Measures, C. I.: The solubility and deposition 25
of aerosol Fe and other trace elements in the North Atlantic Ocean: Observations from the A16N CLIVAR/CO2 repeat hydrography section, Mar. Chem., 120, 57–70, 2010a.
Castro, L. M., Pio, C. A., and Harrison, R. M.: Carbonaceous aeroso1 in urban and rura1 Euro-pean atmospheresestimation of secondary organic carbon concentrations, Atmos. Environ., 33, 2771–2781, 1999.
ACPD
11, 20667–20712, 2011Continental outflow and atmospheric
chemistry
B. Srinivas et al.
Title Page
Abstract Introduction
Conclusions References
Tables Figures
◭ ◮
◭ ◮
Back Close
Full Screen / Esc
Printer-friendly Version Interactive Discussion
Discussion
P
a
per
|
Dis
cussion
P
a
per
|
Discussion
P
a
per
|
Discussio
n
P
a
per
|
Charlson, R. J., Langner, J., Rodhe, H., Leovy, C. B., and Warren, S. G.: Perturbation of the northern hemisphere radiative balance by backscattering from anthropogenic sulfate aerosols, Tellus A, 43, 152–163, doi:10.1034/j.1600-0870.1991.00013.x, 1991.
Chow, J. C., Watson, J. G., Lowenthal, D. H., and Countess, R. J.: Sources and chemistry of
PM10aerosol in Santa Barbara County, CA, Atmos. Environ., 30, 1489–1499, 1996.
5
Dentener, F. J., Carmichael, G. R., Zhang, Y., Lelieveld, J., and Crutzen, P. J.: Role of mineral aerosol as a reactive surface in the global troposphere, J. Geophys. Res., 101, 22869– 22889, doi:10.1029/96jd01818, 1996.
Doney, S. C., Mahowald, N., Lima, I., Feely, R. A., Mackenzie, F. T., Lamarque, J. F., and Rasch, P. J.: Impact of anthropogenic atmospheric nitrogen and sulfur deposition on ocean 10
acidification and the inorganic carbon system, PNAS, 104(37) 14580–14585, 2007. Draxler, R. R.: HYSPLIT-4 user’s guide, NOAA Tech Memo, ERL ARL-230, 35, 2002.
Duce, R.: The impact of atmospheric nitrogen, phosphorous and iron species on marine bi-ological productivity, in The Role of Air-Sea Exchange in Geochemical cycling, edited by: Buat-Menard, P., D. Reidel, Norwell, Mass., USA, 497–529, 1986.
15
Duce, R. A., Liss, P. S., Merrill, J. T., Atlas, E. L., Buat-Menard, P., Hicks, B. B., Miller, J. M., Prospero, J. M., Arimoto, R., Church, T. M., Ellis, W., Galloway, J. N., Hansen, L., Jickells, T. D., Knap, A. H., Reinhardt, K. H., Schneider, B., Soudine, A., Tokos, J. J., Tsunogai, S., Wollast, R., and Zhou, M.: The atmospheric input of trace species to the world ocean, Global Biogeochem. Cy., 5, 193–259, doi:10.1029/91gb01778, 1991.
20
Duce, R. A., LaRoche, J., Altieri, K., Arrigo, K. R., Baker, A. R., Capone, D. G., Cornell, S., Dentener, F., Galloway, J., Ganeshram, R. S., Geider, R. J., Jickells, T., Kuypers, M. M., Langlois, R., Liss, P. S., Liu, S. M., Middelburg, J. J., Moore, C. M., Nickovic, S., Oschlies, A., Pedersen, T., Prospero, J., Schlitzer, R., Seitzinger, S., Sorensen, L. L., Uematsu, M., Ulloa, O., Voss, M., Ward, B., and Zamora, L.: Impacts of Atmospheric Anthropogenic Nitrogen on 25
the Open Ocean, Science, 320, 893–897, doi:10.1126/science.1150369, 2008.
Ganguly, D., Gadhavi, H., Jayaraman, A., Rajesh, T. A., and Misra, A.: Single scattering albedo of aerosols over the central India: Implications for the regional aerosol radiative forcing, Geophys. Res. Lett., 32, L18803, doi:10.1029/2005gl023903, 2005.
Gomes, L. and Gillette, D. A.: A comparison of characteristics of aerosol from dust storms 30
in Central Asia with soil-derived dust from other regions, Atmos. Environ.. Part A. General Topics, 27, 2539–2544, 1993.
ACPD
11, 20667–20712, 2011Continental outflow and atmospheric
chemistry
B. Srinivas et al.
Title Page
Abstract Introduction
Conclusions References
Tables Figures
◭ ◮
◭ ◮
Back Close
Full Screen / Esc
Printer-friendly Version Interactive Discussion
Discussion
P
a
per
|
Dis
cussion
P
a
per
|
Discussion
P
a
per
|
Discussio
n
P
a
per
|
source of dissolved iron to the open ocean?, Geophys. Res. Lett., 32, L19608, doi:10.1029/2005gl022962, 2005.
Hsu, S. C., Liu, S. C., Kao, S. J., Jeng, W. L., Huang, Y. T., Tseng, C. M., Tsai, F., Tu, J. Y., and Yang, Y.: Water soluble species in the marine aerosol from the northern South China Sea: High chloride depletion related to air pollution, J. Geophys. Res., 112, D19304, 5
doi:10.1029/2007JD008844, 2007.
Jickells, T. D.: The inputs of dust derived elements to the Sargasso Sea; a synthesis, Mar. Chem., 68, 5–14, 1999.
Jickells, T. D., An, Z. S., Andersen, K. K., Baker, A. R., Bergametti, G., Brooks, N., Cao, J. J., Boyd, P. W., Duce, R. A., Hunter, K. A., Kawahata, H., Kubilay, N., laRoche, J., Liss, P. 10
S., Mahowald, N., Prospero, J. M., Ridgwell, A. J., Tegen, I., and Torres, R.: Global Iron Connections Between Desert Dust, Ocean Biogeochemistry, and Climate, Science, 308, 67–71, doi:10.1126/science.1105959, 2005.
Kaskaoutis, D. G., Kalapureddy, M. C. R., Krishna Moorthy, K., Devara, P. C. S., Nastos, P. T., Kosmopoulos, P. G., and Kambezidis, H. D.: Heterogeneity in pre-monsoon aerosol types 15
over the Arabian Sea deduced from ship-borne measurements of spectral AODs, Atmos. Chem. Phys., 10, 4893–4908, doi:10.5194/acp-10-4893-2010, 2010.
Kedia, S. and Ramachandran, S.: Features of aerosol optical depths over the Bay of Bengal and the Arabian Sea during premonsoon season: Variabilities and anthropogenic influence, J. Geophys. Res., 113, D11201, doi:10.1029/2007jd009070, 2008.
20
Keene, W. C., Pszenny, A. P., Gallloway, J. N., and Hawley, M. E.: Sea salt correction and interpretation of constituent ratios in marine precipitation, J. Geophys. Res., 91, 6647–6658., 1986.
Kumar, A. and Sarin, M. M.: Atmospheric water-soluble constituents in fine and coarse mode aerosols from high-altitude site in western India: Long-range transport and seasonal vari-25
ability, Atmos. Environ., 44, 1245–1254, 2010.
Kumar, A., Sarin, M. M., and Sudheer, A. K.: Mineral and anthropogenic aerosols in Arabian Sea-atmospheric boundary layer: Sources and spatial variability, Atmos. Environ., 42, 5169– 5181, 2008a.
Kumar, A., Sudheer, A. K., and Sarin, M. M.: Chemical characteristics of aerosols in MABL of 30
Bay of Bengal and Arabian Sea during spring inter-monsoon: a comparative study, J. Earth Syst. Sci., 117(S1), 325–332, 2008b.
ACPD
11, 20667–20712, 2011Continental outflow and atmospheric
chemistry
B. Srinivas et al.
Title Page
Abstract Introduction
Conclusions References
Tables Figures
◭ ◮
◭ ◮
Back Close
Full Screen / Esc
Printer-friendly Version Interactive Discussion
Discussion
P
a
per
|
Dis
cussion
P
a
per
|
Discussion
P
a
per
|
Discussio
n
P
a
per
|
anthropogenic sources and chemical processing, Mar. Chem., 121, 167–175., 2010. Lawrence, M. G. and Lelieveld, J.: Atmospheric pollutant outflow from southern Asia: a review,
Atmos. Chem. Phys., 10, 11017–11096, doi:10.5194/acp-10-11017-2010, 2010.
Lim, H. J., Turpin, B. J., Russell, L. M., and Bates, T. S.: Organic and Elemental Carbon Mea-surements during ACE-Asia Suggest a Longer Atmospheric Lifetime for Elemental Carbon, 5
Environ. Sci. Technol., 37, 3055–3061, doi:10.1021/es020988s, 2003.
Lind, T., Valmari, T., Kauppinen, E. I., Sfiris, G., Nilsson, K., and Maenhaut, W.: Volatilization of the Heavy Metals during Circulating Fluidized Bed Combustion of Forest Residue, Environ. Sci. Technol., 33, 496–502, doi:10.1021/es9802596, 1998.
Lonati, G., Ozgen, S., and Giugliano, M.: Primary and secondary carbonaceous species in 10
PM2.5samples in Milan (Italy), Atmos. Environ., 41, 4599–4610, 2007.
Louie, P. K. K., Watson, J. G., Chow, J. C., Chen, A., Sin, D. W. M., and Lau, A. K. H.: Seasonal
characteristics and regional transport of PM2.5 in Hong Kong, Atmos. Environ., 39, 1695–
1710, 2005.
Mahowald, N. M., Baker, A. R., Bergametti, G., Brooks, N., Duce, R. A., Jickells, T. D., Kubilay, 15
N., Prospero, J. M., and Tegen, I.: Atmospheric global dust cycle and iron inputs to the ocean, Global Biogeochem. Cy., 19, GB4025, doi:10.1029/2004gb002402, 2005.
Martin, J. H., Gordon, R. M., Fitzwater, S., and Broenkow, W. W.: VERTEX: Phytoplankton/iron studies in the Gulf of Alaska, Deep Sea Res. A. Oceanogr. Res. Papers 36, 649–680, 1989. Matsumoto, K. and Tanaka, H.: Formation and dissociation of atmospheric particulate nitrate 20
and chloride:An approach based on phase equilibrium, Atmos. Environ., 30, 639–648, 1996. Matsumoto, K., Uyama, Y., Hayano, T., and Uematsu, M.: Transport and chemical
transforma-tion of anthropogenic and mineral aerosol in the marine boundary layer over the western North Pacific Ocean, J. Geophys. Res., 109, D21206, doi:10.1029/2004jd004696, 2004. Mayol-Bracero, O. L., Gabriel, R., Andreae, M. O., Kirchstetter, T. W., Novakov, T., Ogren, 25
J., Sheridan, P., and Streets, D. G.: Carbonaceous aerosols over the Indian Ocean during the Indian Ocean Experiment (INDOEX): Chemical characterization, optical properties, and probable sources, J. Geophys. Res., 107, 8030, doi:10.1029/2000jd000039, 2002.
Moorthy, K. K., Satheesh, S. K., Babu, S. S., and Dutt, C. B. S.: Integrated Campaign for Aerosols, gases and Radiation Budget (ICARB): An overview, J. Earth Syst. Sci., 117, 243– 30
262, 2008.