ACPD
11, 7375–7422, 2011Source apportionment of
carbonaceous aerosol
K. E. Yttri et al.
Title Page
Abstract Introduction
Conclusions References
Tables Figures
◭ ◮
◭ ◮
Back Close
Full Screen / Esc
Printer-friendly Version
Interactive Discussion
Discussion
P
a
per
|
Dis
cussion
P
a
per
|
Discussion
P
a
per
|
Discussio
n
P
a
per
|
Atmos. Chem. Phys. Discuss., 11, 7375–7422, 2011 www.atmos-chem-phys-discuss.net/11/7375/2011/ doi:10.5194/acpd-11-7375-2011
© Author(s) 2011. CC Attribution 3.0 License.
Atmospheric Chemistry and Physics Discussions
This discussion paper is/has been under review for the journal Atmospheric Chemistry and Physics (ACP). Please refer to the corresponding final paper in ACP if available.
Source apportionment of the
carbonaceous aerosol in Norway –
quantitative estimates based on
14
C,
thermal-optical and organic tracer
analysis
K. E. Yttri1, D. Simpson2,3, K. Stenstr ¨om4, H. Puxbaum5, and T. Svendby1 1
Norwegian Institute for Air Research, Kjeller, Norway
2
Norwegian Meteorological Institute, Oslo, Norway
3
Dept. Earth & Space Sciences, Chalmers Univ. Technology, Gothenburg, Sweden
4
Dept. Physics, Lund University, Lund, Sweden
5
Inst. for Chemical Technologies and Analytics, Vienna University of Technology, Vienna, Austria
Received: 2 February 2011 – Accepted: 21 February 2011 – Published: 3 March 2011
Correspondence to: K. E. Yttri (key@nilu.no)
ACPD
11, 7375–7422, 2011Source apportionment of
carbonaceous aerosol
K. E. Yttri et al.
Title Page
Abstract Introduction
Conclusions References
Tables Figures
◭ ◮
◭ ◮
Back Close
Full Screen / Esc
Printer-friendly Version
Interactive Discussion
Discussion
P
a
per
|
Dis
cussion
P
a
per
|
Discussion
P
a
per
|
Discussio
n
P
a
per
|
Abstract
In the present study, source apportionment of the ambient summer and winter time particulate carbonaceous matter (PCM) in aerosol particles (PM1and PM10) has been conducted for the Norwegian urban and rural background environment. Statistical treatment of data from thermal-optical, 14C and organic tracer analysis using Latin
5
Hypercube Sampling has allowed for quantitative estimates of seven different sources
contributing to the ambient carbonaceous aerosol. These are: elemental carbon from combustion of biomass (ECbb) and fossil fuel (ECff), organic carbon from combus-tion of biomass (OCbb), fossil fuel (OCff), primary biological aerosol particles (OCPBAP, which includes plant debris, OCpbc, and fungal spores, OCpbs), and secondary organic
10
aerosol from biogenic precursors (OCBSOA).
Our results show that emissions from natural sources were particularly abundant in summer, and with a more pronounced influence at the rural compared to the ur-ban background site. 80% of total carbon (TCp, corrected for the positive artefact) in PM10 and 70% of TCp in PM1 could be attributed to natural sources at the rural
15
background site in summer. Natural sources account for about 50% of TCp in PM10 at the urban background site as well. The natural source contribution was always dominated by OCBSOA, regardless of season, site and size fraction. During winter anthropogenic sources totally dominated the carbonaceous aerosol (83–90%). Com-bustion of biomass contributed slightly more than fossil-fuel sources in winter, whereas
20
emissions from fossil-fuel sources were more abundant in summer.
Mass closure calculations show that PCM likely dominated the mass concentration of the ambient PM regardless of size fraction, season, and site. A larger fraction of PM1(64–69%) was accounted for by carbonaceous matter compared to PM10 (51– 67%), but only by a small margin. In general, there were no pronounced differences
25
ACPD
11, 7375–7422, 2011Source apportionment of
carbonaceous aerosol
K. E. Yttri et al.
Title Page
Abstract Introduction
Conclusions References
Tables Figures
◭ ◮
◭ ◮
Back Close
Full Screen / Esc
Printer-friendly Version
Interactive Discussion
Discussion
P
a
per
|
Dis
cussion
P
a
per
|
Discussion
P
a
per
|
Discussio
n
P
a
per
|
1 Introduction
Particulate carbonaceous matter (PCM) is found to constitute 10–40% (mean 30%) of PM10levels at rural and natural background sites in Europe (Yttri et al., 2007a; Putaud et al., 2004). PCM is believed to have important impacts on global climate (Novakov and Penner, 1993; Kanakidou et al., 2005), and on human health (McDonald et al.,
5
2004; Bell et al., 2009). PCM consists largely of organic matter (OM), and usually smaller quanities of so-called elemental or black carbon (EC or BC). OM is dominated by its carbon content (OC), but with associated oxygen, hydrogen, nitrogen, sulphur. The sum of EC and OC is referred to as total carbon (TC). (Table 1 summarizes the notation used in the present study.) Recent reviews have highlighted the complexity
10
of the carbonaceous aerosol both in terms composition and formation mechanisms (Baltensperger et al., 2005; Donahue et al., 2005, 2009; Kanakidou et al., 2005; Kroll and Seinfeld, 2008; P ¨oschl, 2005; Hallquist et al., 2009).
Over the last few years a number of studies have become available which shed light on the important sources of PCM in Europe. Szidat et al. (2006) attributed the
15
ambient aerosol carbon content to either fossil carbon (from combustion of coal, oil) or modern carbon (from recent vegetation, either by combustion, emissions, or formation using 14C-analysis). They found that fossil-fuel combustion accounted for only 30% of OC throughout the year, even in the city center of Zurich (Switzerland). Biomass burning in wintertime and SOA in summertime seemed to account for the majority of
20
the remaining OC. Follow-up studies in Switzerland using a variety of techniques have confirmed the basic source patterns (Szidat et al., 2007; Lanz et al., 2007, 2008).
The EU CARBOSOL project (CARBOnaceous AeroSOLs over Europe, Legrand and Puxbaum, 2007) provided the first long-term assessment (2002–2004) of PCM in Eu-rope. By using the results of 14C-, thermal-optical-, and organic tracer analysis as
25
input, Gelencs ´er et al. (2007) made use of a novel statistical method to calculate the likely contributions of different sources of the PCM at six sites in Central/Southern
ACPD
11, 7375–7422, 2011Source apportionment of
carbonaceous aerosol
K. E. Yttri et al.
Title Page
Abstract Introduction
Conclusions References
Tables Figures
◭ ◮
◭ ◮
Back Close
Full Screen / Esc
Printer-friendly Version
Interactive Discussion
Discussion
P
a
per
|
Dis
cussion
P
a
per
|
Discussion
P
a
per
|
Discussio
n
P
a
per
|
measured PCM levels at all the sites, whereas in summertime, biogenic SOA (BSOA) was the dominant contributor. These data enabled for the first time an evaluation of the components (primary, secondary, anthropogenic, biogenic) of chemical transport model simulations (Simpson et al., 2007). Previously, only EC or OC has been avail-able for model comparison, and as shown by Simpson et al. (2007), this has been
5
wholly inadequate for understanding the role of e.g. local biomass burning versus long range transport, or of primary organic aereosol (POA) versus secondary (SOA).
In Northern Europe, studies addressing the sources of PCM have been limited. In a pioneering study, Currie et al. (1986) showed that residential wood burning was the major contributor to the carbonaceous aerosol in winter in Norway. A number of recent
10
studies have confirmed the importance of wood-burning emissions to ambient PM lev-els in Nordic areas in wintertime (Glasius et al., 2006; Hedberg et al., 2006; Saarikoski et al., 2008; Szidat et al., 2009; Yttri et al., 2005, 2009). Scandinavia is a particularly interesting region with respect to natural sources of PCM. Large forested areas, emit-ting vast amounts of VOCs during the long days of the Scandinavian summer, create
15
a basis for BSOA formation. Using a network of Nordic sites measuring aerosol num-ber size distributions, combined with extensive trajectory analysis, Tunved et al. (2006) has shown a very good relationship between accumulated biogenic VOC (BVOC) emis-sions and particle mass changes, suggesting that, in clean-air conditions at least, the buildup of PM can be interpreted almost entirely in terms of biogenic precursors and
20
presumably SOA formation. However, this study described very clean air conditions, and it is unclear how far this result can be generalized to typical Nordic conditions. Nevertheless, a substantial 64% contribution of SOA to OC was reported for Helsinki, Finland, during summertime by Saarikoski et al. (2008), of which the major fraction of SOA was likely to have a biogenic origin. Szidat et al. (2009) found that the
contribu-25
tion of non-fossil sources (likely BSOA) (53%) and fossil sources (47%) to TC almost equaled each other at a site in Central Gothenburg in June 2006.
ACPD
11, 7375–7422, 2011Source apportionment of
carbonaceous aerosol
K. E. Yttri et al.
Title Page
Abstract Introduction
Conclusions References
Tables Figures
◭ ◮
◭ ◮
Back Close
Full Screen / Esc
Printer-friendly Version
Interactive Discussion
Discussion
P
a
per
|
Dis
cussion
P
a
per
|
Discussion
P
a
per
|
Discussio
n
P
a
per
|
background sites in Continental Europe. Based on results from the Norwegian site Birkenes this was attributed to coarse OC, which constituted approximately 50% of OC in PM10 on a monthly basis during summer. Further evidence that this coarse OC could be attributed to primary biological aerosol particles (OCPBAP) stems from seasonal and size distribution measurements of sugars and sugar-alcohols, which are
5
tracers of OCPBAP(Yttri et al., 2007b).
Model studies have also suggested that BSOA formation can make a large contribu-tion to PCM levels in Northern Europe (Andersson-Sk ¨old and Simpson, 2001; Chung and Seinfeld, 2002; Tsigaridis and Kanakidou, 2003; Simpson et al., 2007). The study of Simpson et al. (2007) noted the possibility that BSOA formation may even be a
sig-10
nificant contributor to PCM levels in wintertime at Nordic sites, despite low emission rates of precursor species, as a result of the higher condensation rates applicable in cold Nordic conditions. This study also stressed that a major problem in all modeling of PCM is that too many steps in the calculation process are highly uncertain, and there are too few constraints. The uncertainties cover emissions from both anthropogenic
15
and biogenic sources, atmospheric chemistry, and the fate of the various semi volatile products involved in SOA formation. Clearly, there is a strong need for measurements which are able to test the model’s abilities to predict all major components of PCM.
In the present study we present concurrent measurements of TC, EC, OC, monosac-charide anhydrides, sugars and sugar-alcohols, and cellulose, conducted at an urban
20
background site (Oslo) and a rural background site (Hurdal), as part of the Norwegian SORGA (Secondary ORGanic Aerosols in Urban Areas) project. These data are used to apportion the measured TC concentrations into primary, secondary, fossil-fuel, and non-fossil- fuel related sources by the aid of14C-analysis. Further, the carbonaceous aerosol emitted from these sources has been examined with respect to season, size
25
ACPD
11, 7375–7422, 2011Source apportionment of
carbonaceous aerosol
K. E. Yttri et al.
Title Page
Abstract Introduction
Conclusions References
Tables Figures
◭ ◮
◭ ◮
Back Close
Full Screen / Esc
Printer-friendly Version
Interactive Discussion
Discussion
P
a
per
|
Dis
cussion
P
a
per
|
Discussion
P
a
per
|
Discussio
n
P
a
per
|
2 Experimental methods
2.1 Sampling sites
Aerosol filter samples were collected at an urban background site in Oslo, Norway, (Vet-erinary Institute, 59◦56′N, 10◦44′E, 77 m a.s.l.) and at a rural background site (Hurdal, 60◦22′N, 11◦04′E, 300 m a.s.l.) situated 70 km north east of Oslo, for a summer period
5
(19 June–15 July 2006) and winter period (1–8 March 2007).
2.2 Aerosol sampling
2.2.1 PM10, PM1, EC, OC, TC, monosaccharide anhydrides, sugars,
sugar-alcohols
Aerosol (PM10 and PM1) filter samples for subsequent analysis of mass concentration,
10
EC, OC, TC, monosaccharide anhydrides, sugars and sugar-alcohols were collected on prefired (850◦C, 3 h) quartz fibre filters (Whatman QM-A, 47 mm). Tandem filter set-ups (McDow and Huntzicker, 1990) operating according to the QBQ-approach (quartz-fibre filter behind quartz fiber filter) were applied to account for the positive sampling artefact of OC. All quartz fibre filters were obtained from the same batch number to
15
minimize differences in the adsorptive capacity, which otherwise would have biased the estimate of the positive artefact (Kirchstetter, 2001). After sampling, the front filters were conditioned at a temperature of 20±2◦C and at a relative humidity of 50±5% for 48 h for gravimetric determination of the mass concentration. Thereafter the filters were placed in petrislides, packed in airtight plastic bags, and stored at−20◦C. The backup
20
filters were stored immediately after sampling. Leckel LVS 3.1 samplers, operating at a flowrate of 38 l min−1, were used to collect aerosol filter samples both at the
ACPD
11, 7375–7422, 2011Source apportionment of
carbonaceous aerosol
K. E. Yttri et al.
Title Page
Abstract Introduction
Conclusions References
Tables Figures
◭ ◮
◭ ◮
Back Close
Full Screen / Esc
Printer-friendly Version
Interactive Discussion
Discussion
P
a
per
|
Dis
cussion
P
a
per
|
Discussion
P
a
per
|
Discussio
n
P
a
per
|
2.2.2 14C, cellulose
Aerosol filter samples (PM10and PM1) were collected at both sites for subsequent14C and cellulose analysis. The aerosol were collected on prefired (850◦C, 3 h) quartz fibre filters (Whatman QM-A, 47 mm). At the rural background site, the time resolution for this sampling was 336 (14×24) hours during the summer campaign and 168 (7×24)
5
hours during the winter campaign. The time resolution for the urban background site was 168 h during the summer campaign and 84 h during the winter campaign, as sam-pling was separated into day and night, respectively. A Leckel LVS 3.1 samplers, oper-ating at a flow rate of 38 l min−1were used to collect PM1, whereas a NILU (Norwegian Insititute for Air Research) filter holder with an IVL (Swedish Environmental Research
10
Institute) inlet, operating at a flowrate of 16.7 l min−1, was used to collect PM
10.
The different sampling procedures (averaging times and filter fac velocity) gave
somewhat different estimates of OCp, by 12% of average, presumably due to diff
er-ences in homogeneity and unavoidable differences in sampling artefacts between the
systems. We have thus scaled the sampled cellulose by the OCp ratios in order to
15
generate compatible values of all components.
2.3 Thermal-optical transmission analysis
The aerosol filter samples content of EC, OC, and TC was quantified using a thermal-optical transmittance (TOT) instrument from Sunset laboratories Inc., operating ac-cording to a NIOSH derived temperature program. The “8785 Air Particulate Matter On
20
ACPD
11, 7375–7422, 2011Source apportionment of
carbonaceous aerosol
K. E. Yttri et al.
Title Page
Abstract Introduction
Conclusions References
Tables Figures
◭ ◮
◭ ◮
Back Close
Full Screen / Esc
Printer-friendly Version
Interactive Discussion
Discussion
P
a
per
|
Dis
cussion
P
a
per
|
Discussion
P
a
per
|
Discussio
n
P
a
per
|
2.4 Determination of organic tracers
2.4.1 Monosaccharide anhydrides
Levoglucosan, mannosan, and galactosan (monosaccharide anhydrides, MAs) were quantified according to the method described by Dye and Yttri (2005), described briefly here. One punch (1.5 cm2) from the quartz fibre filter was soaked in
tetrahydrofu-5
ran (2 ml) and subjected to ultrasonic agitation (30 min). The extract was then filtered through a syringe filter (0.45 µm) to remove PM and filter parts. The filter punch was extracted twice and the extracted volumes were pooled and evaporated to 1 ml by N2. Before analysis the sample solvent elution strength was adapted to the mobile phase by adding Milli-Q water (0.8 ml). Concentrations of the individual monosaccharide
an-10
hydrides were determined using a High-Performance Liquid Chromatography (HPLC, Agilent model 1100) instrument combined with High-Resolution Mass-Spectrometry – time-of-flight (HRMS-TOF, Micromass model LCT) operated in the negative electro-spray mode. The compounds were identified by comparison of retention time and mass spectra with authentic standards. The compound separation was performed with two
15
series-connected reversed-phase C18 columns (Atlantis dC18, Waters). The limit of quantification for the method at a signal to noise ratio of ten is approximately 20–40 ng injected of the individual MAs. An isotope labeled standard of mannosan, purchased from Cambridge Isotope Laboratories, was used as internal standard for quantification of the monosaccharide anhydrides.
20
2.4.2 Sugars and sugar-alcohols
Sugars (fructose, glucose, sucrose, trehalose), and sugar-alcohols (arabitol, erythritol, inositol, mannitol), were quantified according to the method described by Yttri et al. (2007b). Briefly, one punch (1.5 cm2) from the quartz fibre filter was soaked in Milli-Q water (1.5 ml) and subjected to ultra sonic agitation (30 min). Each filter was extracted
25
ACPD
11, 7375–7422, 2011Source apportionment of
carbonaceous aerosol
K. E. Yttri et al.
Title Page
Abstract Introduction
Conclusions References
Tables Figures
◭ ◮
◭ ◮
Back Close
Full Screen / Esc
Printer-friendly Version
Interactive Discussion
Discussion
P
a
per
|
Dis
cussion
P
a
per
|
Discussion
P
a
per
|
Discussio
n
P
a
per
|
to remove particulates and filter debris, and evaporated to dryness under an N2 at-mosphere. The dry extract was redissolved in Milli-Q water (100 µl) and isopropanol (300 µl) prior to analysis. The analysis was performed by HPLC/HRMS-TOF analy-sis operated in the negative electrospray mode. The compounds were identified by comparison of retention time obtained by separation on an amino column (Asahipak
5
NH2-2D, 2.0 mm id×150 mm). The limit of quantification of the method at a signal to noise ratio of ten is approximately 30 ng injected of the individual sugars and sugar-alcohols. An isotope-labeled standard of glucose, purchased from Cambridge Isotope Laboratories, was used as internal standard for quantification of the sugars and sugar-alcohols.
10
2.4.3 Cellulose
Free cellulose was determined based on the enzymatic method described by Kunit and Puxbaum (1996). Free cellulose was assumed to be 72% of total cellulose (Ibid.). Fil-ter aliquots of 2 cm2 were eluted with 2.2 ml of 0.05 M citric acid solution (pH of 4.8), containing 0.05% of Thymol to prevent bacterial growth, during 45 min under ultrasonic
15
agitation. The cellulose was then saccharified by two enzymes (Trichoderma reesei cellulase 80 µl 10% and Aspergillus Niger cellobiase 80 µl 1%) during 24 h at 45◦C. After stopping the saccharification by denaturizing the enzymes at 80◦C and centrifug-ing, the supernatant was collected in order to determine D-glucose using a modified test-combination (D-Glucose-HK, Megazyme, Ireland). Glucose was phosphorylated
20
to glucose-6-phosphate, and subsequently oxidized by Nicotinamide adenine dinu-cleotide phosphate (NADP) to gluconate-6-phosphate (G-6-P), with the formation of NADPH, stoichiometrically proportional to the amount of D-glucose originally present. NADPH was quantified by UV photometry at 340 nm, read against distilled water. Free glucose was subtracted from the result. The limit of detection is 160 ng cm−2.
ACPD
11, 7375–7422, 2011Source apportionment of
carbonaceous aerosol
K. E. Yttri et al.
Title Page
Abstract Introduction
Conclusions References
Tables Figures
◭ ◮
◭ ◮
Back Close
Full Screen / Esc
Printer-friendly Version
Interactive Discussion
Discussion
P
a
per
|
Dis
cussion
P
a
per
|
Discussion
P
a
per
|
Discussio
n
P
a
per
|
2.5 Radiocarbon analysis
Prior to the14C analysis, the carbon was extracted from filters (about 75 µg of carbon per filter). This was achieved by first combusting the sample to CO2 in presence of pre-cleaned CuO (powder and needles) and Cu (needles) in a vacuum system. Ele-mental carbon was then produced reducing the CO2to elemental carbon using H2and
5
a heated metal catalyst (about 2 mg of Fe powder, Merck, pro analysis reduced, diam-eter 10 µm, at 450◦C), and Mg(ClO
4)2 (Merck, diameter 1–4 mm) as a drying agent.
The time for complete reduction of each sample was less than 3 h. After complete graphitization the carbon and iron catalyst were pressed into Al sample holders and put on a 40 position sample wheel together with graphitized standards (OxI, IAEA-C6
10
and IAEA-C7) and blanks (anthracite).
The14C analysis was performed by accelerator mass spectrometry at Lund Univer-sity, using a compact, high capacity machine dedicated to radiocarbon dating, as well as to biomedical and environmental research (Skog, 2007; Skog et al., 2010).
3 Source-apportionment methodology
15
The measurements of EC, OC, TC, 14C, levoglucosan, cellulose, sugars and sugar-alcohols in this study provide a set of tracers which provide information on the sources of the observed carbonaceous aerosol (c.f. Table 1). Levoglucosan is used as a tracer of TC from woodburning (TCbb), whereas measurements of cellulose and selected sugar-alcohols (here: mannitol) can be used to determine the contribution of various
20
primary biological aerosol particles (OCPBAP). Measurements of14C help to determine the percentage of modern carbon versus carbon from fossil-fuel sources.
Here we perform a very similar analysis as that of Gelencs ´er et al. (2007), in an effort
to calculate the relative contributions of the main anthropogenic and natural sources of the carbonaceous aerosol. The methodology is updated with newer emissions ratios
25
ACPD
11, 7375–7422, 2011Source apportionment of
carbonaceous aerosol
K. E. Yttri et al.
Title Page
Abstract Introduction
Conclusions References
Tables Figures
◭ ◮
◭ ◮
Back Close
Full Screen / Esc
Printer-friendly Version
Interactive Discussion
Discussion
P
a
per
|
Dis
cussion
P
a
per
|
Discussion
P
a
per
|
Discussio
n
P
a
per
|
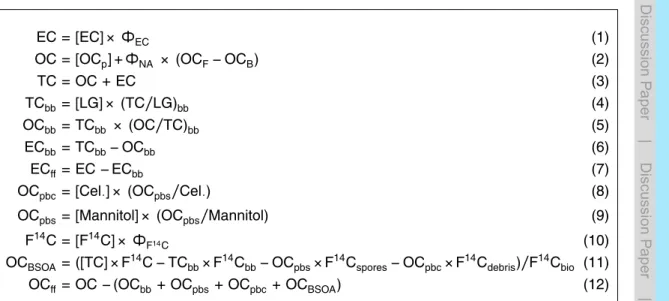
of the sugar-alcohol mannitol. We also make an attempt to account for the negative as well as the positive artifact associated with sampling of OC. The approach used here is summarized in Eqs. (1)–(12), in Table 2, and the terms discussed in Sects. 3.1–3.9. Each step of this analysis has a level of uncertainty, but a major advantage of the present study compared to those presented in e.g., Gelencs ´er et al. (2007) and Szidat
5
et al. (2006, 2009) is that almost all parameters are derived from self-consistent studies from Oslo and surrounding areas. In particular, Yttri et al. (2009) reported very high correlations (R >∼0.9) between levoglucosan and OC in the small town of Elverum, 120 km east of Oslo, during wintertime sampling, and that the wood-burning contribu-tion to OC/EC/TC was close to 100%. Further, related studies by Yttri et al. (2007b,
10
2005) and Dye and Yttri (2005) all provide a comprehensive background to the nature of the carbonaceous aerosol in Norway, and on the contribution of wood-burning and PBAP. These data have a number of advantages for our analysis:
– Location: emission sources at Elverum (type of wood, appliance, etc.) are ex-pected to be similar as those around the sampling sites in the current study.
15
– Consistency of analytical methodology: the analytical methodology used to quan-tify the samples content of EC/OC and levoglucosan in the present study were identical with that reported by Yttri et al. (2009), thus excluding many of the prob-lems associated with differences in analytical methods, e.g. the EC/OC split.
Con-sequently, one does not require any assumptions about the equivalence of the
20
ambient data with those of an emission inventory.
– Consistency of sampling: in the present study the corrections for the positive sampling artifact of OC are consistent with the procedures of Yttri et al. (2009).
Uncertainties still remain of course, and following Gelencs ´er et al. (2007) we define both a central best-estimate value for each factor and a plausible range of uncertainty.
25
In order to tackle the multitude of possible combinations of uncertain parameters, we have made use of an effective statistical approach known as Latin-hypercube
ACPD
11, 7375–7422, 2011Source apportionment of
carbonaceous aerosol
K. E. Yttri et al.
Title Page
Abstract Introduction
Conclusions References
Tables Figures
◭ ◮
◭ ◮
Back Close
Full Screen / Esc
Printer-friendly Version
Interactive Discussion
Discussion
P
a
per
|
Dis
cussion
P
a
per
|
Discussion
P
a
per
|
Discussio
n
P
a
per
|
are somewhat similar to Monte Carlo calculations, and allow vast numbers of com-binations of input variables to be computed. A Monte-Carlo simulation would in-volve testing all possible combinations of input parameters. LHS provides a much more effective way of sampling the data, and for our purposes provides essentially
the same results as a full Monte-Carlo analysis. We used the software available
5
at http://people.scs.fsu.edu/∼burkardt/f src/ihs/ihs.html for this purpose. Due to the paucity of information on the input factors, parameters are (unless otherwise noted be-low) assigned equally between the low limit and the central value and between the cen-tral value and the high limit. All valid combinations of parameters (i.e. excluding those producing negative contributions) are condensed in frequency distributions of possible
10
solutions. Table 3 describes the equations that are used for the source-apportionment analysis, and Table 3 summarizes the best-estimates and range of uncertainty for each factor. The rationale for each value is provided in Sects. 3.1–3.9.
3.1 Estimation of EC, c.f. Eq. (1)
As discussed extensively by Schmid et al. (2001), different analytical methods give
15
rather similar values for TC, but very different values for EC; i.e. more than a factor of 2
differences for EC concentrations measured by various techniques. Ideally, the same
analytical method should be used when establishing the emission ratios including EC (e.g. (OC/EC)bb) as that used for analysis of the ambient aerosol content of EC. Since thermal-optical analysis, used in the present study, is the most accepted and widely
20
used technique for EC measurements and also used for the emission ratio assumptions in the present study, we have adopted a narrower range of uncertainty,ΦEC, than that
found by Schmid et al. (2001), with low, central and best estimates of 0.75, 1.0 and 1.25.
3.2 Estimation of OC, TC, c.f. Eqs. (2), (3)
25
ACPD
11, 7375–7422, 2011Source apportionment of
carbonaceous aerosol
K. E. Yttri et al.
Title Page
Abstract Introduction
Conclusions References
Tables Figures
◭ ◮
◭ ◮
Back Close
Full Screen / Esc
Printer-friendly Version
Interactive Discussion
Discussion
P
a
per
|
Dis
cussion
P
a
per
|
Discussion
P
a
per
|
Discussio
n
P
a
per
|
discussed by Chow et al. (2010), the positive artifact is usually bigger than the neg-ative one. We assume this to be true for the Nordic countries as well, thus, the true OC should lie between the measured front and back filter values, i.e. between OCF and OCB. Hence, we make use of theΦNAterm in Eq. (2), and have assigned the low,
central, and high value of OC to be OCp, OCp+0.2×(OC
F−OCB), OCF.
5
Given EC and OC, TC is derived simply as EC+OC (Eq. 3).
3.3 Estimation of TCbb, c.f. Eq. (4)
On a mass basis, the largest source of biomass burning emission in Norway, and neighbouring countries, is wood burning in stoves and fireplaces used for residential heating. Wildfires may occassionally impact PCM in Norway (Tsyro et al., 2007; Yttri
10
et al., 2007a), but the contribution seems to be low in general. During the summer-time measurement period in the current study, no nearby fire-activity was detected by MODIS (http://modis-fire.umd.edu).
Levoglucosan (LG) is emitted in high concentrations from wood burning and is re-garded as a highly useful tracer of wood burning emissions (e.g. Schauer et al., 2001;
15
Simoneit, 2002). A large number of studies concerning the emission ratio [(OC/LG)bb or (TC/LG)bb] is available, and their suitability with respect to European conditions has been discussed by Gelencs ´er et al. (2007); Puxbaum et al. (2007) and Simpson et al. (2007).
Here we make use of the emission ratios estimated by Yttri et al. (2009) for
Nor-20
wegian urban areas, reporting a best-fit (TC/LG)bb ratio of 20 for PM10 and 16 for PM2.5, based upon a quartz-behind-teflon (QBT) sampling protocol. In the present study, levoglucosan was collected on a quartz-behind-quartz fiber filter setup (QBQ), which have been shown to retain some levoglucosan compared to Teflon filters (Dye and Yttri, 2005). Based upon Dye and Yttri (2005), we have applied a factor of 0.76 for
25
ACPD
11, 7375–7422, 2011Source apportionment of
carbonaceous aerosol
K. E. Yttri et al.
Title Page
Abstract Introduction
Conclusions References
Tables Figures
◭ ◮
◭ ◮
Back Close
Full Screen / Esc
Printer-friendly Version
Interactive Discussion
Discussion
P
a
per
|
Dis
cussion
P
a
per
|
Discussion
P
a
per
|
Discussio
n
P
a
per
|
It is hard to prove if modern carbon is due to biomass burning or other sources of modern carbon, e.g. BSOA. Thus, we regard the TCbb values derived here from lev-oglucosan as an “operational” definition. As noted in Szidat et al. (2009), OCbb when derived from ambient (OC/LG)bb measurements may be higher when compared to data derived from ratios from laboratory emission studies, as the data derived from
am-5
bient measurements include some condensed and secondary OC. Indeed, Grieshop et al. (2009b,a) demonstrated in smog chamber experiments that wood-burning SOA actually may reach up to similar levels as POA. The ratios used in the present study were derived from wintertime ambient measurements (Yttri et al., 2009) and may also include condensed vapors.
10
3.4 Estimation of OCbb, ECbb, ECff, c.f. Eqs. (5)–(7)
Analysis of the Yttri et al. (2009) data suggests best values for (OC/TC)bb of 0.78 for PM10 and 0.71 for PM2.5. In general the range of variation of this ratio was small, with the uncertainty range given in Table 3 encompassing most points. Given TCbb and OCbb, ECbbis the difference, Eqs. (5), (6).
15
ECffis derived simply as the difference between EC and ECbb (Eq. 7).
3.5 Estimation of OCpbc from plant debris, c.f. Eq. (8)
Similar to Gelencs ´er et al. (2007) and S ´anchez-Ochoa et al. (2007) the contribution of plant debris to the carbonaceous aerosol is estimated from the measured amount of free cellulose. Free cellulose forms on average about 72% of total cellulose. Further, for
20
the mass balance the amount of plant debris has to be expressed in carbon equivalent, which is about 57% of the total mass. Plant debris is assumed to be about two times the concentration of total cellulose (Puxbaum and Tenze-Kunit, 2003). Thus, measured cellulose concentrations were multiplied by a factor of 1.6 (=0.57×2/0.72) as a
best-estimate of the contribution of OCpbc on a carbon equivalent basis. As in Gelencs ´er
25
ACPD
11, 7375–7422, 2011Source apportionment of
carbonaceous aerosol
K. E. Yttri et al.
Title Page
Abstract Introduction
Conclusions References
Tables Figures
◭ ◮
◭ ◮
Back Close
Full Screen / Esc
Printer-friendly Version
Interactive Discussion
Discussion
P
a
per
|
Dis
cussion
P
a
per
|
Discussion
P
a
per
|
Discussio
n
P
a
per
|
3.6 Estimation of OCpbs from fungal spores, c.f. Eq. (9)
OCpbs is calculated from mannitol. Bauer et al. (2008a) found that mannitol accounted for 1.2–2.5 pg spore−1 and that the spores OC content was 13 pg OC spore−1 (Bauer et al., 2002). This indicates that OCpbs to mannitol ratios are ranging from 5.2–10.8.
A mean mannitol-to-arabitol ratio of 1.5±0.5 can be deduced from the study of Bauer
5
et al. (2008a). The 24 h mean mannitol-to-arabitol ratios observed for PM10in summer (Oslo: 1.4±0.3; Hurdal: 1.3±0.5) in the present study (Table 5) were within the range reported by Bauer et al. (2008a), thus justifying our use of their findings. During winter the ratio was slightly lower (Oslo: 1.1±0.3; Hurdal: 1.3±0.5) and the variation greater, for unknown reasons. Further, the mannitol-to-arabitol ratio had a diurnal variation in
10
summer, with a higher ratio during night compared to the day. This could indicate influence from various genera of fungi.
3.7 Estimation of F14C, F14Cbb, F14CsporesEq. (10)
F14C is the so-called modern fraction of 14C, indicating of the amount of contempo-rary carbon in the aerosol. Fossil-fuels have F14C values of zero, and recently grown
15
vegetation has F14C values close to 1. A F14C value of 1.0 approximately refers to conditions before the atomic bomb tests of the 1950s (Currie et al., 2002). The aver-age14C signature of atmospheric CO2for the two years (2006, 2007) during which the sampling campaigns of the present study was conducted gives F14C=1.055 (Szidat
et al., 2009). The measured value of F14C in an aerosol sample, [F14C], is one of the
20
most accurately measured quantities in these analyses, but still has a small uncertainty due to both measurement errors and heterogeneity on the filters. We allow for a small error, of±5%, and use an uncertainty factorΦF14C(0.95–1.05) and symmetrical beta (2,2) distribution (NIST/SEMATECH, 2010) to assign probabilities around the central value. The 14C signature of biomass burning emissions (F14Cbb) is generally
uncer-25
ACPD
11, 7375–7422, 2011Source apportionment of
carbonaceous aerosol
K. E. Yttri et al.
Title Page
Abstract Introduction
Conclusions References
Tables Figures
◭ ◮
◭ ◮
Back Close
Full Screen / Esc
Printer-friendly Version
Interactive Discussion
Discussion
P
a
per
|
Dis
cussion
P
a
per
|
Discussion
P
a
per
|
Discussio
n
P
a
per
|
burning of trees (Lewis et al., 2004; Szidat et al., 2006). For plant debris, we have assumed a recent biological origin, F14Cdebris=1.055.
Asco- and Basidiomycota (ABM) are heterotrophic organisms, i.e. they require car-bon for growth and energy but cannot fix carcar-bon themselves. ABM can acquire organic molecules from dead organic material, (e.g. dead plant leaves, logs, etc.), so-called
5
decomposers, or as symbionts. Formation of mycorrhiza, which is a symbiotic asso-ciation between quite a few ABM and the root systems of plants, makes the fungus benefit from photosynthetic products produced by the tree, which has a recent origin; i.e. F14C similar to plant debris (1.055). Decomposers may live on old as well as re-cent substrate, thus in order to account for this we allow for a wider range of F14Cspores
10
(1.055–1.25) than for plant debris.
3.8 Estimation of OCBSOA, c.f. Eq. (11)
OCBSOAis calculated from the radiocarbon balance equation (Eq. 11), assuming mod-ern origin (F14Cbio=1.055) for this aerosol component. As BSOA is thought to be
generated mainy from isoprene and monoterpenes (e.g. Hallquist et al., 2009), and
15
these originate from recent foliage, the radiocarbon signature should be well defined.
3.9 Estimation of OCff, c.f. Eq. (12)
Finally, OCff is defined as the difference between OC and the sum of OCBSOA, OCpbs,
OCpbc and OCbb. Unlike Gelencs ´er et al. (2007) we have not separated OCff into primary and secondary as the partitioning theory presented by Robinson et al. (2007)
20
and Donahue et al. (2006) suggests that these two components are extremely difficult
ACPD
11, 7375–7422, 2011Source apportionment of
carbonaceous aerosol
K. E. Yttri et al.
Title Page
Abstract Introduction
Conclusions References
Tables Figures
◭ ◮
◭ ◮
Back Close
Full Screen / Esc
Printer-friendly Version
Interactive Discussion
Discussion
P
a
per
|
Dis
cussion
P
a
per
|
Discussion
P
a
per
|
Discussio
n
P
a
per
|
4 Results
4.1 PM10 and PM1mass concentrations
Mean concentrations of PM10and PM1are presented in Table 4. These values are sim-ilar to annual mean concentration ranges of PM10 and PM2.5/PM1 previously reported for Norwegian urban and rural environments (Yttri, 2007). The rather short duration of
5
the two sampling periods conducted in the present study could influence their repre-sentativeness; e.g. summer time concentrations are found to be higher than or equal to the concentrations observed during winter, which is opposite of that commonly seen (Yttri, 2007). PM1accounted for a larger fraction of PM10 at the rural background site compared to the urban background site. Also, the PM1-to-PM10 ratio was higher in
10
winter compared to summer.
4.2 EC and OC concentrations
The carbonaceous aerosol (here: EC, OCp, TCp) concentrations (see Table 4) ob-served at the urban background site is in the lower range of that previously reported for Norwegian urban areas (Yttri et al., 2005, 2009), whereas it is in the upper range
15
of what has been observed for the rural environment (Yttri et al., 2007a). The levels of OCp and TCp should be considered as conservative estimates, as the QBQ sam-pling approach account for the positive but not the negative samsam-pling artefact of OC (see Sect. 2.2).The mean positive artifact of OC ranged from 18±8.6% for the urban background site in winter to 50±14% at the rural background site in winter.
20
The difference between the urban- and the rural background site with respect to the
OCplevel is relatively small in summer (25–30% higher at the urban background site), whereas the difference was substantially larger (a factor 2.4–2.8 higher at the urban
background site) in winter. EC had a similar pattern, with urban background levels being 50% higher compared to the rural background site in summer and a factor of
25
ACPD
11, 7375–7422, 2011Source apportionment of
carbonaceous aerosol
K. E. Yttri et al.
Title Page
Abstract Introduction
Conclusions References
Tables Figures
◭ ◮
◭ ◮
Back Close
Full Screen / Esc
Printer-friendly Version
Interactive Discussion
Discussion
P
a
per
|
Dis
cussion
P
a
per
|
Discussion
P
a
per
|
Discussio
n
P
a
per
|
Levels of OCpin PM10were higher in summer than during winter at the urban back-ground site, whereas it is opposite for PM1. For EC, levels were higher in winter for both size fractions. At the rural background site, levels of OCpwere substantially higher in summer compared to winter. This seasonal variation was more pronounced for PM10 than for PM1. For EC, a similar pattern as for OCpwas observed for PM10, whereas for
5
PM1the levels remained unchanged.
Only minor differences in the EC/TCp ratio were observed between the two sites,
regardless of season and size fraction. The EC/TCpratio was found to be substantially higher in winter (27–31%) compared to summer (16–21%) at both sites and for both size fraction.
10
4.3 Organic tracers concentrations
Ambient mean concentrations of the wood burning tracer levoglucosan are reported in Table 4. The mean concentration observed at the urban background site in winter (130 ng m−3) was lower than that previously reported by Yttri et al. (2005) for
Nor-wegian urban areas during winter time sampling (i.e. 166–407 ng m−3). At the rural
15
background site, the winter time mean levoglucosan concentration (40 ng m−3) was 2– 3 times higher than that reported by Yttri et al. (2007b) for the rural background site Birkenes in Southern Norway. The levoglucosan concentration was 3–5 times higher in winter compared to summer.
Levels of sugars and further sugar alcohols (see Table S1 of the Supplementary
ma-20
terial) were within the range previously reported for Scandinavian and continental rural (Carvalho et al., 2003; Ion et al., 2005; Yttri et al., 2007b) and urban background (Yttri et al., 2007b) environments in Europe. Higher concentrations in summer compared to winter were observed for all species. In summer, the highest concentrations were seen at the rural background site (except for ribose), whereas it was the opposite way
25
ACPD
11, 7375–7422, 2011Source apportionment of
carbonaceous aerosol
K. E. Yttri et al.
Title Page
Abstract Introduction
Conclusions References
Tables Figures
◭ ◮
◭ ◮
Back Close
Full Screen / Esc
Printer-friendly Version
Interactive Discussion
Discussion
P
a
per
|
Dis
cussion
P
a
per
|
Discussion
P
a
per
|
Discussio
n
P
a
per
|
PM10. A similar calculation could not be performed for the samples collected during the winter campaign.
The content of cellulose in the ambient aerosol has been reported in a very few stud-ies only (Kunit and Puxbaum, 1996; Puxbaum and Tenze-Kunit, 2003; S ´anchez-Ochoa et al., 2007). The cellulose concentrations observed in the present study, ranging
5
from 5–130 ng m−3, are comparable to those observed for the European rural
back-ground environment by S ´anchez-Ochoa et al. (2007), as is the seasonal variation with increased concentrations in summer.
4.4 Radiocarbon, F14C
The F14C values are reported in Table 4. We find that F14C was higher at the rural
10
background site compared to the urban background site, regardless of season and size fraction. In addition, F14C was typically higher in summer compared to winter at both sites. The F14C values show no diurnal variation, except for PM1 at the urban background site in winter; i.e. F14C was 0.70 during the night and 0.59 during the day.
F14C appears to be in the upper range of, or higher than, values reported for
Euro-15
pean and US urban and rural areas by Glasius et al. (2011).
4.5 Source apportionment analysis
The best estimate concentration, the 10th and the 90th percentile of the carbonaceous fractions in PM10 and PM1, as calculated by Latin Hypercube Sampling (LHS) are presented in Fig. 1 and Tables S2–S5 of the supplementary material, whereas the
20
ACPD
11, 7375–7422, 2011Source apportionment of
carbonaceous aerosol
K. E. Yttri et al.
Title Page
Abstract Introduction
Conclusions References
Tables Figures
◭ ◮
◭ ◮
Back Close
Full Screen / Esc
Printer-friendly Version
Interactive Discussion
Discussion
P
a
per
|
Dis
cussion
P
a
per
|
Discussion
P
a
per
|
Discussio
n
P
a
per
|
5 Discussion
The results of the source-apportionment analysis, presented in Fig. 1 and Tables 6– 9 (also Tables S2–S4) show broad scale features similar to those found in previous studies: large contributions of wood-burning in winter time and large contributions of BSOA in summertime. We discuss the major components in Sects. 5.1–5.5 and in
5
Sect. 5.6 we present an estimate of the contribution of the organic aerosol components to the total PM1and PM10 mass concentrations.
5.1 Carbonaceous aerosol from fossil-fuel sources and biomass burning
OC originating from fossil-fuel sources (OCff) was more abundant than OC from wood burning (OCbb) during summer, whereas it was the other way around in winter (see
10
Tables S2–S5). Further, there was an urban background increment with respect to both OCff and OCbb compared to the rural background site: i.e. the mean concentration of OCff and OCbbwas 1.8–3.5 times higher at the urban background site than at the rural background site, both seasons and size fractions included.
We find that there is almost no difference in the relative contribution of OCff (26–
15
29%) and OCbb (33–38%) to TCp in winter between the two sites, both size fractions included, and that wood burning was the major source. It might be that the rather high ambient temperature observed during the winter campaign (i.e. 2.2◦C compared to the long term mean of−1.5◦C at the urban background site) had an influence on the levoglucosan concentration, which was relatively low compared to previously reported
20
studies (Yttri et al., 2005). In summer, the relative contribution of OCff to TCp was higher than that of OCbb to TCp at both the urban (OCff to TCp=20–27%; OCbb to
TCp=12–16%) and the rural background site (OCffto TCp=7–12%; OCbbto TCp=4–
5%).
Combustion of fossil fuel was the major source of EC regardless of site, season, size
25
ACPD
11, 7375–7422, 2011Source apportionment of
carbonaceous aerosol
K. E. Yttri et al.
Title Page
Abstract Introduction
Conclusions References
Tables Figures
◭ ◮
◭ ◮
Back Close
Full Screen / Esc
Printer-friendly Version
Interactive Discussion
Discussion
P
a
per
|
Dis
cussion
P
a
per
|
Discussion
P
a
per
|
Discussio
n
P
a
per
|
background site, ranging from 1.3–3.2. As expected, the concentrations of ECbbgrew larger in winter due to increased emissions from residential wood burning, accounting for 30–40% of EC compared to 10–20% in summer. A similar seasonal variation was reported by Szidat et al. (2006) for an urban background site in Zurich, using a com-bination of14C and organic tracer analysis, however the ECbb contribution to EC was
5
slightly less in Zurich than is Oslo, i.e. 6±2% in summer and 25±5% in winter. ECbb and OCbb concentrations typically increased somewhat during night, which in the present study was defined from 9 a.m.–9 p.m. Thus, the night only partly reflects the time period when people usually use their wood stoves for heating, i.e. between 5 a.m. and 11 a.m. and to some extent between 6 p.m. and 9 p.m. (Haakonsen and Kvingedal,
10
2001). This may explain why the diurnal variation was not more pronounced. Some-what surprising the diurnal variation was most evident during summertime sampling. It is not obvious what caused this, but reasons might include larger day/night changes in dispersion conditions, or shifts in the timing of residential or barbeque-related wood-burning emissions.
15
5.2 Biogenic secondary organic aerosol, OCBSOA
OCBSOA was a major contributor to the carbonaceous aerosol in summer, accounting for 56% of TCp in the PM10 fraction at the rural background site and 36% at the ur-ban background site. For PM1, OCBSOA was even more pronounced, constituting 68% of TCp at the rural background site and 38% at the urban background site. Summer
20
time OCBSOA concentrations ranging from 1.6–2.3 µg C m−3 was observed for PM
10,
whereas the range was 1.1–2.0 µg C m−3 for PM
1. A profound diurnal and seasonal
variation was observed, with OCBSOAconcentrations being 1.4–1.5 times higher during daytime sampling compared to nighttime sampling, and concentrations being 1.4–1.8 times higher at the rural background site compared to the urban background site. In
25
ACPD
11, 7375–7422, 2011Source apportionment of
carbonaceous aerosol
K. E. Yttri et al.
Title Page
Abstract Introduction
Conclusions References
Tables Figures
◭ ◮
◭ ◮
Back Close
Full Screen / Esc
Printer-friendly Version
Interactive Discussion
Discussion
P
a
per
|
Dis
cussion
P
a
per
|
Discussion
P
a
per
|
Discussio
n
P
a
per
|
to be somewhat higher at the urban background site than at the rural background site in winter. The latter effect is presumably due to the increased condensational
frac-tion of BSOA compounds that can arise in areas of high total OA concentrafrac-tions (e.g. Donahue et al., 2009).
5.3 Primary biological aerosol particles OCPBAP
5
Fungal spores and plant debris are likely the major sources of OCPBAP. In the present study, OC associated with fungal spores (OCpbs) and plant debris (OCpbc) was calcu-lated based on the aerosol filter samples content of mannitol and cellulose, respec-tively. The results show that OCPBAP (here: OCPBAP=OCpbs+OCpbc) comprised on
average 16% of TCp in PM10 at the urban background site and 24% of TCp in PM10
10
at the rural background site in summer. OCpbs and OCpbc contributed approximately equally to TCp at the urban background site, whereas the fungal spore contribution was almost three times higher than that of plant debris at the rural background site. In winter, the OCPBAP contribution to TCp was substantially lower than in summer. A higher relative contribution of OCPBAP to TCp at the rural site (7.8%) compared to
15
the urban site (2.6%) was consistent with the pattern observed in summer. One major difference observed during winter compared to summer was that plant debris totally
dominated OCPBAP at the rural background site. For PM1, the relative contribution of OCPBAP to TCp did not exceed 2% regardless of season and site. From the results presented in Table 4 we find that OCPBAPconstituted 72% of TCp,PM
10−1 (1.3 µg C m −3
)
20
at the rural background site in summer, which we consider to be a very high share. OCPBAP comprised a considerable contribution (44%) to TCp,PM10
−1 (1.6 µg C m −3
) at the urban background site as well. The abundance of OCPBAP in the Scandinavian ru-ral background environment, its pronounced seasonal variation, as well as its presence in the coarse fraction of PM10 have previously been addressed and reported by Yttri
25
ACPD
11, 7375–7422, 2011Source apportionment of
carbonaceous aerosol
K. E. Yttri et al.
Title Page
Abstract Introduction
Conclusions References
Tables Figures
◭ ◮
◭ ◮
Back Close
Full Screen / Esc
Printer-friendly Version
Interactive Discussion
Discussion
P
a
per
|
Dis
cussion
P
a
per
|
Discussion
P
a
per
|
Discussio
n
P
a
per
|
Our results confirm that OCPBAP is an important source of the carbonaceous aerosol both in the rural and the urban background environment.
As OCPBAP typically reside in the coarse fraction of PM10, local sources can have a relatively large impact on concentrations. The apparent similarity of PBAP seen for Oslo and Hurdal is misleading: there are great differences in the relative composition
5
of OCPBAP with respect to OCpbs and OCpbc at the two sites (see above), implying that different source types contribute to OCPBAP at the two sites. This is further supported
by the diurnal and seasonal variation of the individual sugars and sugar-alcohols (Ta-ble S1). For example, arabitol, mannitol and trehalose in PM10 all peak during the night at the rural background site in summer, which likely reflects nocturnal discharge
10
of fungal spores (Graham et al., 2003; Ion et al., 2005), while this is not observed at the urban background site. We also find that the individual concentrations of all sugars and sugar-alcohols are higher at the urban background site than for the rural background site in winter.
5.4 Natural versus anthropogenic sources of the carbonaceous aerosol
15
Carbonaceous aerosols arising from fossil-fuel sources and biomass combustion (ECbb, ECff, OCbb and OCff) are here defined as anthropogenic emissions. Wild fire emissions can obviously be categorized as natural in cases when ignited by lighten-ing, but most incidences are due to human activity (Achard et al., 2008; Winiwarter et al., 1999). However, as noted in Sect. 3.1 no nearby fire-activity was detected by
20
MODIS for this summertime measurement period. OCBSOA and OCPBAP are defined as natural sources, although anthropogenic emissions facilitate the transformation of biogenic VOCs to OCBSOA(Tsigaridis and Kanakidou, 2003; Carlton et al., 2010; Don-ahue et al., 2009) and increased concentrations of OCPBAPhas been found in associa-tion with sewage plants and are associated with other anthropogenic activities as well,
25
ACPD
11, 7375–7422, 2011Source apportionment of
carbonaceous aerosol
K. E. Yttri et al.
Title Page
Abstract Introduction
Conclusions References
Tables Figures
◭ ◮
◭ ◮
Back Close
Full Screen / Esc
Printer-friendly Version
Interactive Discussion
Discussion
P
a
per
|
Dis
cussion
P
a
per
|
Discussion
P
a
per
|
Discussio
n
P
a
per
|
As expected, emissions from natural sources were found to be particularly abundant in summer, and with a more pronounced influence of natural sources at the rural-compared to the urban background site. At the rural background site, 80% of TCp in PM10 and 70% of TCpin PM1could be attributed to natural sources. The slightly lower percentage seen for PM1 is due to OCPBAPprimarily residing in the coarse fraction of
5
PM10. Natural sources accounted for about half (51%) of TCp in PM10 at the urban background site as well. As for the rural background site, the relative contribution of natural sources to TCpin PM1(39%) at the urban background site was slightly less than for PM10, but still quite substantial taken into account that it is an urban site. The natural source contribution was always dominated by OCBSOA, regardless of season, site and
10
size fraction. During winter the picture was reversed, as anthropogenic sources totally dominated the carbonaceous aerosol (83–90%), whereas no more than 10–17% could be explained by natural sources. Combustion of biomass contributed slightly more than combustion of fossil fuel in winter, whereas emissions from fossil fuel combustion were more abundant in summer.
15
5.5 Consistency of results
The challenges associated with splitting OCPBAP, OCbband OCBSOAhave already been mentioned (see Sect. 3.3). As we have calculated the two major contributors to PBAP, i.e. OC associated with plant debris and fungal spores, the dominating uncertainty factors for OCBSOA have been accounted for. On the other hand, the vast number of
20
sources contributing to this highly heterogeneous group still makes the split between OCBSOA and OCPBAP somewhat uncertain. For example, Ceburnis et al. (2011) re-cently demonstrated a major impact of fine mode PBAP derived from plankton from the marine environment at Mace Head on the West coast of Ireland, which is not ac-counted for by the PBAP tracers used in the present study. Tire debris is also a source
25
ACPD
11, 7375–7422, 2011Source apportionment of
carbonaceous aerosol
K. E. Yttri et al.
Title Page
Abstract Introduction
Conclusions References
Tables Figures
◭ ◮
◭ ◮
Back Close
Full Screen / Esc
Printer-friendly Version
Interactive Discussion
Discussion
P
a
per
|
Dis
cussion
P
a
per
|
Discussion
P
a
per
|
Discussio
n
P
a
per
|
Emissions from cooking could make a significant contribution to contemporary car-bon at the urban background site, while we find this less likely at the rural background site. Analysis of cholesterol from the filters could have provided valuable information on this matter, but such measurements have not been undertaken.
Nevertheless, the seasonality, the diurnal variation, and the regional character
ob-5
served for OCBSOAstrongly support that BSOA has been quite successfully separated from other sources of contemporary carbon.
5.6 Mass closure of PM
Converting the ambient aerosol OC fraction to organic matter (OM) with a high level of accuracy requires detailed speciation of OC at a level which currently is not available.
10
Further, using one fixed conversion factor will inevitably introduce an unknown level of uncertainty, as the source contribution varies between sites and seasons. By segre-gating OC into sub-fractions, and by using conversion factors for each of these, more accurate estimates of the aerosol OM fraction may be obtained. However, experimen-tally derived conversion factors are still scarce and would be needed for a wider range
15
of environments to reduce the uncertainty further.
Reviewing theoretic and historic experimental conversion factors, Turpin and Lim (2001) concluded that a range of 1.9–2.3 would cover the aged aerosol, whereas 2.2– 2.6 would be representative for the aerosol originating from biomass burning. A factor of 1.2–1.5 was suggested for water insoluble carbonaceous material. Their estimate
20
for the aged aerosol has been supported by the experimentally derived conversion factor for the rural background site K-puszta in Hungary, ranging from 1.9–2.0 (Kiss et al., 2002), whereas a conversion factor of 1.1 was derived for EC. Recently, OC : OM ratios derived from aerosol mass spectrometer (AMS) measurements have become available, which have confirmed conversion factors around 2 for the aged aerosol and
25
ACPD
11, 7375–7422, 2011Source apportionment of
carbonaceous aerosol
K. E. Yttri et al.
Title Page
Abstract Introduction
Conclusions References
Tables Figures
◭ ◮
◭ ◮
Back Close
Full Screen / Esc
Printer-friendly Version
Interactive Discussion
Discussion
P
a
per
|
Dis
cussion
P
a
per
|
Discussion
P
a
per
|
Discussio
n
P
a
per
|
a conversion factor of 2.0 for OC from wood burning (OCbb) and for SOA. Although we have preferred not to split OCff into primary and ASOA contributions through this text, such a split does exist in the LHS processing, with OCASOA estimated to contribute between 41 and 69% of OCff. We accordingly use a factor 2 for the ASOA fraction, and a factor 1.2 for the primary fraction of OCff. A conversion factor of 1.75 was used for
5
OCpbs and OCpbs, and 1.1 for ECbb and ECff.
Figures 2 and 3 illustrate the results of this mass closure estimates. These show that that particulate carbonaceous matter, i.e. OM + EC, likely dominated the mass
concentration of the ambient PM regardless of size fraction, season, and site category. In general, there were no pronounced differences in the relative contribution of
car-10
bonaceous matter to PM with respect to season or between the two sites. A somewhat larger fraction of PM1(64–69%) was accounted for by carbonaceous matter compared to PM10(51–67%). The likely explanation for this similarity is simply that Oslo is a rel-atively small city (ca. 0.6 million inhabitants). Both sites are strongly influenced by long-range transport, providing a common background, and local activities such as
15
wood-burning for heating take place inside Oslo as well as in the countryside affecting
Hurdal.
The substantial contribution of carbonaceous aerosol from natural sources to the PM loading in summer should be emphasized. We found that about 30% of the urban background PM1 and PM10 could be attributed to natural sources, whereas for the
20
rural background site the contribution was 52–57%. In, winter no more than 7–11% of the PM loading could be attributed to natural sources. Due to the rather low PM experienced during this wintertime sampling at the urban background site (mean PM10 mass concentration of 10.3 µg m−3, compared to 19.1
±4.0 µg m−3 for all Norwegian urban background sites for 2009–2010), we assume that the contribution of natural
25
ACPD
11, 7375–7422, 2011Source apportionment of
carbonaceous aerosol
K. E. Yttri et al.
Title Page
Abstract Introduction
Conclusions References
Tables Figures
◭ ◮
◭ ◮
Back Close
Full Screen / Esc
Printer-friendly Version
Interactive Discussion
Discussion
P
a
per
|
Dis
cussion
P
a
per
|
Discussion
P
a
per
|
Discussio
n
P
a
per
|
6 Conclusions
Source apportionment of the ambient summer- and winter time carbonaceous aerosol (PM10 and PM1) has been conducted for one urban and one rural background envi-ronment site in Norway. Statistical treatment of data from thermal optical, 14C and organic tracer analysis using Latin Hypercube Sampling has allowed for quantitative
5
estimates of seven different sources contributing to the ambient carbonaceous aerosol.
These are: elemental carbon from combustion of biomass (ECbb) and fossil fuel (ECff), organic carbon from combustion of biomass (OCbb) and fossil fuel (OCff, which in-cludes both primary and secondary components), primary biological aerosol particles (OCPBAP) from plant debris (OCpbc) and fungal spores (OCpbs), and secondary organic
10
aerosol from biogenic precursors (OCBSOA). Hence, this approach makes it possible to separate between natural and anthropogenic sources, which is highly important in order to sort out abatement strategies for reducing man-made emissions.
The results show that particulate carbonaceous matter (PCM) dominated (51–69%) the ambient PM loading at these Norwegian urban and rural background sites,
regard-15
less of season (summer/winter) and size fraction (PM10/PM1).
Natural sources (here: BSOA and PBAP) contributed substantially to the rural (70– 80%) and the urban background (39–51%) of total carbon (TCp) loading during sum-mer for both size fractions. The natural contribution was dominated by BSOA both for the rural (56–68% of TCp) and the urban background environment (36–38% of TCp),
20
but also primary biological aerosol particles (PBAP) were found to make a noticeable contribution, (e.g. PBAP accounted for 24% of TCp in PM10 at the rural background site).
Anthropogenic sources (ECff, ECbb, OCff, OCbb) contributed the most (>80%) to TCp during winter, regardless of size fraction and environment. Fossil-fuel derived sources
25