THE IMPACT OF IFRS ON REPORTING FOR BUSINESS COMBINATIONS:
AN IN-DEPTH ANALYSIS USING THE TELECOMMUNICATIONS INDUSTRY
Carrara Mario Brescia, Italy
Diogenis Baboukardos
Jönköping International Business School Jönköping Sweden Gary M. Cunningham
Jönköping International Business School Jönköping Sweden Lars G. Hassel
Åbo Akademi University Turku, Finland
The mandatory use of IFRS by all publicly listed companies in the European Union created challenges for accounting and reporting of business combinations, goodwill impairment and disclosures for these items. Major issues are allocation of amounts to goodwill and specific intangible assets arising from acquisition. This study presents an in-depth exploration of compliance with IFRS 3 and IAS 36 using content analysis methodology of annual reports of eight European telecommunications that were chose because the industry is well known for significant acquisitions involving intangibles. The results show only partial compliance with little change over the four year period since mandatory IFRS adoption. While results cannot be generalized outside this group, the in-depth analysis yielded important insights for continued research using broader research methods.
Key words: IFRS, business combinations, goodwill, content analysis, annual reports, listed companies
JEL codes: M41, M21, G34
Approximately coinciding with the EU mandate, the IASB adopted IFRS 3 and amended IAS 36 in 2004. IFRS 3 addresses, among other things, the allocation of purchase price on acquisitions especially allocation to previously unrecorded intangible assets and residual amounts to unallocated goodwill. IAS 36 as amended focused on asset impairments, including impairment of unallocated goodwill. IFRS 3 and IAS 36 address many of the inconsistent and contentious issues of financial reporting for business combinations, attempting to provide standardization, accountability and transparency throughout all countries adopting IFRS, including the EU. Business combinations are one of the primary areas addressed by the International Accounting Standards Board (IASB) in IFRS 3 and IAS 36 in which the board seeks to provide significant and reliable information, especially for unallocated goodwill, for which there has been considerable creativity in the past (Forbes, 2007). Surveys of investors indicate the investors believe IFRS 3, especially, has a real impact on how they perceive companies and make their investment decisions because complying with IFRS 3 provides more transparency about companies (PricewaterhouseCoopers, 2006).
Despite discussions both extolling and questioning the virtues of mandatory adoption of IFRS, specifically with respect to business combinations, only recently there have begun to be research studies about whether the mandatory use of IFRS has achieved its purported objectives. The only study with which we are familiar that directly addresses issues of business combinations in Europe is Paananen (2008) who examined information provided about initial recognition of goodwill under IFRS3, although there have been other studies, discussed and cited below, about IFRS adoption in general. This study explores the extent to which European companies are complying with the mandate to report using IFRS with respect to business combinations and how the level of compliance may have changed in the years following the mandate. Thus, this study adds to this small but growing body of research literature with an in-depth examination of financial reporting of business combinations by European companies in the telecommunications industry for four years after mandatory adoption.
Telecommunication companies are used for the study because there have been several significant acquisitions in the industry and telecommunications companies have significant intangible assets that must be considered in allocation of purchase prices. The research method is content analysis in which there is an in depth review and analysis of financial reports for the companies chosen before 2005 and for the period 2005 through 2008. Remaining sections next discuss issues related to financial reporting of business combinations and subsequent impairment testing and present two research questions. Then we present prior research on the issues. Then we present the research methodology. Finally, results are presented followed with a concluding discussion.
1.0. Financial accounting and reporting for business combinations
Accounting and financial reporting issues for business combinations can be categorized in two broad general topic areas, although there are overlaps and any categorization has the risk of being over simplified: First are issues related to measurement and disclosures of items related to the combination itself. These include measurement of identifiable intangibles assets arising from the combination, i.e. intangible assets not previously recorded and unallocated goodwill arising from the acquisition. Second are issues related to measurement and disclosures of asset impairments. While impairment is not limited to business combinations, a major portion of the accounting and reporting issues are related to goodwill.
As a result, we have formulated two research questions to guide this study:
Q2. To what extent has the mandatory adoption of IFRS been followed by telecommunications companies’ compliance with measurement and disclosure standards for goodwill impairments. Prior research on these topics has been limited. There have been several studies of IFRS adoption in general, many prior to the mandatory adoption requirement of the EU (e.g. Street, Bryant and Gray 1999; Street and Bryant 2000; Street and Gray 2001 and 2002, Glaum and Street 2003; and Hodgdon et al. 2009) which all indicated a low level of compliance despite statements of the companies and their auditors that statements were in accordance with IFRS. The only study of business combinations in a European setting was that of Paananen (2008) who measured the volume of information of goodwill under IAS 36 for companies in France, Germany, and the United Kingdom and found a low level of compliance. Sevin et al. (2007) and Shalev (2009) examined goodwill disclosures for U.S. companies under U.S. GAAP, finding sporadic and limited compliance with standards. All of these studies were broad-based examining large groups of companies and thus, though, did not examine in depth the issues of individual companies. Despite the interest in individual companies expressed above, there have been no substantial in-depth studies of companies. Therefore, this study takes a first step in the study of individual companies.
1.1. Measurement and reporting issues from business combinations
When businesses combine, many complex accounting and reporting issues arise. Prior to the mandatory adoption of IFRS in 2005, European companies were subject to local country accounting standards which varied widely. One of the primary motivations for the 2002 mandate was to eliminate the inconsistencies of the many different standards that were being used in Europe before 2005. IFRS standards are generally more stringent and in particular require substantially more disclosures than many if not most local European countries’ accounting standards (Jermakowicz and Gornik-Tomaszewski 2006). The accounting standards of most individual European countries, especially on the continent of Europe, are based on the interests of many stakeholders while IFRS are motivated primarily by interests of investors. This difference in focus has major impacts on valuation methods as well as a major increase in disclosures (Jermakowicz and Gorkin-Tomaszewski 2006, Ernst & Young 2006). Some European companies voluntarily adopted accounting standards of other countries, notably U.S. GAAP, primarily because they were listed, or sought listing on stock exchanges in the U.S. Street and Bryant (2000) observed when examining IFRS compliance in general, before mandatory adoption that a listing in the U.S. did not seem to affect compliance with IFRS. In our in-depth analysis, we also examine the extent of multiple listings and the impact on compliance with IAS 36 and IFRS 3.
1.1.1. Allocating the cost of a business combination
countries (e.g. see Ma and Hopkins, 1988; Johnson and Petrone, 1998; Fontanot, 2003; Gaughan, 2005). There is general recognition that value of a business as a whole is greater than the aggregation of individual assets less liabilities, and this difference is called goodwill in general terminology, although the term “goodwill” was not found in financial reports themselves. Two major issues are the subsequent treatment of unallocated goodwill in following years, discussed shortly, and to what extent other intangible assets must be separately identified in order to leave unallocated goodwill as truly a residual that cannot otherwise be attributed to an asset. Traditionally, little effort was made to separate unallocated goodwill from other intangibles arising from the acquisition that were not previously reported on an acquired company’s financial statements, e.g. brands, customer lists, self-developed patents and the like. Because traditionally all intangible assets including unallocated goodwill were amortized or written off, there was little perceived need to make such a separation. With the adoption of IFRS 3, and a similar standard in the U.S., goodwill would no longer be amortized but instead subject to impairment testing as discussed below.
IFRS 3, paragraph 45, states that intangible assets must be recognized separately from goodwill in business combinations when they meet the definition of intangibles in IAS 38 and their fair values can be measured reliably. This requirement, contrary to much of traditional practice, provides a clear instruction for companies to reduce amounts of unallocated goodwill and increase amounts allocated to previously unrecognized intangible assets. Caldwell (2006) indicates that such increased allocation to specific intangible assets is occurring, although at a glacial pace. Not only is such allocation difficult and tedious, companies have little incentive to make such allocations because, among other reasons, increased amounts allocated to other intangibles lead to lower reported income because such intangibles must be amortized while goodwill is no longer amortized with the adoption of IFRS. (For more discussion see, for example, Jetuah , 2007; Deloitte Touche Thomatsu, 2004; PricewaterhouseCoopers, 2004, and similar professional sources). Traditionally, European companies following local accounting standards had a wide variety of approaches for accounting for unallocated goodwill after a business combination, and in some cases could choose among alternatives. Such provisions are too numerous to present here. (For a comprehensive discussion see Carrara, 2007, pg. 94.) Briefly, the most common treatment was amortization over periods not to exceed five years or 20 years. Write-off of unallocated goodwill against reserves or current year’s income is permitted in some situations and various choices of impairment testing were permitted. IFRS 3 eliminated amortization of goodwill, instead requiring impairment testing (discussed shortly). Thus, IFRS 3 establishes a motivation that might be viewed as contradicting the board’s desired end result to allocate amounts to specifically identifiable intangible assets arising from the acquisition. A requirement to identify as many intangible assets as can be reliably measured would lead to lower future net income as the intangible assets are amortized thus motivates companies to “err” on the side of continuing recognition of as much of the acquisition cost as unallocated goodwill which will no longer be amortized. Therefore, a major element of this study is to examine the portions of acquisition costs allocated to goodwill before and after mandatory adoption of IFRS, and over the subsequent four year period.
1.1.2. Disclosures related to business combinations
determination of goodwill and intangible assets included or recorded separately, profit impacts, and reconciliation of unallocated goodwill to evaluate changes during the year. One of the objectives of this study is an in-depth assessment of the extent of compliance of each company with respect to these disclosure requirements since 2005 and changes over time.
1.1.3. Other issues
Other issues are apparent from the mandatory adoption of IFRS and issue of IFRS 3 that cannot be addressed by this study. For example, the choice of accounting method, purchase or pooling of interests (also called uniting of interests) is now largely irrelevant because IFRS prescribe that all business combinations shall be reported using the purchase method. Identifying whether an activity is indeed a business combination for financial reporting purposes and identifying the acquiring entity also present challenges. We must assume that these issues are adequately resolved, apart from disclosures, because we do not have access to the internal documentation of the company and its auditors. Similarly, measuring the cost of a business combination also presents challenges that we cannot address apart from disclosures because of lack of access. (For more discussion of these issues see, for example, Epstein and Mirza, 2005; Deloitte Touche Tohmatsu, 2004, and similar educational and professional items published by various sources.)
1.2. Impairment testing of goodwill
The requirement for impairment testing has been a part of accounting tradition in most countries for many years, although not always formalized and traditionally often a term other than “impairment” was used. For example, a notion has existed in many countries for some time that assets should not appear on a balance sheet at greater than a recoverable amount, “recoverable amount” defined in various ways. With respect to unallocated goodwill, impairment testing could be triggered by a specific event, or be required annually. Traditionally unallocated goodwill has often been subject to impairment testing even if it was being amortized so that impairment testing and amortization are not alternatives. After considerable discussion and debate, the IASB in IFRS 3 specified impairment testing exclusively, referring to IAS 36 which was amended. IAS 36 applies to assets in addition to goodwill, but the focus of most discussion is on the impact of IAS 36 on impairment testing of unallocated goodwill. (For more discussion of impairment testing see, for example, Carrara, 2008; Carlin, Finch, and Guy, 2007; Wines, Dagwell, and Windsor, 2007; Ernst and Young, 2007; International Accounting Standards Board, 2004; and similar sources.)
1.2.1. Impairment testing based on Cash Generating Units
factors. (Carrara, 2008; Carlin, Finch, and Guy, 2007; Wines, Dagwell, and Windsor, 2007; Ernst and Young, 2007; International Accounting Standards Board, 2004; and similar sources). The assignment of unallocated goodwill to CGUs and use of CGUs to assess impairment represents a significant departure from almost all accounting traditions and can be expected to represent a significant challenge for first time adopters of IAS 36 beginning in 2005. Therefore we do an in-depth analysis of annual reports to explore companies’ identification of CGUs and impairment testing.
1.2.2 Disclosures related to impairment tests
Traditionally, disclosure requirements for asset impairments varied substantially among countries and in general were not extensive (Jermakowicz and Gornik-Tomaszewski 2006, Ernst & Young 2006). The IASB sought to increase transparency and accountability and allow users of financial reports to make independent reflections on the impairment process by requiring a wide range of information be disclosed for each CGU that has a substantial amount of unallocated goodwill. Disclosure requirements of IAS 36 vary depending on which approach is used to measure the recoverable amount; disclosures are more extensive for the value in use approach than for the fair value approach.
As above for disclosures of business combinations, the disclosure requirements are too extensive to list here and are presented in Appendix 1 along with results of the study. In general, the requirements require disclosure of assumptions and approaches used to determine fair values and costs to sell if the fair value approach is used; and assumptions about the amount and duration of cash flows, growth rates, and discount rates if the value in use approach rate is used. As with disclosures about measurements for business combinations, another objective of this study is to assess compliance with disclosure requirements of goodwill impairment tests for each company.
1.3 Compliance and enforcement
It is meaningless to speak about high quality financial reporting and transparency as envisioned by the IASB and the European Commission unless effective and consistent application of IASs and IFRSs in ensured (Whittington 2005, Daske et al. 2008). Positive economic consequences of IFRS adoption can occur only in countries with strict enforcement regimes (Daske et al. 2008). The level of compliance is as important as the standards themselves (Hogdon et al. 2009). Such compliance is viewed as narrowing the information gap between informed and uninformed investors and consequently increasing capital market efficiency (Healy and Pelapau 2001, Ball 2006). IFRS implementation is viewed as the “Achilles heel” of IFRS (Ball 2006) because partial compliance with IFRS may lead to uncertainty about the real economic situation of an entity. In this study we explore enforcement, or lack thereof.
2.0 Method and company selection
2.1 Content Analysis
Content analysis involves objective and systematic analysis of communication media, in this study published annual reports, in order to extract data, count observations for further analysis including statistical analyses, and form qualitative assessments. (For more discussion of the content analysis research method see, for example, Carney 1972, Krippendorf 1980, and Steenkamp, 2007.) Content analysis is especially useful for this study because if applied properly it is:
-Systematic and covers all aspects of the issue uniformly throughout the text analyzed. -Objective because all content is considered alike and impartially collected.
-Manifest because all content is taken at face value without interpretation.
-Informative because it reveals trends and characteristics not otherwise observable
Because of the mass, complexity, and sometimes chaotic nature of the content. Content analysis allows deeper analysis of situations than other methods.In this study we read thoroughly the content of all annual reports of the eight companies for the years 2005 through 2008, 32 annual reports total, in order first to assess for each company, to the extent possible, the compliance with measurement aspects of IFRS 3 and IAS 36. In addition we examined all disclosures in order to determine whether the companies had adequately disclosed all mandatory items required by IFRS 3 and IAS 36. Content analysis allows quantitative analysis of data extracted from the analysis. In this study we examine the level of compliance with IFRS disclosure requirements for both IFRS 3 and IAS 36 using a comprehensive disclosure index. This index includes all disclosure requirements of each standard. This index enables the quantification of the level of compliance with a compliance ratio that takes values from 0 (no compliance) to 1 (full compliance). Specifically, in order to score companies, the so called dichotomous approach is used (Cooke, 1989; Street and Bryant, 2000; Glaum and Street, 2003; Jahangir, Kamran, and Darren 2004; Akhtaruddin, 2005; Hassan et al, 2009) in which if a required item is disclosed, it is scored as 1 and if not disclosed it is scored 0; if an item is not applicable for a company, it is marked as “NA”. Then, the level of compliance for each company is calculated as the ratio of the total items disclosed to the total number of applicable disclosure items as follows:
Where,
LCi,t = The total Level of Compliance score for firm i in year t 0 ≤ L.C. ≥ 1
Di,t = The total number n (0, m) of disclosed items d for firm i in year t
Ai,t = The total number m (3, 58) of applicable disclosure items a for firm i in year t
Following Glaum and Street (2003), the disclosure index is based on a checklist developed by the audit firm Deloitte (2008). In order to ensure the completeness of the index, items are compared with similar checklists of the other three major audit firms and with Ntzanatos (2008). During the period under examination (2005-2008) no amendments to the two standards occurred and no company adopted optionally the amendments of IFRS 3 and IAS 36 before their mandatory adoption on 1 January 2009.
2.2 Company selection
For this study, we selected eight European telecommunications companies. The telecommunications industry was chosen because companies have been active in business
∑
∑
= =
= =
= m
j j t i
n
j j t i
t i
a A
d D
LC
1 ,
1 ,
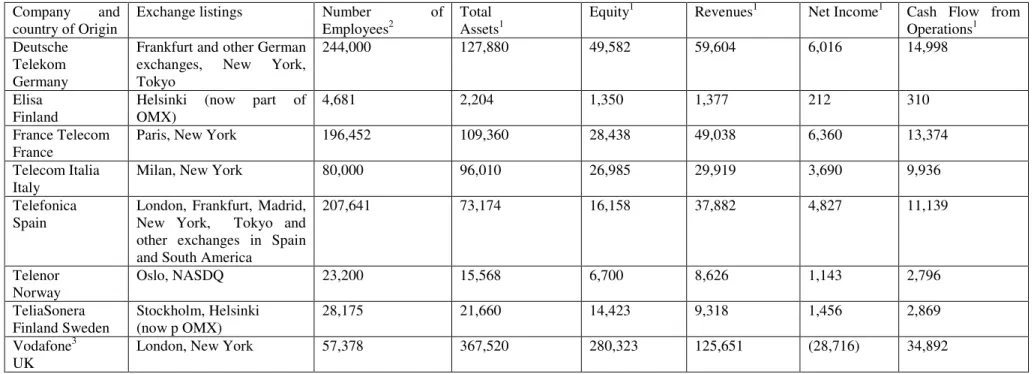
combinations in recent years. In addition, telecommunications companies tend to have relatively large unrecorded intangible assets related to brand, customer lists, licenses, etc. As a result they have been reputed in the media to have paid large amounts to acquire companies in the same industry so that examining goodwill and intangible assets from the combinations allows a focus on the research objective. This group of eight companies is admittedly a convenience sample and generalizations cannot be made outside of this group. Nonetheless, the small sample permits an in-depth analysis that would not be possible otherwise. Moreover, the companies are large enough to be significant on European stock exchanges and thus provide insight into the behaviour of large European companies with respect to IFRS adoption. The companies and some descriptive data are presented in Table 1. The data as of the end of 2005, the first full year of this study is designed to give a view of the size and significance of the company with respect to total assets, equity, revenues, net income, cash flow from operations, and number of employees. The exchanges on which the shares are listed also give some indication of the significance.
[Table 1 about here]
3.0 Results of content analysis
In order to assess the two research questions, we first explored annual reports to first examine accounting and reporting treatment for combinations before 2005 and then in each of the subsequent years. After examining the materiality of goodwill, we explored the measurement issues of allocation of purchase prices to goodwill and other intangibles and then explored measurement issues related to goodwill impairments. Afterwards, we examined the disclosures about measurement issues related to both topics to determine if they comply with the requirements of IFRS 3 and IAS 6. As will become apparent, it is not possible to make a clear distinction between measurement and disclosure issues, but we have done so to the extent possible as a means to organize our findings. Finally, we explore issues about stock exchange listings and auditor choice.
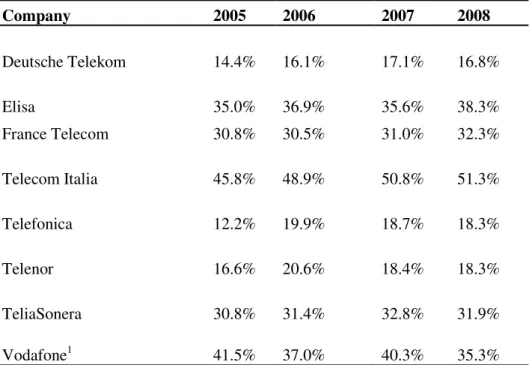
3.1 Goodwill as a percentage of total assets: materiality and trends
One of the first issues to be considered in an in-depth analysis is whether the carrying amount of unallocated goodwill on companies’ balance sheets is material enough to warrant concern and further in-depth analysis. Among other things, the materiality of goodwill is closely related to the volume of disclosures mandated by IFRS 3 and IAS 36. The issue of materiality is particularly broad and uncertain because there is no objective method of measuring it (Hoogendoorn, 2006). As a consequence, in many cases both Assistant Lecturers and users of financial statements use “rules of thumb” in order to determine whether an item or an event is material or not (Shalev, 2009).
goodwill as a percentage of total assets from 2005 to 2008 except Vodafone which showed a decrease from 59 percent to 40 percent. Some companies showed very small year-to-year decreases, but an overall increase for the four-year period.
[Table 2 about here]
3.2 Accounting and reporting issues directly related to acquisitions Research question 1 states:
Q1. To what extent has the mandatory adoption of IFRS been followed by telecommunications companies’ compliance with measurement and disclosure standards for items directly related with business combinations.
It relates specifically to amounts allocated to specific intangible assets arising from acquisitions and the remaining unallocated goodwill. IFRS 3 clearly took a position that amounts reported as unallocated goodwill should be limited to items that cannot be identified or measured reliably while items such as brands, trademarks, customer base, etc. should be identified and reported separately. The clear expectation of IFRS 3 is that amounts reported as unallocated goodwill would decrease while amounts allocated to specifically identifiable intangible assets would increase. Therefore, our primary criterion for assessing the compliance with measurement and reporting requirements of IFRS 3 is the relative amounts allocated to specific intangible assets, amounts that remain as unallocated goodwill, and the trend over time.
3.2.1 Business combinations before 2005
Examining the annual reports of the eight companies for various different years before 2005 shows, as expected, a wide variety of practices all of which are generally sketchy and inadequate from which to make assessments and lacked transparency. In general, information presented is limited to the purchase price, the percentage of equity shares acquired, and amount of goodwill. On average 75 percent of the purchase price was remained unallocated goodwill. Only Telenor and France Telecom provided information about purchase price allocation and allocated small amounts to intangible assets that were not previously reported by the acquired company. Vodafone indicated that many of its acquisitions were driven by the aim to acquire trademarks and customer bases of other companies, but the financial statements do not show amounts allocated to such intangible assets. (For more details and illustrations see Carrara 2008.)
3.2.2 Accounting and reporting for business combinations in years beginning in 2005
The examination of annual reports for 2005 onward showed the eight companies began to present more comprehensive information about business combinations than in previous years, yet several significant failures to comply with the intentions and requirements of IFRS 3 are evident. Notably the IASB in IFRS 3 clearly expects companies to allocate more of the amounts of purchase prices to identifiable intangible assets not present on financial statements before combination and thereby reduce amounts allocated to goodwill.
3.2.3 Accounting and reporting for business combinations in 2005
[Figure 1 about here]
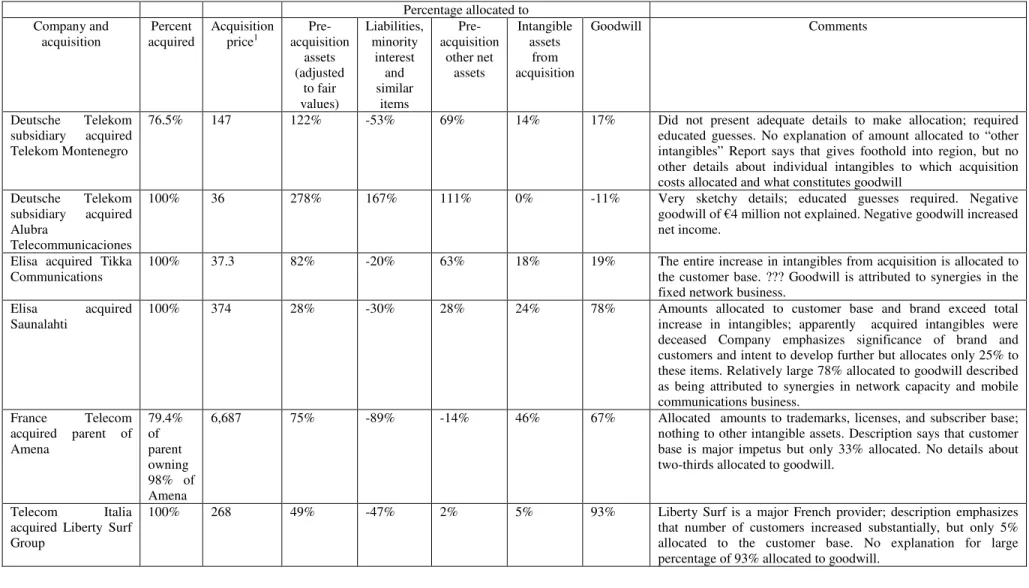
As shown in Table 3, though, examining each major acquisition in 2005 individually indicates wide variation among companies in amounts allocated to goodwill. A few acquisitions with very low and negative goodwill distort the aggregate average. Amounts of unallocated goodwill by other companies remain high, often almost the entire purchase price. Percentages allocated to specifically identifiable assets remain low with two anomalies of 98 percent and 354 percent of the purchase price, the latter because large amounts were allocated to both liabilities and reduction of other assets, distorting the aggregate average. Some of the companies indicate substantial increases in customers, new market entry, etc., but do not allocate amounts to customer lists, brands, trademarks and the like. Relatively large amounts are identified merely as other intangible assets with no description. Companies give only vague comments such as future profits, synergies and growth to describe what constitutes unallocated goodwill. It is apparent that the reporting of business combinations in 2005, while providing more information than in years before mandatory adoption of IFRS, is not achieving the expectation of the IASB to increase accountability and especially increase transparency.
[Table 3 about here]
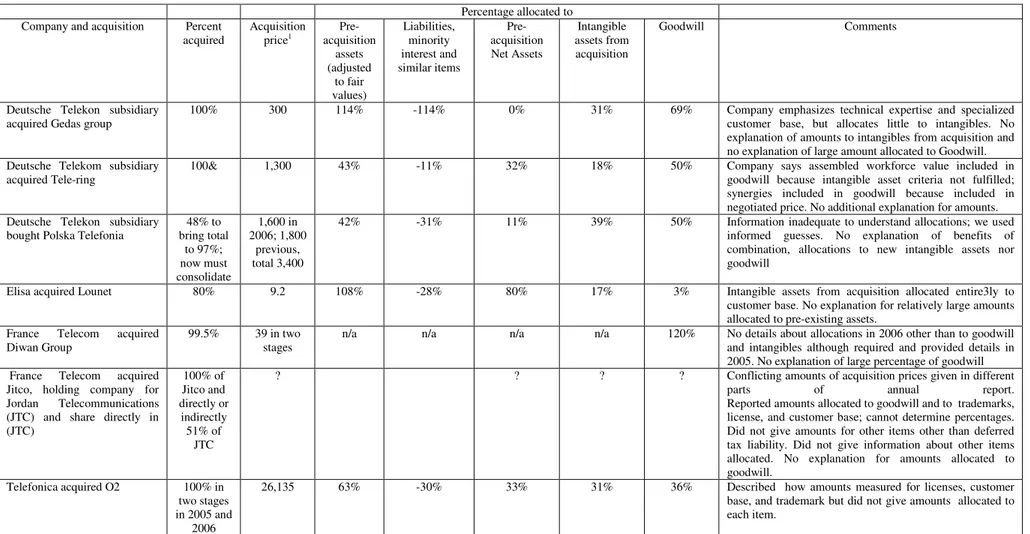
3.2.3 Accounting and reporting for business combinations in 2006
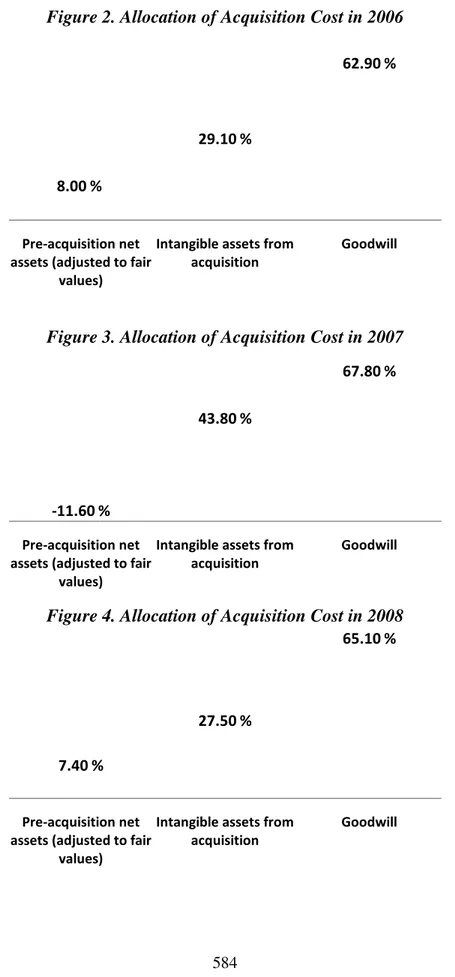
Examination of annual reports for 2006 shows, as presented in Figure 2, on average the aggregate amount of purchase prices reported as unallocated goodwill has increased to 63 percent compared to 60 percent in 2005, while the percentage allocated to specifically identifiable intangibles has decreased to 29 percent from 45 percent, the opposite direction expected by the IASB.
[Figure 2 about here]
transparency, though, is Telenor’s aggregation of acquisitions that the company states are individually immaterial showing detailed information about the acquisitions in the aggregate.
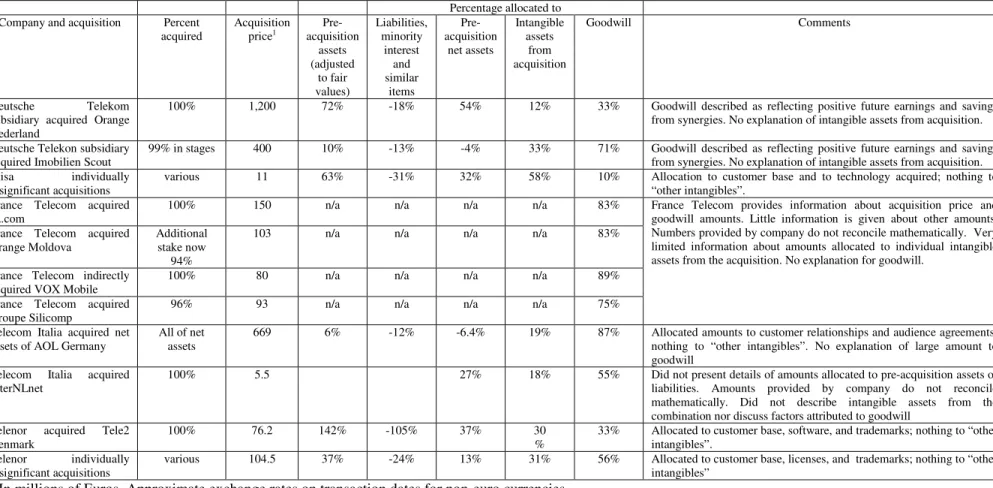
3.2.4 Accounting and reporting for business combinations in 2007
Examining aggregate amounts for 2007 as shown in Figure 3 shows a continuing pattern of relatively large amounts on average, 68 percent, continuing to be reported as unallocated goodwill. A substantially increasing percentage being allocated to previously unreported identifiable intangible assets, increased to 44 percent in 2007 compared to 29 percent in 2007, suggesting that companies are increasing amounts allocated to other intangibles as expected by IFRS 3.
[Figure 3 about here]
When looking at details about specific acquisitions in 2007 as shown in Table 5, there was a notable absence of very large amounts allocated to specific items compared to the previous two years. It is not possible to know whether this absence of large anomalies results from a difference in the nature of the transactions or from improved financial reporting of the companies. Companies notably show more information about amounts allocated to specific intangibles with a notable decrease in amounts identified as “other intangible assets”. In general, percentages allocated to intangible assets show an increase from the previous two years. With the exception of France Telecom, percentages reported as unallocaed goodwill show decreases from the previous years. These two finding suggest the companies are reporting amounts in the direction expected by IFRS 3. France Telecom notably did not provide details about allocations and amounts that were provided did not reconcile mathematically. Likewise information about one of the acquisitions of Telecom Italia did not reconcile mathematically and was sketchy. Telenor continued to report an aggregate of acquisitions that are individually immaterial. Descriptions of amounts reported as unallocated goodwill remain vague with comments about future profits and synergies. In general, we noticed a suggestion of a small trend towards compliance with measurement expectations of IFRS 3 with a continued long ways to go.
[Table 5 about here]
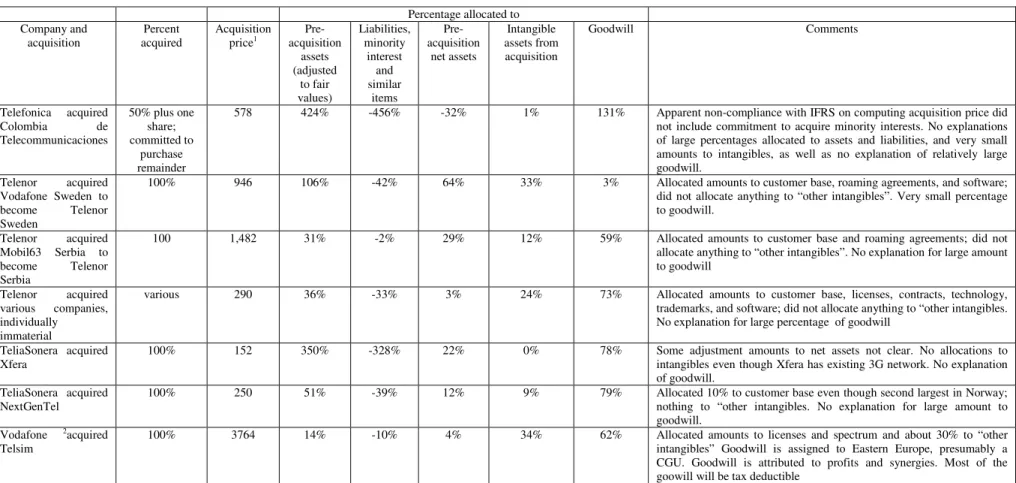
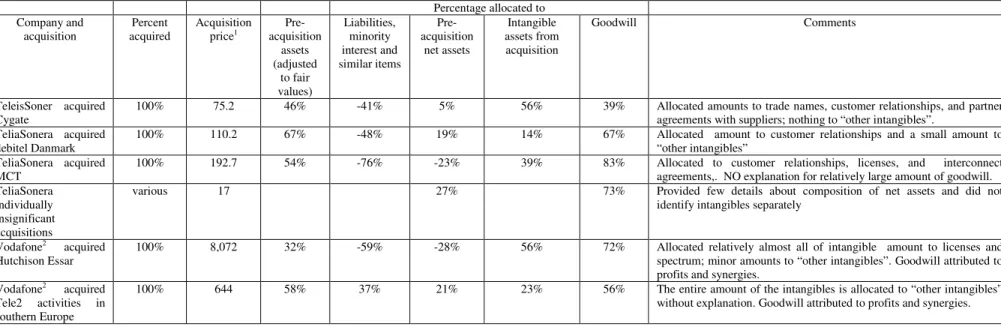
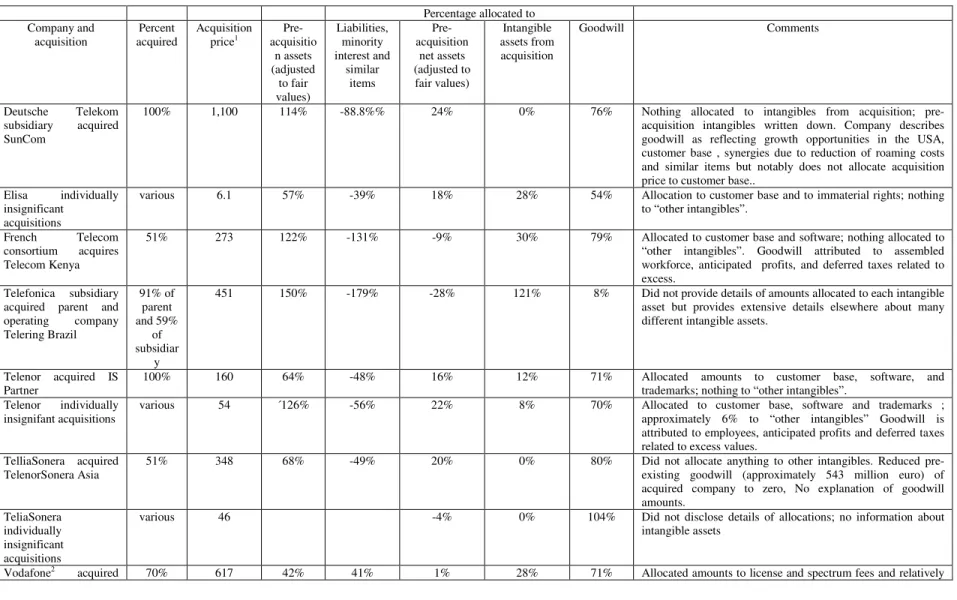
3.2.5 Accounting and reporting for business combinations in 2008
Looking at Figure 4 for acquisitions in 2008 shows that the aggregate of amounts reported as unallocated goodwill remains in the same percentage range as the previous years, in the 60 percent range. The percentage of amounts allocated to identifiable previously unreported intangible assets, though, has reverted to the mid 20 percent range of 2006.
[Figure 4 about here]
progress towards meeting the measurement requirements of IFRS 3 with respect to greater amounts allocated to identifiable intangible assets and lower amounts allocated to goodwill.
3.3 Accounting and reporting issues directly related to impairment testing
As discussed in detail above, the IASB made substantial changes in requirements for impairment testing of goodwill compared to its previous standards and those of almost all local countries’ accounting standards. Two major elements are defining cash generating units (CGUs) and specifying methods by which the impairment of a CGU is assessed, and then any impairment of goodwill.
3.3.1 Specifying CGUs
The clear intent of the IASB in requiring impairment testing by CGU was to expose more amounts of unallocated goodwill to potential impairment by minimizing the impact of aggregation on impairment. Previously, when unreported goodwill as a whole was subject to impairment tests, the impairment of goodwill related to specific operating units could be avoided because the goodwill in the aggregate was not materially impaired. In providing guidelines on how companies should define CGUs, the clear implication was that CGUs should be small enough to represent realistic units in order to limit aggregation as a means to avoid impairment testing and write-down of unallocated goodwill with resulting negative impact on reported income. In this study, we examine annual reports to discover how companies have defined CGUs and draw inferences about the appropriateness of the definitions.
Table 7 shows CGUs by company as determined from information in 2005 and 2006 annual reports. Only Telenor and France Telecom described that the combinations of CGUs for which impairment tests were made is based on independence of cash flow generating activity. Vodafone had only four CGUs despite having nine segments, and TeliaSonera has four CGU despite having 10 segments. The standard specifies that the highest level for a CGU is business segment; therefore, Vodafone and TeliaSonera must have combined segments to determine CGUs. Telefonica did not provide information about CGUs. These results suggest at best a half-hearted attempt to comply with IAS 36 and based goodwill impairment testing to different levels from those expected by the IASB.
3.4 Compliance with disclosure requirement for business combinations and goodwill
As discussed in more detail above, one of the most important elements of IFRS 3 and IAS 36 was imposition of a substantial number of disclosure requirements. In order to examine the extent to which companies complied with disclosure requirements of each standard, we tabulated the number of companies complying with each standard as shown in Appendix 1. This analysis shows that all or nearly all companies either complied with a specific requirement or failed to comply with a requirement; there was little variation in the number of companies complying with each standard. This analysis indicates that all of the companies were having the same difficulty complying or choosing to ignore the same requirements. It is important to note that the disclosures that require merely reporting basic data that are readily available, e.g. name of acquired company and basic information about the acquisition, are those with which all companies comply. Disclosure requirements that require extensive analysis and description are those with which there is substantial non-compliance. It is important to note that we did not detect any substantial increase in the number of companies complying with specific disclosure requirements over the four year period.
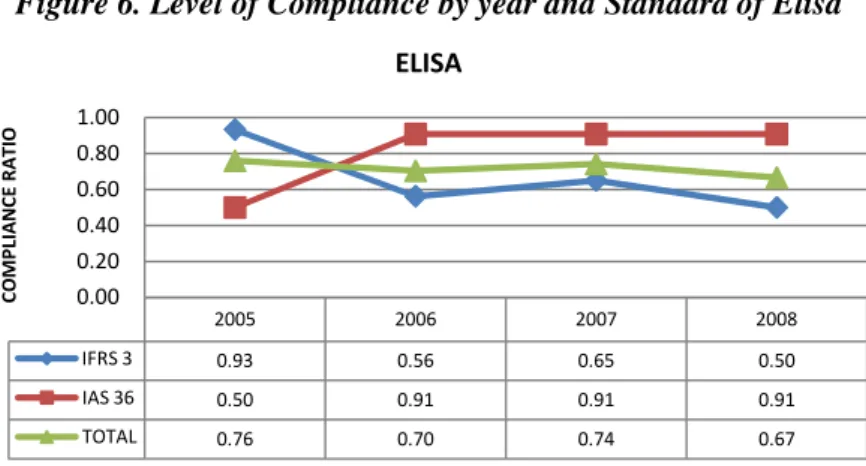
companies have indeed improved over time, notably TeliaSonera and Telenor. Vodafone has consistently had high compliance ratios. Some companies, notably France Telecom and Telefonica show a decline in compliance and low levels of compliance. The overall picture, other than the three companies mentioned, is one of partial compliance and no indication of improvement.
3.5 Effect of stock exchange
As indicated above when we provided basic descriptive material for the companies involved in Table 1, we included stock exchange listings. Six of the eight companies have multiple listings. Only Elisa and TeliaSonera are not listed in the U.S. TeliaSonera does file Form 20 with the Securities and Exchange Commission, though, presumably because it has other securities in the U.S, a fact that we did not investigate. There is no apparent indicate effect of the multiple listings, and in particular listing in the U.S. on the type of information presented. The only detectable effect is the listing of Telenor on the Oslo Stock exchange which is noted for rigorous enforcement of accounting requirements [a source will be cited here]. Telenor throughout this analysis has shown a fairly high degree of compliance with both the requirements and expectations of the IASB in IFRS 3 and IAS 36.
4.0 Concluding discussion
This study has provided an in-depth analysis of compliance with IASB standards related to
business combinations and goodwill impairment by exploring eight European
telecommunications companies using content analysis methodology. While results cannot be generalized outside the eight companies, the insights obtained would not have been possible with broader-based research methods that did not explore as deeply. The findings indicate that at best there is only partial compliance with IASB standards and only limited improvement at best over the four year period. Among the most important findings is the fact that companies continue to report relatively large amounts of unallocated goodwill upon acquisition despite the clear expectation of the IASB that amounts allocated to goodwill will decline as larger amounts are allocated to specifically identifiable previously unreported intangible assets. There is a detectable increase in identification of amounts allocated to specific previously unreported intangible assets upon acquisition, e.g. customer bases, licenses, trademarks and brands, etc. But no detectable increase in the overall amount of such assets is apparent. Similarly there is little compliance with standards relating to goodwill impairment, notably assigning goodwill to appropriate CGUs. Moreover, there is at best only partial compliance with disclosure requirements of IFRS 3 and IAS 36.
The partial compliance with standards of the IASB has several implications, one of which is the future viability of the Board itself. Potentially of greater importance, though, is audit failure in which the audit reports indicate fair reporting and compliance with standards when there is obvious lack of compliance. Potentially of even greater importance, yet, is the lack of enforcement mechanism to assure compliance. The only detectable enforcement that was detected is that of the Oslo Stock Exchange as evidenced by Telenor’s high level of compliance. All of these issues remain as issues for further research and the findings of this study provide bases for that research.
References: Books:
2. Gaughn, P.A. (2005), Mergers: What Can Go Wrong and How to Prevent It. Hoboken, NJ, USA: Wiley, pg. 56.
3. Krippendorff, K. (1980). Content Analysis: An Introduction to its Methodology. London: Sage Publications.
4. Ntzanatos D., (2008). Preparation of Financial Statements Notes and Control of their Completeness – Volumes A & B, Athens: Kastanioti Publications.
5. Ryan, B, Scapens, RW, and Theobold, M. (2002). Research Method and Methodology in Finance and Accounting, Second edition. London: Thompson.
Publications:
1. Akhtaruddin Μ. (2005). Corporate Mandatory Disclosure Practices in Bangladesh, The International Journal of Accounting, Vol. 40, pp 399-422
2. Ball, R. (2006), International Financial Reporting Standards: Pros and Cons for Investors, Accounting and Business Research, International Accounting Policy Forum, pp 5-27.
3. Caldwell, A. (2006), Practical Applications of IFRS 3, AccountingWEB.co.uk pg. 5.
4. Carlin, T.M., Finch, N. and Ford, G., (2007), Goodwill Impairment—An assessment of disclosure quality and compliance levels by large Australian firms. Maquarie Graduate School of Management working paper.
5. Carney, T.F. (1972). Content Analysis: A technique for systematic inference from communications. London: Batsford.
6. Carrara, Mario (2008), European Companies’ Compliance with IFRS Standards for Goodwill Measurement and Impairment: An Analysis of Eight Telecommunications Companies, Unpublished masters thesis, Universita’ Delgi Studi di Brescia, Facolta’ di Economia.
7. Cooke T.E. (1989) Voluntary Corporate Disclosure by Swedish Companies, Journal of International Financial Management and Accounting, Vol. 1, No. 2, pp 171-195
8. Daske, H. et al. (2008), Mandatory IFRS Reporting Around the World: Early Evidence on the Economic Consequences, Journal of Accounting Research, Vol. 46, No. 5, pp 1085-1142.
9. Deloitte Touch Tohmatsu, (2004), Business Combinations—A Guide to IFRS 3.
10. Deloitte Touche Tohmatsu (2008) International Financial Reporting Standards – Presentation and Disclosure Checklist, Retrieved from http://www.iasplus.com /fs/2008checklist.pdf in June 30, 2009.
11. Ernst & Young, (2006), Observations on the Implementation of IFRS, London.
12. Ernst & Young (2007), IAS 36 Impairment Testing: Practical Issues, January 2007, pg. 8. 13. Fontanot, P. (2003), How good is goodwill—you decide! Accountancy SA, pg. 10.
14. Forbes, T., (2007),The failure of IFRS 3, Intellectual Asset Management, December/January 2007, pp. 8-12.
15. Glaum, M., and Street, D.L. (2003) Compliance with the Disclosure Requirements of Germany’s New Market: IAS vs. U.S. GAAP, Journal of International Financial Management and Accounting, Vol. 14, No. 1, pp. 64-100.
16. Hassan A.G.O., et al., (2009) The Value Relevance of Disclosure: Evidence from the Emerging Capital Market of Egypt, The International Journal of Accounting¸ Vol. 44, pp 79-102 17. Healy, M.P, and Palepu, G.K. (2008), Information Asymmetry, Corporate Disclosures and Capital Markets: A Review of the Empirical Disclosure Literature, Journal of Accounting and Economics, Vol. 31, pp 405-440.
19. Hoogendoorn M. ,(2006), International Accounting Regulation and IFRS Implementation in Europe and Beyond – Experiences with First Time Adoption in Europe, Accounting in Europe, Vol. 3, pp 23-26
20. International Accounting Standards Board (2004), Basis for Conclusions on IAS 36 Impairment of Assets.
21. Jermakowicz, K.E, and Gornik-Tomaszewski, S., (2006), Implementing IFRS from the perspective of EU publicly traded companies, Journal of International Accounting, Auditing, and Taxation, Vol. 15, pp. 170-196.
22. Jahangir A., Kamran A. and Darren H. (2004) Disclosure Compliance with National Accounting Standards by Listed Companies in South Asia, Accounting and Business Research, 34, 3, pp 183-199
23. Jetuah, (2007), Reporting of intangible assets hard in practice, Accountancy Age, October. 24. Johnson, LT. And Petrone, K.R. (1998), Is Goodwill an Asset, Accounting Horizons, Vol. 12 No. 3, pg. 298.
25. Ma, R. And Hopkins, R. (1988) Goodwill—an example of puzzle-solving in accounting, Abacus, Vol. 24 No. 1, pg. 76.
26. Márquez-Ramos, L. (2008), The Effect of IFRS Adoption on Trade and Foreign Direct Investments, International Trade and Finance Association, Working Paper 19.
27. Paananen, M., (2008), Fair Value Accounting for Goodwill under IFRS: An exploratory study of the Comparability in France, Germany, and the United Kingdom. Working paper published in Social Science Research Network, www.ssrn.com
PricewaterhouseCoopers (2004), Acquisitions—Accounting and transparency under IFRS 3, pg. 16.
28. PricewaterhouseCoopers (2006), IFRS: The European investors’ view, February 2006.
29. Steenkamp, N. (2007), Content Analysis in Accounting Research: The Practical Challenges, Australian Accounting Review, November, pp. 12-26.
30. Street, L.D, Gray, J.S., and Bryant, M.S. (1999), Acceptance and Observance of International Accounting Standards: an Empirical study of Companies Claiming to Comply with IASs, The International Journal of Accounting, Vol. 34, No. 1, pp. 11-48.
31. Street, L.D, and Bryant, M.S. (2000) Disclosure Level and Compliance with IASs: A Comparison of Companies with and without U.S. listings and Filings, The International Journal of Accounting, Vol. 35, No. 1, pp. 305-329.
32. Street, L.D., and Gray, J.S. (2001), Observance of International Accounting Standards: Factors Explaining Non-compliance, ACCA Research Report No. 74.
33. Street, L.D., and Gray, J.S. (2002), Factors Influencing the Extent of Corporate Compliance with International Accounting Standards: Summary of a Research Monograph, Journal of International Accounting Auditing and Taxation, Vol. 11, pp. 51-76.
34. Whittington, G. (2005), The Adoption of International Accounting Standards in the European Union, European Accounting Review, Vol. 14, No. 1., pp 127-153.
572
Table 1. Companies Studied with Descriptive Information in 2005
Company and
country of Origin
Exchange listings Number of
Employees2
Total
Assets1
Equity1 Revenues1 Net Income1 Cash Flow from
Operations1
Deutsche Telekom Germany
Frankfurt and other German
exchanges, New York,
Tokyo
244,000 127,880 49,582 59,604 6,016 14,998
Elisa Finland
Helsinki (now part of
OMX)
4,681 2,204 1,350 1,377 212 310
France Telecom France
Paris, New York 196,452 109,360 28,438 49,038 6,360 13,374
Telecom Italia Italy
Milan, New York 80,000 96,010 26,985 29,919 3,690 9,936
Telefonica Spain
London, Frankfurt, Madrid, New York, Tokyo and other exchanges in Spain and South America
207,641 73,174 16,158 37,882 4,827 11,139
Telenor Norway
Oslo, NASDQ 23,200 15,568 6,700 8,626 1,143 2,796
TeliaSonera Finland Sweden
Stockholm, Helsinki (now p OMX)
28,175 21,660 14,423 9,318 1,456 2,869
Vodafone3
UK
London, New York 57,378 367,520 280,323 125,651 (28,716) 34,892
1End of 2005. In millions of Euros using exchange rates at December 31, 2005 for non-Eurozone companies. Data from 2005 Annual report 2
Average number of employees during the year2005 or number of employees at the end of the year 2005, depending on data reported in the annual report.
3
573
Table 3. Telecom Companies reporting of acquisitions in 2005
Percentage allocated to Company and
acquisition
Percent acquired
Acquisition price1
Pre-acquisition
assets (adjusted
to fair values)
Liabilities, minority
interest and similar
items
Pre-acquisition
other net assets
Intangible assets
from acquisition
Goodwill Comments
Deutsche Telekom subsidiary acquired Telekom Montenegro
76.5% 147 122% -53% 69% 14% 17% Did not present adequate details to make allocation; required educated guesses. No explanation of amount allocated to “other intangibles” Report says that gives foothold into region, but no other details about individual intangibles to which acquisition costs allocated and what constitutes goodwill
Deutsche Telekom subsidiary acquired Alubra
Telecommunicaciones
100% 36 278% 167% 111% 0% -11% Very sketchy details; educated guesses required. Negative goodwill of €4 million not explained. Negative goodwill increased net income.
Elisa acquired Tikka Communications
100% 37.3 82% -20% 63% 18% 19% The entire increase in intangibles from acquisition is allocated to the customer base. ??? Goodwill is attributed to synergies in the fixed network business.
Elisa acquired Saunalahti
100% 374 28% -30% 28% 24% 78% Amounts allocated to customer base and brand exceed total increase in intangibles; apparently acquired intangibles were deceased Company emphasizes significance of brand and customers and intent to develop further but allocates only 25% to these items. Relatively large 78% allocated to goodwill described as being attributed to synergies in network capacity and mobile communications business.
France Telecom acquired parent of Amena
79.4% of parent owning 98% of Amena
6,687 75% -89% -14% 46% 67% Allocated amounts to trademarks, licenses, and subscriber base; nothing to other intangible assets. Description says that customer base is major impetus but only 33% allocated. No details about two-thirds allocated to goodwill.
Telecom Italia acquired Liberty Surf Group
574
Percentage allocated to Company and
acquisition
Percent acquired
Acquisition price1
Pre-acquisition
assets (adjusted
to fair values)
Liabilities, minority
interest and similar
items
Pre-acquisition
other net assets
Intangible assets
from acquisition
Goodwill Comments
Telecom Italia acquired Elefante TV and Delta TV
100% each
128 2% -33% -31% 98% 32% Description states that now cover 70% of Italian market thus large amount allocated to frequencies and broadcast rights. Also states the importance of the Elefante brand, but nothing allocated to brand. No explanation of goodwill.
Telefonica acquired Cesky Telecom
69% 3, 662 118% -75% 43% 32% 25% Did not identify which “other intangibles” received allocations. Trademark and customer list are described as driving forces, but nothing allocated. No explanation for 25% goodwill
Telefonica acquired Radiocomunicaciones Móviles S.A. and Telefónica Móviles Chiles S.A.
100% 837 (total) 84% -85% -2% 10% 92% No explanation to the intangible assets recognized (reported as “Other intangible assets”). Nothing allocated to the customer base, despite these acquisitions provided the group with 20 mln new customers. No explanation to the allocation of 92% of the purchase price to “Goodwill”.
Telenor subsidiary acquired DATC and UCOM (Thailand)
75% and 86.2%
333.4 69% -407% -338% 354% 84% Does not identify pre-acquisition values for intangibles arising from acquisition thus likely distorting extremely large percentage to intangibles from acquisition. Amounts identified for customer base, concession rights, trademarks, software and roaming agreements,
1
575
Table 3(Continued). Telecom Companies reporting of acquisitions in 2005
Percentage allocated to Company and
acquisition
Percent acquired
Acquisition price1
Pre-acquisition
assets (adjusted
to fair values)
Liabilities, minority interest and
similar items
Pre-acquisition
net assets
Intangible assets from acquisition
Goodwill Comments
Telenor acquired Bredbandbolaget
100% 566 18% -34% -16% 17% 99% Does not identify pre-acquisition values for intangibles arising from acquisition . Allocated amounts to customer base, trademarks, software and other intangibles The company emphasizes the benefit of a common Nordic platform but allocates only 17% to intangibles. Goodwill is explained as anticipated profits and synergies with no additional discussion to explain or justify large percentage.
Telenor acquired CyberCity
100% 166 21% -33% -12% 32% 81% Does not identify pre-acquisition values for intangibles arising from acquisition. Allocated amounts to customer base, trademarks, and software. No explanation of amounts allocated to intangibles and goodwill
TeliaSonera acquired Volvik (now Chess)
100% 235 35% -34% 1% 6% 93% The company strengthened it position in Norway and emphasized growth potential in home markets, but allocated only 6% to subscriber contacts. No justification of 93% allocated to goodwill.
Vodafone2 acquired Clear Stream
100% 2,795 36% -48% -12% 40% 72% Reported amounts to license and spectrum fees and to other intangibles, but did not show beginning balances. Goodwill is explained Goodwill is explained as profits and synergies from acquired company.
Vodafone2 acquired VemFin
99% 2,126 23% -24% -1% 41% 60% Reports amounts allocated to license and spectrum fees but does not show beginning amounts of each. Goodwill is attributed to synergies and profits of acquired company.
1
In millions of Euros. Approximate exchange rates on transaction dates for non-euro currencies. 2
576
Table 4. Telecom Companies reporting of acquisitions in 2006 Percentage allocated to
Company and acquisition Percent acquired Acquisition price1 Pre-acquisition assets (adjusted to fair values) Liabilities, minority interest and similar items Pre-acquisition Net Assets Intangible assets from acquisition
Goodwill Comments
Deutsche Telekon subsidiary acquired Gedas group
100% 300 114% -114% 0% 31% 69% Company emphasizes technical expertise and specialized customer base, but allocates little to intangibles. No explanation of amounts to intangibles from acquisition and no explanation of large amount allocated to Goodwill. Deutsche Telekom subsidiary
acquired Tele-ring
100& 1,300 43% -11% 32% 18% 50% Company says assembled workforce value included in goodwill because intangible asset criteria not fulfilled; synergies included in goodwill because included in negotiated price. No additional explanation for amounts. Deutsche Telekon subsidiary
bought Polska Telefonia
48% to bring total to 97%; now must consolidate 1,600 in 2006; 1,800 previous, total 3,400
42% -31% 11% 39% 50% Information inadequate to understand allocations; we used informed guesses. No explanation of benefits of combination, allocations to new intangible assets nor goodwill
Elisa acquired Lounet 80% 9.2 108% -28% 80% 17% 3% Intangible assets from acquisition allocated entire3ly to customer base. No explanation for relatively large amounts allocated to pre-existing assets.
France Telecom acquired Diwan Group
99.5% 39 in two stages
n/a n/a n/a n/a 120% No details about allocations in 2006 other than to goodwill and intangibles although required and provided details in 2005. No explanation of large percentage of goodwill France Telecom acquired
Jitco, holding company for Jordan Telecommunications (JTC) and share directly in (JTC) 100% of Jitco and directly or indirectly 51% of JTC
? ? ? ? Conflicting amounts of acquisition prices given in different
parts of annual report.
Reported amounts allocated to goodwill and to trademarks, license, and customer base; cannot determine percentages. Did not give amounts for other items other than deferred tax liability. Did not give information about other items allocated. No explanation for amounts allocated to goodwill.
Telefonica acquired O2 100% in two stages in 2005 and
2006
26,135 63% -30% 33% 31% 36% Described how amounts measured for licenses, customer base, and trademark but did not give amounts allocated to each item.
1
577
Table 4 (Continued). Telecom Companies reporting of acquisitions in 2006 Percentage allocated to
Company and acquisition
Percent acquired
Acquisition price1
Pre-acquisition
assets (adjusted
to fair values)
Liabilities, minority
interest and similar
items
Pre-acquisition
net assets
Intangible assets from acquisition
Goodwill Comments
Telefonica acquired Colombia de Telecommunicaciones
50% plus one share; committed to
purchase remainder
578 424% -456% -32% 1% 131% Apparent non-compliance with IFRS on computing acquisition price did not include commitment to acquire minority interests. No explanations of large percentages allocated to assets and liabilities, and very small amounts to intangibles, as well as no explanation of relatively large goodwill.
Telenor acquired Vodafone Sweden to become Telenor Sweden
100% 946 106% -42% 64% 33% 3% Allocated amounts to customer base, roaming agreements, and software; did not allocate anything to “other intangibles”. Very small percentage to goodwill.
Telenor acquired Mobil63 Serbia to become Telenor Serbia
100 1,482 31% -2% 29% 12% 59% Allocated amounts to customer base and roaming agreements; did not allocate anything to “other intangibles”. No explanation for large amount to goodwill
Telenor acquired various companies, individually immaterial
various 290 36% -33% 3% 24% 73% Allocated amounts to customer base, licenses, contracts, technology, trademarks, and software; did not allocate anything to “other intangibles. No explanation for large percentage of goodwill
TeliaSonera acquired Xfera
100% 152 350% -328% 22% 0% 78% Some adjustment amounts to net assets not clear. No allocations to intangibles even though Xfera has existing 3G network. No explanation of goodwill.
TeliaSonera acquired NextGenTel
100% 250 51% -39% 12% 9% 79% Allocated 10% to customer base even though second largest in Norway; nothing to “other intangibles. No explanation for large amount to goodwill.
Vodafone 2acquired
Telsim
100% 3764 14% -10% 4% 34% 62% Allocated amounts to licenses and spectrum and about 30% to “other intangibles” Goodwill is assigned to Eastern Europe, presumably a CGU. Goodwill is attributed to profits and synergies. Most of the goowill will be tax deductible
1
In millions of Euros; approximate exchange rates on transaction dates for non-euro currencies. 2
Table 5. Telecom Companies reporting of acquisitions in 2007 Percentage allocated to
Company and acquisition Percent acquired
Acquisition price1
Pre-acquisition
assets (adjusted
to fair values)
Liabilities, minority
interest and similar
items
Pre-acquisition
net assets
Intangible assets
from acquisition
Goodwill Comments
Deutsche Telekom subsidiary acquired Orange Nederland
100% 1,200 72% -18% 54% 12% 33% Goodwill described as reflecting positive future earnings and savings from synergies. No explanation of intangible assets from acquisition.
Deutsche Telekon subsidiary acquired Imobilien Scout
99% in stages 400 10% -13% -4% 33% 71% Goodwill described as reflecting positive future earnings and savings from synergies. No explanation of intangible assets from acquisition. Elisa individually
insignificant acquisitions
various 11 63% -31% 32% 58% 10% Allocation to customer base and to technology acquired; nothing to “other intangibles”.
France Telecom acquired ya.com
100% 150 n/a n/a n/a n/a 83% France Telecom provides information about acquisition price and goodwill amounts. Little information is given about other amounts. Numbers provided by company do not reconcile mathematically. Very limited information about amounts allocated to individual intangible assets from the acquisition. No explanation for goodwill.
France Telecom acquired Orange Moldova
Additional stake now
94%
103 n/a n/a n/a n/a 83%
France Telecom indirectly acquired VOX Mobile
100% 80 n/a n/a n/a n/a 89%
France Telecom acquired Groupe Silicomp
96% 93 n/a n/a n/a n/a 75%
Telecom Italia acquired net assets of AOL Germany
All of net assets
669 6% -12% -6.4% 19% 87% Allocated amounts to customer relationships and audience agreements; nothing to “other intangibles”. No explanation of large amount to goodwill
Telecom Italia acquired InterNLnet
100% 5.5 27% 18% 55% Did not present details of amounts allocated to pre-acquisition assets or liabilities. Amounts provided by company do not reconcile mathematically. Did not describe intangible assets from the combination nor discuss factors attributed to goodwill
Telenor acquired Tele2 Denmark
100% 76.2 142% -105% 37% 30
%
33% Allocated to customer base, software, and trademarks; nothing to “other intangibles”.
Telenor individually insignificant acquisitions
various 104.5 37% -24% 13% 31% 56% Allocated to customer base, licenses, and trademarks; nothing to “other intangibles”
1
Table 5 (Continued). Telecom Companies reporting of acquisitions in 2007 Percentage allocated to
Company and acquisition
Percent acquired
Acquisition price1
Pre-acquisition
assets (adjusted
to fair values)
Liabilities, minority interest and similar items
Pre-acquisition
net assets
Intangible assets from acquisition
Goodwill Comments
TeleisSoner acquired Cygate
100% 75.2 46% -41% 5% 56% 39% Allocated amounts to trade names, customer relationships, and partner agreements with suppliers; nothing to “other intangibles”.
TeliaSonera acquired debitel Danmark
100% 110.2 67% -48% 19% 14% 67% Allocated amount to customer relationships and a small amount to “other intangibles”
TeliaSonera acquired MCT
100% 192.7 54% -76% -23% 39% 83% Allocated to customer relationships, licenses, and interconnect agreements,. NO explanation for relatively large amount of goodwill. TeliaSonera
individually insignificant acquisitions
various 17 27% 73% Provided few details about composition of net assets and did not
identify intangibles separately
Vodafone2 acquired
Hutchison Essar
100% 8,072 32% -59% -28% 56% 72% Allocated relatively almost all of intangible amount to licenses and spectrum; minor amounts to “other intangibles”. Goodwill attributed to profits and synergies.
Vodafone2 acquired Tele2 activities in southern Europe
100% 644 58% 37% 21% 23% 56% The entire amount of the intangibles is allocated to “other intangibles” without explanation. Goodwill attributed to profits and synergies.
1
In millions of Euros. Approximate exchange rates on transaction dates for non-euro currencies. 2
580
Table 6. Telecom Companies reporting of acquisitions in 2008 Percentage allocated to
Company and acquisition Percent acquired Acquisition price1 Pre-acquisitio n assets (adjusted to fair values) Liabilities, minority interest and similar items Pre-acquisition net assets (adjusted to fair values) Intangible assets from acquisition
Goodwill Comments
Deutsche Telekom subsidiary acquired SunCom
100% 1,100 114% -88.8%% 24% 0% 76% Nothing allocated to intangibles from acquisition; pre-acquisition intangibles written down. Company describes goodwill as reflecting growth opportunities in the USA, customer base , synergies due to reduction of roaming costs and similar items but notably does not allocate acquisition price to customer base..
Elisa individually insignificant
acquisitions
various 6.1 57% -39% 18% 28% 54% Allocation to customer base and to immaterial rights; nothing to “other intangibles”.
French Telecom consortium acquires Telecom Kenya
51% 273 122% -131% -9% 30% 79% Allocated to customer base and software; nothing allocated to “other intangibles”. Goodwill attributed to assembled workforce, anticipated profits, and deferred taxes related to excess.
Telefonica subsidiary acquired parent and operating company Telering Brazil 91% of parent and 59% of subsidiar y
451 150% -179% -28% 121% 8% Did not provide details of amounts allocated to each intangible asset but provides extensive details elsewhere about many different intangible assets.
Telenor acquired IS Partner
100% 160 64% -48% 16% 12% 71% Allocated amounts to customer base, software, and trademarks; nothing to “other intangibles”.
Telenor individually insignifant acquisitions
various 54 ´126% -56% 22% 8% 70% Allocated to customer base, software and trademarks ; approximately 6% to “other intangibles” Goodwill is attributed to employees, anticipated profits and deferred taxes related to excess values.
TelliaSonera acquired TelenorSonera Asia
51% 348 68% -49% 20% 0% 80% Did not allocate anything to other intangibles. Reduced pre-existing goodwill (approximately 543 million euro) of acquired company to zero, No explanation of goodwill amounts.
TeliaSonera individually insignificant acquisitions
various 46 -4% 0% 104% Did not disclose details of allocations; no information about intangible assets
581 Percentage allocated to Company and
acquisition
Percent acquired
Acquisition price1
Pre-acquisitio
n assets (adjusted
to fair values)
Liabilities, minority interest and
similar items
Pre-acquisition
net assets (adjusted to fair values)
Intangible assets from acquisition
Goodwill Comments
Ghana
Telecommunications
small amount to “other intangible assets”. Goodwill is attributed to expected profits and synergies
Vodafone individually insignificant
acquisitions
various 575 30% 0% 70% Did not disclose details of allocations; no information about intangible assets
1
In millions of Euros. Approximate exchange rates on transaction dates for non-euro currencies 2
Table 2. Goodwill as a percentage of total assets by company by year
Company 2005 2006 2007 2008
Deutsche Telekom 14.4% 16.1% 17.1% 16.8%
Elisa 35.0% 36.9% 35.6% 38.3%
France Telecom 30.8% 30.5% 31.0% 32.3%
Telecom Italia 45.8% 48.9% 50.8% 51.3%
Telefonica 12.2% 19.9% 18.7% 18.3%
Telenor 16.6% 20.6% 18.4% 18.3%
TeliaSonera 30.8% 31.4% 32.8% 31.9%
Vodafone1 41.5% 37.0% 40.3% 35.3%
1
Vodafone reports on a fiscal year ending 31 March. Data are taken from the annual reports of 31 March 2006, 2007, 2008, and 2009.
Table 7. CGUs for Impairment testing purposes
Company Number of
CGUs to which goodwill has been allocated
Level of the CGUs to which goodwill has been allocated for impairment
testing
Number of Segments
Number of Subsidiaries
No. Of CGUs at each level
% of goodwill allocated to
each level Deutsche
Telekon
5 Business
unit level
5 100% 4 350
Elisa 3 Primary
segment level
3 100% 3 43
France Telecom
6 Group of
CGUs
4 98% 4 255
Primary segment level
2 2%
Telecom Italia
5 Single
company level
Busine unit lev
Telefonica n/a n/
Telenor 8 Single
compa level Primar segme level
TeliaSonera 4 Single
compa level
Vodafone 5 Primar
segme level
Figure 1. Allo
-4.80 %
Pre-acquisition net assets (adjusted to fair
values)
iness level
2 n/a
n/a n/a n/a 7
le pany
5 55% 10
ary ent
3 45%
le pany
4 100% 10
ary ent
4 100% 9
llocation of Acquisition Cost in 2005
45.30 %
59.50 %
et fair
Intangible assets from acquisition
Goodwill
340
81
60
Figure 2. Allo
Figure 3. Allo
Figure 4. Allo
8.00 %
Pre-acquisition net assets (adjusted to fair
values)
-11.60 %
Pre-acquisition net assets (adjusted to fair
values)
7.40 %
Pre-acquisition net assets (adjusted to fair
values)
llocation of Acquisition Cost in 2006
llocation of Acquisition Cost in 2007
llocation of Acquisition Cost in 2008
29.10 %
62.90 %
et fair
Intangible assets from acquisition
Goodwill
43.80 %
67.80 %
et fair
Intangible assets from acquisition
Goodwill
27.50 %
65.10 %
et fair
Intangible assets from acquisition