www.atmos-chem-phys.net/9/8975/2009/ © Author(s) 2009. This work is distributed under the Creative Commons Attribution 3.0 License.
Chemistry
and Physics
Sensitivity analyses of OH missing sinks over Tokyo metropolitan
area in the summer of 2007
S. Chatani1,*, N. Shimo1, S. Matsunaga1, Y. Kajii2, S. Kato2, Y. Nakashima2, K. Miyazaki2, K. Ishii3, and H. Ueno3
1Japan Petroleum Energy Center, Tokyo, Japan 2Tokyo Metropolitan University, Tokyo, Japan
3Tokyo Metropolitan Research Institute for Environmental Protection, Tokyo, Japan *Contracted researcher from Toyota Central R&D Labs., Inc., Aichi, Japan
Received: 8 July 2009 – Published in Atmos. Chem. Phys. Discuss.: 4 September 2009 Revised: 19 November 2009 – Accepted: 19 November 2009 – Published: 27 November 2009
Abstract. OH reactivity is one of key indicators which re-flect impacts of photochemical reactions in the atmosphere. An observation campaign has been conducted in the summer of 2007 at the heart of Tokyo metropolitan area to measure OH reactivity. The total OH reactivity measured directly by the laser-induced pump and probe technique was higher than the sum of the OH reactivity calculated from concentrations and reaction rate coefficients of individual species measured in this campaign. And then, three-dimensional air quality simulation has been conducted to evaluate the simulation performance on the total OH reactivity including “missing sinks”, which correspond to the difference between the mea-sured and calculated total OH reactivity. The simulated OH reactivity is significantly underestimated because the OH re-activity of volatile organic compounds (VOCs) and missing sinks are underestimated. When scaling factors are applied to input emissions and boundary concentrations, a good agree-ment is observed between the simulated and measured con-centrations of VOCs. However, the simulated OH reactivity of missing sinks is still underestimated. Therefore, impacts of unidentified missing sinks are investigated through sensi-tivity analyses. In the cases that unknown secondary prod-ucts are assumed to account for unidentified missing sinks, they tend to suppress formation of secondary aerosol com-ponents and enhance formation of ozone. In the cases that unidentified primary emitted species are assumed to account for unidentified missing sinks, a variety of impacts may be
Correspondence to:S. Chatani ([email protected])
observed, which could serve as precursors of secondary or-ganic aerosols (SOA) and significantly increase SOA forma-tion. Missing sinks are considered to play an important role in the atmosphere over Tokyo metropolitan area.
1 Introduction
Air quality in Japan has been improved, however, some prob-lems are still remained unresolved. NO2 concentrations at
some roadside monitoring stations located in urban area ex-ceed the Environmental Quality Standards (EQSs) in Japan. O3concentrations are gradually increasing and the EQSs for
photochemical oxidants have not been satisfied at almost all monitoring stations in whole Japan (Ministry of the Environ-ment, 2008). In addition, PM2.5concentrations in Japanese
urban areas are likely higher than the air quality standards implemented in the US and Europe.
Most of NO2, O3 and PM2.5 are secondarily produced
through photochemical reactions in the atmosphere. Their concentrations nonlinearly respond to emissions of various precursors (Meng et al., 1997). In order to consider how to reduce concentrations of secondary products, it is necessary to perform simulations using a three-dimensional air qual-ity model in which complex photochemical reactions are in-volved. However, it is inevitably important to determine the reliability of the simulation results, that is, whether simulated responses of secondary products to precursor emissions are reliable. Observation data of critical pollutants (e.g. NO2and
O3) are mainly used for validation, but more thorough
Though progresses in measuring instruments and tech-niques have realized identification of various trace species, many atmospheric trace species have remained unidentified. Their importance on photochemical reactions needs to be evaluated. Total OH reactivity is one of key indicators which reflect the impacts of identified and unidentified species on photochemical reactions and secondary products. It is also useful as an indicator to validate the three-dimensional air quality simulations in terms of complex photochemical reac-tions.
A technique to directly measure total OH reactivity has been developed by Sadanaga et al. (2004b, 2005b) and Yoshino et al. (2006) used this technique to perform direct measurement of total OH reactivity at Hachioji, Japan, which is located about 30 km west of the heart of Tokyo metropoli-tan area. As well as total OH reactivity, they measured con-centrations of various species and calculated OH reactivity from concentrations of measured species and their known re-action rate coefficients with OH. They found that the directly measured total OH reactivity was always higher than the sum of the OH reactivity of measured individual species. The dif-ference between the measured and calculated total OH re-activity is called “missing sinks”, which may affect photo-chemical reactions and secondary product formation in the atmosphere.
In order to further investigate the impacts of missing sinks within the metropolitan area, an observation campaign has been conducted in the summer of 2007 at the heart of Tokyo metropolitan area. Total OH reactivity and concentrations of various species were measured in this campaign. And then, we executed the three-dimensional air quality model and compared the simulation results with the observation results. The air quality models treat photochemical reactions in ag-gregated forms as in CB4 (Gery et al., 1989) and SAPRC99 (Carter, 2000) chemical mechanisms. Missing sinks should be part of some aggregated species groups defined in the chemical mechanisms. To validate the simulations in terms of photochemical reactions, we have examined whether the simulation can reproduce the measured total OH reactivity including missing sinks. In addition, we have conducted sen-sitivity analyses to investigate the impacts of missing sinks on photochemical reactions and secondary products.
Measurements of total OH reactivity were conducted also in other countries. Di Carlo et al. (2004) measured total OH reactivity in a northern Michigan forest. The airborne mea-surements of total OH reactivity were conducted by Mao et al. (2009) during INTEX-B observation campaign which was focused on the Asian pollution outflow over Pacific Ocean. In the urban environment, total OH reactivity was measured at New York City (Ren et al., 2003), Mexico City (Shirley et al., 2006), Mainz (Sinha et al., 2008), and Guangzhou (Hofzumahaus et al., 2009). Most of these studies have im-plied existence of missing sinks in the atmosphere. Simple steady-state calculations and box model simulations in which detailed chemical mechanisms are incorporated are often
used to analyse measurement results, but comparison with three-dimensional air quality simulations has been scarce.
On the other hand, validations of three-dimensional air quality simulations have been conducted recently in terms of OH reactivity. Steiner et al. (2008) and Stroud et al. (2008) investigated OH reactivity in central California and Canada, respectively. They calculated OH reactivity from measured and simulated concentrations of various species, and com-pared them. However, measured total OH reactivity and missing sinks were not used directly in these papers. In this study, simulated OH reactivity is compared with the directly measured OH reactivity including missing sinks. In addition, impacts of missing sinks are investigated through sensitivity analyses.
An overview of the three-dimensional air quality simula-tions are described in Sect. 2. A brief description of the ob-servation campaign is provided in Sect. 3. Performance of the three-dimensional air quality simulation for OH reactiv-ity is described in Sect. 4. Results of sensitivreactiv-ity analyses of missing sinks are described in Sect. 5. And the outcomes are summarized in Sect. 6.
2 Overview of three-dimensional air quality simulations
We have developed a three-dimensional air quality simula-tion framework which consists of the Weather Research and Forecasting (WRF) model for meteorology, the Community Multi-scale Air Quality (CMAQ) modeling system for pollu-tant concentrations, and emission inventory models. Details of the simulation are described below.
2.1 Target domains
domain are done separately, while calculations of Japan and Kanto domains are done simultaneously using a two-way nesting approach. In CMAQ simulation, calculations of East Asia, Japan and Kanto domains are done consecutively using a one-way nesting approach.
2.2 Input emission data
Motor vehicle emission inventory model developed under Japan AuTo-Oil Program (JATOP) (Japan Petroleum Energy Center, 2009) is used to calculate motor vehicle emission inventories in Japan. The model can estimate hourly run-ning, start and evaporative emissions. Georeference-Based Emission Activity Modeling System (GBEAMS) (Nansai et al., 2004) is used to calculate hourly emissions from anthro-pogenic sources except for vehicles in Japan. Regional Emis-sion inventory in ASia (REAS) ver. 1.11 (Ohara et al., 2007) is used for preparing anthropogenic emissions in East Asia domain. Model of Emissions of Gases and Aerosols from Nature (MEGAN) v2.04 (Guenther et al., 2006) is used to estimate biogenic VOC emissions.
2.3 Meteorology and air quality models
WRF-ARW ver. 2.2.1 (Skamarock et al., 2005) is used to prepare meteorological fields. NCEP Final Analysis data are used to provide initial and boundary conditions, and to per-form grid nudging. CMAQ ver. 4.6 (Byun et al., 2006) is used to simulate pollutant concentrations in the atmosphere. The default datasets provided with CMAQ are used as initial concentrations in all domains and boundary concentrations in East Asia domain. Simulations are started one month be-fore the observation campaign as a spin-up period to elim-inate influence of initial concentrations. SAPRC99 (Carter, 2000) is chosen for the chemical mechanism. Table 1 shows relationships between the species measured in the observa-tion campaign and the SAPRC99 species which react with OH. Measured species are allocated to one of the SAPRC99 species. These SAPRC99 species are further merged into species groups - abbreviated as AVOC, BVOC and OVOC – as shown in Table 1. However, no measured species are allo-cated to the SAPRC99 species listed in the “missing sinks” group in Table 1, which are treated as missing sinks in this paper.
3 Overview of the observation campaign
Overview of the observation campaign is described in this section. And the details have been published by Nakashima et al. (2009).
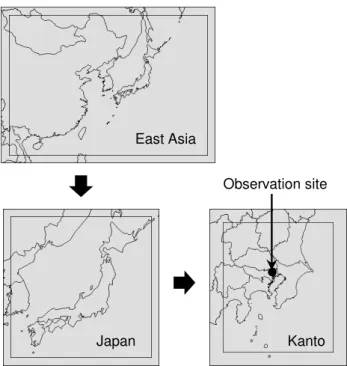
An observation campaign has been conducted from 21 to 29 August 2007 in Koto-Ku, Tokyo, which is close to the heart of Tokyo metropolitan area as shown in Fig. 1. OH re-activity and VOC concentrations were measured during day-time of 21, 22, 23, 26 and 27 August. Wind direction was
East Asia
Japan Kanto
Observation site
Fig. 1.Target domains of the simulation, with outer lines indicating WRF domains, while inner lines indicating CMAQ domains, and showing the position of the observation site.
consistently southerly but changed to north-westerly only on 23 August. In order to avoid influences of different wind directions, data obtained on 21, 22, 26 and 27 August are used for the analysis of this paper. Ambient air is intro-duced into the reaction flow tube. A laser beam is used to irradiate the incident window of the reaction tube and OH radicals are artificially generated. Changes in OH concentra-tions are detected by the laser-induced pump and probe tech-nique. Total OH reactivity is represented by the decay rate of OH. In addition, measurements have been conducted on con-centrations of critical species (NO2, NO, O3, CO and SO2),
various individual non-methane hydrocarbons (NMHCs) and oxygenated volatile organic compounds (OVOCs). All of measured species and corresponding SAPRC99 species are listed in Table 1. It must be stated that some of species listed in Table 1 react with not only OH but also NO3, O3and other
species in the real atmosphere and simulations. However, they exclusively react with OH in the reaction tube because concentration of generated OH is much higher than other re-actants. Therefore, interference by reactions with other reac-tants can be ignored.
Table 1.Relationships among species group, SAPRC99 species and individual species measured in the observation campaign in this study.
Species SAPRC99 Measured group species species
NO2 NO2 NO2
NO NO NO
O3 O3 O3
CO CO CO
SO2 SO2 SO2
AVOC ALK1 ethane
ALK2 acetylene, propane
ALK3 isobutane, n-butane, 2,2-dimethylbutane
ALK4 2,3-dimethylbutane, isopentane, n-pentane, cyclopentane,
2-methylpentane, 3-methylpentane, n-hexane, methylcyclopentane, 2,4-dimethylpentane, 2,2,4-trimethylpentane
ALK5 cyclohexane, 2-methylhexane, 2,3-dimethylpentane, 3-methylhexane, n-heptane, methylcyclohexane,
2,3,4-trimethylpentane, 2-methylheptane, 3-methylheptane, n-octane, n-nonane
ETHENE Ethene
OLE1 propylene, 1-butene, 3-methyl-1-butene, 1-pentene, 4-methyl-1-pentene
OLE2 butadiene, trans-2-butene, cis-2-butene, trans-2-pentene, cis-2-pentene, 2-methyl-2-butene, cyclopentene,
2-methyl-1-pentene, trans-2-hexene, cis-2-hexene, styrene ARO1 benzene, toluene, ethylbenzene, iso-propylbenzene,
n-propylbenzene
ARO2 p,m-xylene, o-xylene, 1,3,5-trimethylbenzene, 1,2,4-trimethylbenzene
BVOC ISOPRENE Isoprene
TRP1 α-pinene, camphene,β-pinene, limonene
OVOC MEOH methanol
HCHO formaldehyde CCHO acetaldehyde
ACET acetone
Missing NO3, HNO3, HONO, HO2, HNO4, HO2H, COOH, ROOH, RNO3, MEK, sinks PROD2, CCO OOH, RCO OH, PHEN, HCOOH, RCHO, GLY, MGLY, CRES,
BALD, METHACRO, MVK, ISOPROD, DCB1, DCB2, DCB3
reaction. The rate coefficient for the NO2+OH reaction has
large uncertainty. Sadanaga et al. (2004a) mentioned discrep-ancy in it among major databases and its importance for eval-uation of OH reactivity. Then, Sadanaga et al. (2005a) mea-sured the rate coefficient for the NO2+OH reaction under the
atmospheric pressure. This value is used in this study. The directly measured values of total OH reactivity are mostly higher than the sum of the calculated OH reactivity. It im-plies the existence of missing sinks in the atmosphere over Tokyo metropolitan area.
Figure 3 shows contribution of species groups to the di-rectly measured OH reactivity which is averaged over the target period. NO2 and AVOC are major contributors, but
fraction of the missing sinks is larger than that of NO2 and
AVOC. Therefore, it implies that missing sinks are playing
an important role in photochemical reactions and secondary product formation in the atmosphere over Tokyo metropoli-tan area.
20 30 40 50 60
re
a
c
ti
v
ity
(
s
-1)
Directly measured Calculated
0 10 20 30 40 50 60
9 10 11 12 13 14 15 16 17
O
H
r
e
a
c
ti
v
ity
(
s
-1)
Hour
Directly measured Calculated
Fig. 2. Directly measured and calculated total OH reactivity, of which calculations are obtained from concentrations and reaction rate coefficients of the measured species on 21 August.
NO2 21%
NO 2% CO+O3
+SO2
CH Missing
sinks 29%
NO2 21%
NO 2% CO+O3
+SO2
+CH4
7% Anthro-pogenic
VOC 21% Biogenic
VOC 6%
Oxyge-nated VOC 13%
Missing sinks
29%
Fig. 3. Contribution of species groups to directly measured OH reactivity which is averaged over the target period.
as well as missing sinks which really exist in the atmosphere. They are within the scope of this study.
4 Results of the simulation
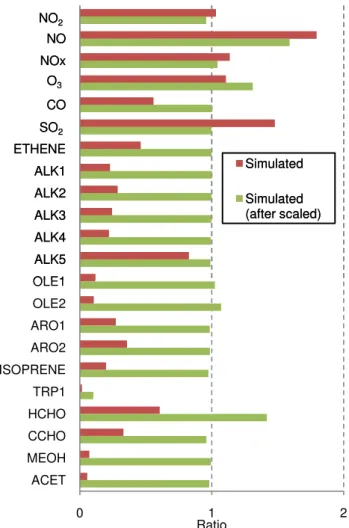
The three-dimensional air quality simulation was executed for the period including daytime of 21, 22, 26 and 27 Au-gust 2007. Figure 4 shows ratios of the simulated concen-trations to the measured concenconcen-trations of SAPRC99 species which is averaged over the target period. Ratios of almost all of SAPRC99 VOC species are significantly lower than 1.0. The most probable reason for the underestimation is due to the emission inventory. Solvent use is recognized as a major contributing source to total VOC emissions in Japan (Kan-nari et al., 2007), however, the emission estimates have large uncertainty. Their special and temporal distribution is also not well known. Obviously, more works are required to im-prove the emission inventory estimation, especially for VOC emissions. Another possible reason for the underestimation
NO
NOx
CO
ETHENE
ALK1
ALK2
ALK3
ALK4
ALK5
OLE1
Simulated
Simulated (after scaled)
NO2
O3
SO2
0 1 2
NO
NOx
CO
ETHENE
ALK1
ALK2
ALK3
ALK4
ALK5
OLE1
OLE2
ARO1
ARO2
ISOPRENE
TRP1
HCHO
CCHO
MEOH
ACET
Ratio
Simulated
Simulated (after scaled)
NO2
O3
SO2
Fig. 4. Ratios of simulated to measured concentrations of SAPRC99 species which are averaged over the target period before and after application of scaling factors.
is meteorological conditions during the observation cam-paign. Wind direction in daytime is mostly southerly dur-ing the target period. The observation site is located in a few kilometres north of Tokyo Bay. There are few major pollutant sources in the south of the measurement site. It is well known that pollutant distribution over the coastal area of Tokyo Bay is affected by sea-land breeze and heat-island effect (Yoshikado, 1992). It is considered the simulation may have difficulty in reproducing detailed wind flow patterns caused by these factors.
Here, we assume a situation where the challenges in sim-ulation stated above are resolved. Scaling factors for each SAPRC99 species are uniformly applied to input emissions and boundary concentrations. Scaling factors are defined by inverse numbers of the ratios shown in Fig. 4. The same scal-ing factors determined from NOx(NO+NO2) are applied to
NO and NO2to keep the ratios of NO and NO2in NOx
emis-sions. O3 has no emission and scaling factors are applied
0 10 20 30 40 50 60
9 17 9 17 9 17 9 17
NO
2
(ppb)
8/21 8/22 8/26 8/27
a) NO2
Measured
Simulated
Simuated (after scaled) 0
5 10 15 20 25
9 17 9 17 9 17 9 17
NO
(ppb)
8/21 8/22 8/26 8/27 b) NO
0 50 100 150 200
9 17 9 17 9 17 9 17 O3
(pp
b)
8/21 8/22 8/26 8/27
c) O3
0 100 200 300 400 500 600 700
9 17 9 17 9 17 9 17
C
O
(p
p
b
)
8/21 8/22 8/26 8/27 d) CO
0 5 10 15 20
9 17 9 17 9 17 9 17
SO
2
(ppb)
8/21 8/22 8/26 8/27
e) SO2
0 20 40 60 80 100 120
9 17 9 17 9 17 9 17
AV
O
C
(
p
p
b
)
8/21 8/22 8/26 8/27 f) AVOC
0 0.5 1 1.5 2 2.5
9 17 9 17 9 17 9 17
B
V
OC
(
p
p
b
)
8/21 8/22 8/26 8/27 g) BVOC
0 50 100 150 200 250
9 17 9 17 9 17 9 17
OVOC
(
p
p
b
)
8/21 8/22 8/26 8/27 h) OVOC
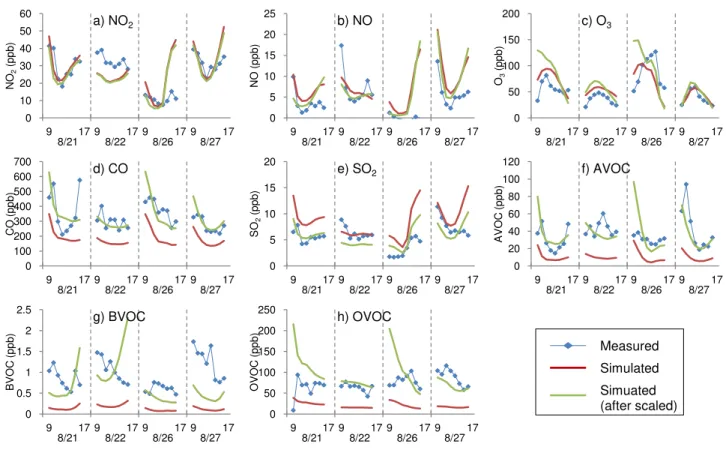
Fig. 5.Time series of measured and simulated concentrations of species groups before and after application of scaling factors.
twice to bring the simulated concentrations closer to the mea-sured concentrations. TRP1 is excluded from this procedure, because it is originated from biogenic sources, and uniform scaling factors defined in the metropolitan area may cause a significant overestimation in rural areas. Ratios of the simu-lated concentrations to the measured concentrations obtained by application of scaling factors are also shown in Fig. 4. Ratios of O3 and HCHO are not close to 1.0 because they
are largely affected by secondary products. Ratio of NO is also high after application of scaling factors. It is sen-sitive to various external factors because NO concentration and its fraction in NOx are low throughout the target
pe-riod. Relatively small scaling factors determined by NOxare
not enough to match NO concentration. In addition, NO is largely affected by O3in the NO+O3reaction. There are
dif-ficulties in achieving an agreement between measured and calculated concentrations for these species. Except for these species, the procedure makes the ratios closer to 1.0.
Figure 5 shows time series of the measured and simu-lated hourly concentrations of species groups before and af-ter application of scaling factors. The absolute level and hourly variations of concentrations of critical species are re-produced well. However, the simulated concentrations of AVOC, BVOC and OVOC are significantly underestimated before application of scaling factors. Application of scaling factors makes their concentrations closer to the measured
values. Hourly variations of AVOC and OVOC are also re-produced well. Figure 6 shows time series of the measured and simulated hourly total OH reactivity before and after ap-plication of scaling factors. Simulated total OH reactivity is calculated from the simulated concentrations of SAPRC99 species and their reaction rate coefficients with OH defined in SAPRC99. The measured total OH reactivity tends to be high in the morning and evening, while low around noon. Such hourly variations in total OH reactivity are reproduced in the simulations; however, the values are underestimated before application of scaling factors. Application of scaling factors also makes the simulated OH reactivity closer to the measured value.
0
10
20
30
40
50
60
OH
re
activ
ity
(s
-1
)
0
10
20
30
40
50
60
9
17 9
17 9
17 9
17
OH
re
activ
ity
(s
-1
)
Measured
Simulated
Simulated (after scaled)
8/21
8/22
8/26
8/27
Fig. 6. Time series of measured and simulated total OH reactivity before and after application of scaling factors.
As shown in Fig. 4, the simulated concentrations of each species included in AVOC show a good agreement with the measured values, which leads to an expectation that the sim-ulated OH reactivity of AVOC will achieve a good agreement with the measured values. However, the fact is that the sim-ulated OH reactivity of AVOC is higher than the measured value. It indicates that reaction rate coefficients of AVOC with OH in SAPRC99 are higher than those of measured AVOC species. One possible reason is that SAPRC99 as-sumes the existence of species which are never measured in the observation campaign and having higher reaction rate co-efficients with OH than those of measured AVOC species. If such species really exist in the atmosphere, they may be included in the missing sinks in measured total OH reactiv-ity. In addition, not only the simulated OH reactivity but also simulated concentrations of AVOC should be higher than the measured values. Impacts of the missing sinks for which AVOC might account will be discussed in the next section. Another possible reason is that SAPRC99 is not suit-able for simulating the atmosphere over Tokyo metropolitan area. A lumping approach in which VOC species are com-bined into groups is used in SAPRC99, which might result in the differences in measured and calculated OH reactivity of VOC groups over Tokyo metropolitan area. The simu-lated OH reactivity of OVOC is higher than the measured OH reactivity, simply because HCHO is still overestimated after application of scaling factors. Better agreement may be achieved between measured and simulated OH reactiv-ity if simulated concentrations of HCHO could be agreed with the measured values. The simulated OH reactivity of missing sinks (5.3 s−1) is lower than the measured value
(8.5 s−1). The simulation can explain about 60% of the
measured OH reactivity of missing sinks by species groups
6.3
7.4 3.9
5.1 8.5
5.3 Measured
Simulated
Simulated (after scaled)
6.3
7.4 3.9
5.1 8.5
5.3
0 5 10 15 20 25 30 35
Measured
Simulated
Simulated (after scaled)
OH reactivity (s-1)
NO2 NO O3+CO+SO2 AVOC
BVOC OVOC Missing sinks
Fig. 7. Measured and simulated OH reactivity of species groups which is averaged over the target period before and after applica-tion of scaling factors. Contribuapplica-tion of species groups except for missing sinks in measured OH reactivity is obtained from measured concentrations of species and their reaction rate coefficients. OH reactivity of missing sinks in measured OH reactivity is obtained by subtracting sum of OH reactivity of species groups from directly measured OH reactivity.
treated in SAPRC99, however, remaining 40% cannot be ex-plained. Impacts of remaining unexplained missing sinks (about 3.0 s−1) will be discussed through sensitivity
analy-ses in the next section.
5 Sensitivity analyses of OH missing sinks
As shown in the previous section, the simulated OH reac-tivity of missing sinks is about 3.0 s−1 lower than the
mea-sured value. Possible candidates for unexplained missing sinks are unknown secondary products and unidentified pri-mary emitted species. Sensitivity analyses are conducted to investigate their impacts on photochemical reactions and sec-ondary product formation in the atmosphere. The simulation in which scaling factors are applied to input emissions and boundary concentrations (described in the previous section) is used as the base case in the sensitivity analyses.
5.1 Impacts of unknown secondary products
RCHO
1.60s
-1(30%)
Others
2.77s
-1(52%)
RCHO
1.60s
-1(30%)
DCB1
0.55s
-1(10%)
PROD2
0.41s
-1(8%)
Others
2.77s
-1(52%)
Fig. 8.Contribution of SAPRC species to simulated OH reactivity of missing sinks which is averaged over the target period in the base case.
and PROD2 represents a group of ketones and other non-aldehyde oxygenated products which react with OH radicals faster than 5×10⁻¹²cm3molec−2s−1 (Carter, 2000).
Con-tribution of these groups to the simulated OH reactivity of missing sinks is 30% for RCHO, 10% for DCB1 and 8% for PROD2, respectively. They are major secondary prod-ucts in the simulation, so that their impacts are investigated here. In order to increase their concentrations in sensitivity analyses, factors are multiplied to the individual yield of the groups (RCHO, DCB1 and PROD2) in SAPRC99 reactions, and then simulations are conducted for the three cases: chg-RCHO, chg-DCB1 and chg-PROD2. Multiplied factors to the yields for RCHO, DCB1 and PROD2 to add 3.0 s−1 to
their OH reactivity are 4.6/1.6, 3.6/0.6 and 3.4/0.4, respec-tively.
Figure 9 shows the simulated OH reactivity of the species groups which is averaged over the target period for the base, chg-RCHO, chg-DCB1 and chg-PROD2 cases. The OH reactivity increases by more than 3.0 s−1 because
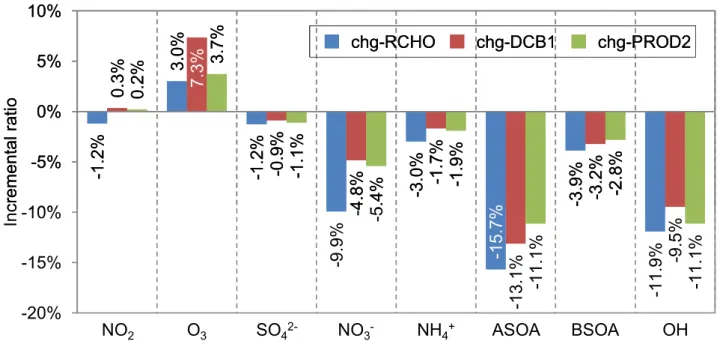
in-creased RCHO, DCB1 and PROD2 form species which re-act with OH in subsequent rere-actions. Figure 10 shows in-cremental ratios of concentrations of NO2, O3, ambient OH
and secondary aerosol components including SO24−, NO−3, NH+
4, anthropogenic secondary organic aerosol (ASOA)
and biogenic SOA (BSOA) in the chg-RCHO, chg-DCB1 and chg-PROD2 cases compared to those in the base case which are averaged over the target period. Those of other remaining species are shown in Fig. S1 in Sup-plementary material: http://www.atmos-chem-phys.net/9/ 8975/2009/acp-9-8975-2009-supplement.pdf. O3increases
slightly while incremental ratios differ among the three cases. The ambient OH decreases in all cases because
7.4
7.7
7.6
7 6
5.1
6.2
5.4
5 6 5.3
8.8
10.1
9 2 Base
chg-RCHO
chg-DCB1
chg-7.4
7.7
7.6
7.6
5.1
6.2
5.4
5.6 5.3
8.8
10.1
9.2
0 5 10 15 20 25 30 35
Base
chg-RCHO
chg-DCB1
chg-PROD2
OH reactivity (s-1)
NO2 NO O3+CO+SO2 AVOC
BVOC OVOC Missing sinks
Fig. 9.Simulated OH reactivity of species groups which is averaged over the target period in the base, RCHO, DCB1 and chg-PROD2 cases.
additional OH is consumed by the increased RCHO, DCB1 and PROD2. As a result, oxidation of the precursors by OH is suppressed, and the decrease is observed in SO2−
4 , NO
−
3
ASOA and BSOA which are major oxidized products. In addition to oxidation by OH, SO2−
4 is produced via the
aque-ous reaction of SO2 and H2O2, NO−3 is produced via
oxi-dation of NO2to NO3and N2O5by O3and the subsequent
heterogeneous reaction with H2O, and ASOA and BSOA are
produced via oxidation of precursors by O3and NO3. H2O2
and NO3as well as O3increase in all cases, but SO24−, NO−3
ASOA and BSOA decrease. Therefore, oxidation by OH is more influential than reactions with other species in the three cases. NH+
4 also decreases because of decreased SO
2−
4 and
NO−3, which are anions coupling mainly with NH+4. NO2is
mainly produced in the NO+O3reaction, and is oxidized by
OH. Production is enhanced by increased O3 and oxidation
is suppressed by decreased OH. But in fact, NO2decreases
in the RCHO case and increase only slightly in the chg-DCB1 and chg-PROD2 cases. Peroxy acyl radicals are major products in the RCHO+OH reaction, and they are converted to peroxy acyl nitrates via the reaction with NO2. Their
pro-duction appears to compensate increase of NO2especially in
-1
.2
%
3.
0%
-1
.2
%
-3
.0
%
%
-3.
9
%
0.
3%
7.3%
-0.
9
%
4
.8%
-1.
7
%
-3
.2
%
0.2%
3.
7%
-1
.1
%
5
.4
%
-1.
9
%
-2
.8
%
10%
-5%
0%
5%
10%
c
re
ment
al
rat
io
chg-RCHO
chg-DCB1
chg-PROD2
-1
.2
%
3.
0%
-1
.2
%
-9
.9
%
-3
.0
%
-15.
7%
-3.
9
%
-11.
9%
0.
3%
7.3%
-0.
9
%
-4
.8
%
-1.
7
%
-13.
1%
-3
.2
%
-9
.5
%
0.2%
3.
7%
-1
.1
%
-5.
4
%
-1.
9
%
-11.
1%
-2
.8
%
-11.1%
-20%
-15%
-10%
-5%
0%
5%
10%
Inc
rement
al
rat
io
NO
2O
3SO
42-NO
3-
NH
4+ASOA
BSOA
OH
chg-RCHO
chg-DCB1
chg-PROD2
Fig. 10. Incremental ratios of concentrations of NO2, O3, OH and secondary aerosol components in the RCHO, DCB1 and
chg-PROD2 cases compared to those in the base case, which are averaged over the target period.
ALK5
0.33s
-1(4%)
OLE2
1.18s
-1(16%)
ARO2
1.30s
-1(18%)
Others
4.6s
-1(62%)
ALK5
0.33s
-1(4%)
OLE2
1.18s
-1(16%)
ARO2
1.30s
-1(18%)
Others
4.6s
-1(62%)
Fig. 11.Contribution of SAPRC species to the simulated OH reac-tivity of AVOC which is averaged over the target period in the base case.
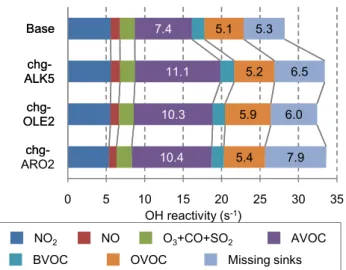
5.2 Impacts of unidentified primary emitted species
Figure 11 shows contribution of SAPRC99 species to the simulated OH reactivity of AVOC which is averaged over the target period in the base case. Contribution of ALK5, OLE2 and ARO2 to the simulated OH reactivity of AVOC is 4%, 16% and 18%, respectively. They are aggregated species groups which have the highest reaction rate coefficients with OH among alkanes, olefins and aromatic compounds in SAPRC99. In the previous section, reaction rate coefficients
of SAPRC99 AVOC species are higher than those of mea-sured values. If missing sinks which correspond to AVOC exist in the atmosphere, they are likely to have higher re-action rate coefficients and account for ALK5, OLE2 and ARO2. Therefore, factors are multiplied to input emissions and boundary concentrations of ALK5, OLE2 and ARO2 in-dividually, and then the simulation is conducted for these three cases: chg-ALK5, chg-OLE2 and chg-ARO2. Multi-plied factors of ALK5, OLE2 and ARO2 to add 3.0 s−1 to
their OH reactivity are 3.3/0.3, 4.2/1.2 and 4.3/1.3, respec-tively.
Figure 12 shows the simulated total OH reactivity of the species groups which is averaged over the target period in the base, chg-ALK5, chg-OLE2 and chg-ARO2 cases. The OH reactivity of AVOC increased by about 3.0 s−1 in the
chg-OLE2 and chg-ARO2 cases, while by more than 3.0 s−1 in
the chg-ALK5 case. The OH reactivity of OVOC and miss-ing sinks slightly increases in all cases due to formation of secondary products from increased AVOC, and a resulting increase in the total OH reactivity is more than 3.0 s−1.
Fig-ure 13 shows incremental ratios of concentrations of NO2,
O3 and secondary aerosol components in the chg-ALK5,
chg-OLE2 and chg-ARO2 cases compared to those in the base case which is averaged over the target period. Those of other remaining species are shown in Fig. S2 in Supple-mentary material: http://www.atmos-chem-phys.net/9/8975/ 2009/acp-9-8975-2009-supplement.pdf. Signs and magni-tudes of incremental ratios have a wider variety than cases for unknown secondary products. O3 increases slightly,
7.4
11.1
10.3
10 4 5.1
5.2
5.9
5 4 5.3
6.5
6.0
7 9 Base
chg-ALK5
chg-OLE2
chg-7.4
11.1
10.3
10.4 5.1
5.2
5.9
5.4 5.3
6.5
6.0
7.9
0 5 10 15 20 25 30 35
Base
chg-ALK5
chg-OLE2
chg-ARO2
OH reactivity (s-1)
NO2 NO O3+CO+SO2 AVOC
BVOC OVOC Missing sinks
Fig. 12. Simulated OH reactivity of species groups which is aver-aged over the target period in the base, chg-ALK5, chg-OLE2 and chg-ARO2 cases.
OH decreases in the chg-ALK5 case due to increased ALK5. As a result, available ambient OH for the reaction with ALK5 decreases, and then the OH reactivity of AVOC in-creases by more than 3.0 s−1 in the chg-ALK5 case. On
the other hand, ambient OH slightly increases in the chg-OLE2 and chg-ARO2 cases. It is difficult to identify rea-sons for increase of ambient OH because concentrations of a lot of species change especially in the chg-ARO2 case as shown in Fig. S2: http://www.atmos-chem-phys.net/9/8975/ 2009/acp-9-8975-2009-supplement.pdf. Products from pho-tochemical reactions of OLE2 and ARO2 seem to contribute to the increase in ambient OH. Changes of SO24−can be ex-plained clearly by changes of OH and H2O2. The situation is
much complicated for NO2and NO−3. In the chg-ALK5 case,
production of NO2via the NO+O3reaction is enhanced by
increased O3, and conversion of NO2to NO−3 is suppressed
by decreased OH. Therefore, NO2increases but production
of organic nitrates diminishes increase of NO2. On the other
hand, in the chg-OLE2 and chg-ARO2 cases, conversion of NO2to NO−3 is enhanced by increased OH. However, NO−3
decreases in the chg-OLE2 case because influence of pro-duction of peroxy acyl nitrates is larger than conversion to NO−3. ASOA concentrations increase significantly in the chg-ALK5 and chg-ARO2 cases because ALK5 and ARO2 are precursors of ASOA in SAPRC99. SOA formation is en-hanced when organics mass concentrations in particle phase are high (Odum et al., 1996; Schell et al., 2001). Therefore, BSOA also increases in both cases. BSOA is also produced via oxidation of precursors by OH and O3. O3increases only
slightly and OH decreases in the ALK5 case. As a result, TRP1, which is a precursor of BSOA, increases while BSOA increases significantly. Therefore, increase of ASOA appears to be main reasons for significant increase of BSOA.
Based on the results described above, it can be said that the impacts of missing sinks are diversified in the cases that missing sinks are unidentified primary emitted species. Some species suppress, while others enhance the oxidation by OH. Some species could increase SOA formation. All of uniden-tified primary emitted species increase O3formation. In
gen-eral, a lot of three-dimensional air quality simulations are facing problems of significant underestimation of organic aerosols (Volkamer et al., 2006). Presence of unidentified primary emitted species which are neglected in the simula-tion but play an important role as ASOA precursors in the atmosphere may be one of the reasons for underestimated or-ganic aerosols.
6 Summary
The three-dimensional air quality simulations are applied to the observation campaign which has been conducted in the summer of 2007, during which total OH reactivity and con-centrations of various species were measured at the heart of Tokyo metropolitan area. The simulated total OH reactiv-ity is significantly underestimated because of the underes-timation of the simulated OH reactivity of AVOC, BVOC, OVOC and missing sinks. Emission inventory data is re-quired to be improved. Concentrations of individual VOC species reflect strength of emissions from specific sources. They can be used as fingerprints of sources. As shown in Fig. 4, ratios of simulated to measured concentrations vary among species. Based on discrepancy between simulated to measured concentrations of individual species groups, over-estimated or underover-estimated VOC sources may be able to be identified. Coupled analyses with the receptor modelling are also desirable. However, databases are not enough to con-duct such analyses. Data on VOC emission profiles of vari-ous sources as well as ambient concentrations of individual VOC species are scarce in Japan. More measurement data at different places and periods are needed to contribute to a thorough improvement of the emission inventory.
After application of scaling factors to input emissions and boundary concentrations, a good agreement is obtained be-tween the simulated concentrations of most species groups and the measured concentrations. However, the simulated OH reactivity of missing sinks is still underestimated. This result implies that simulations are not accurate enough in terms of photochemical reactions even if concentrations of major species are simulated well. Based on the results of sen-sitivity analyses, unidentified missing sinks could suppress formation of secondary aerosol components and enhance for-mation of O3, while could increase SOA production
0
.5
%
1
.8%
143%
29.
2%
5.
0%
0
.1
%
0
.2%
2
.4%
14.5%
0
.2
%
3
.6%
0
.8
%
133%
27.
1%
5.3%
30%
60%
90%
120%
150%
c
re
ment
al
rat
io
chg-ALK5
chg-OLE2
chg-ARO2
0.
5%
1.8%
-1
.6
%
-13.
9%
-4.
0
%
143%
29.
2%
-18.2%
-0.
6
%
5.
0%
0.
1%
-5
.5
%
-1.
0
%
-0.
8
%
0.2%
2.4%
-3.
9
%
14.5%
0.
2%
3.6%
0.
8%
133%
27.
1%
5.3%
-60%
-30%
0%
30%
60%
90%
120%
150%
Inc
rement
al
rat
io
NO
2O
3SO
42-NO
3-
NH
4+ASOA
BSOA
OH
chg-ALK5
chg-OLE2
chg-ARO2
Fig. 13. Incremental ratios of concentrations of NO2, O3, OH and secondary aerosol components in the ALK5, OLE2 and
chg-ARO2 cases compared to those in the base case, which are averaged over the target period.
and revealing their photochemical reaction path and rate co-efficients are essential to reduce the uncertainties. Advances in measurement instruments and techniques will be required to identify the missing sinks.
Acknowledgements. This study was conducted as part of Japan
Auto-Oil Program (JATOP) which is a joint research program between automobile and petroleum industries and administered by Japan Petroleum Energy Center.
Edited by: A. Hofzumahaus
References
Atkinson, R.: Gas-phase tropospheric chemistry of organic com-pounds, J. Phys. Chem. Ref. Data, Monograph, 2, 1–216, 1994. Atkinson, R.: Gas-phase tropospheric chemistry of volatile organic
compounds, 1. Alkanes and alkenes, J. Phys. Chem. Ref. Data, 26, 215–290, 1997.
Atkinson, R., Baulch, D. L., Cox, R. A., Hampson, R. F., Kerr, J. A., Rossi, M. J., and Troe, J.: Evaluated kinetic and photochemical data for atmospheric chemistry: Supplement VI – IUPAC sub-committee on gas kinetic data evaluation for atmospheric chem-istry, J. Phys. Chem. Ref. Data, 26, 1329–1499, 1997.
Byun, D. and Schere, K. L.: Review of the governing equations, computational algorithms, and other components of the Models-3 Community Multiscale Air Quality (CMAQ) modeling system, Appl. Mech. Rev., 59, 51–77, 2006.
Calvert, J. G., Derwent, R. G., Orlando, J. J., Tyndall, G. S., and Wallington, T. J.: Mechanisms of Atmospheric Oxidation of the Alkanes, Oxford University Press, New York, 1008 pp., 2008.
Carter, W. P. L.: Implementation of the SAPRC-99 chemical mech-anism into the models-3 framework, Report to the United States Environmental Protection Agency, 2000.
Di Carlo, P., Brune, W. H., Martinez, M., Harder, H., Lesher, R., Ren, X., Thornberry, T., Carroll, M. A., Young, V., Shepson, P. B., Riemer, D., Apel, E., and Campbell, C.: Missing OH reactiv-ity in a forest: Evidence for unknown reactive biogenic VOCs, Science, 304, 722–725, 2004.
Gery, M. W., Whitten, G. Z., Killus, J. P., and Dodge, M. C.: A photochemical kinetics mechanism for urban and regional scale computer modelling, J. Geophys. Res., 94, 12925–12956, 1989. Guenther, A., Karl, T., Harley, P., Wiedinmyer, C., Palmer, P. I.,
and Geron, C.: Estimates of global terrestrial isoprene emissions using MEGAN (Model of Emissions of Gases and Aerosols from Nature), Atmos. Chem. Phys., 6, 3181–3210, 2006,
http://www.atmos-chem-phys.net/6/3181/2006/.
Hofzumahaus, A., Rohrer, F., Lu, K., Bohn, B., Brauers, T., Chang, C.-C., Fuchs, H., Holland, F., Kita, K., Kondo, Y., Li, X., Lou, S., Shao, M., Zeng, L., Wahner, A., and Zhang, Y.: Amplified trace gas removal in the troposphere, Science, 324, 1702–1704, 2009.
Japan Petroleum Energy Center: http://www.pecj.or.jp/english/ jcap/jatop/index jatop.html, last access: 7 July 2009, 2009. Kannari, A., Tonooka, Y., Baba, T., and Murano, K.: Development
of multiple-species 1 km×1 km resolution hourly basis emissions inventory for Japan, Atmos. Environ., 41, 3428–3439, 2007 Meng, Z., Dabdub, D., and Seinfeld, J. H.: Chemical coupling
be-tween atmospheric ozone and particulate matter, Science, 277, 116–119, 1997.
Ministry of the Environment: http://www.env.go.jp/air/osen/index. html, last access: 7 July 2009, 2008.
D. R., Sachse, G. W., Diskin, G. S., Hall, S. R., and Shetter, R. E.: Airborne measurement of OH reactivity during INTEX-B, Atmos. Chem. Phys., 9, 163–173, 2009,
http://www.atmos-chem-phys.net/9/163/2009/.
Nakashima, Y., Matsuda, H., Ide, S., Miyazaki, K., Yamazaki, K., Okazaki, H., Osada, T., Tajima, Y., Suthawaree, J., Kato, S., Shimo, N., Matsunaga, S., Apel, E., Greenberg, J., Guenther, A., Ueno, H., Sasaki, H., Hoshi, J., Yoshino, A., Yokota, H., Ishii, K., and Kajii, Y.: Diagnosis of urban air quality by measurement of total OH reactivity II: Comprehensive observations in the ur-ban of Tokyo, J. Jpn. Soc. Atmos. Environ., 44, 33–41, 2009. Nansai, K., Suzuki, N., Tanabe, K., Kobayashi, S., and Moriguchi,
Y.: Design of Georeference-Based Emission Activity Modeling System (G-BEAMS) for Japanese emission inventory manage-ment, in: Proceedings of the 13th International Emission Inven-tory Conference in Clearwater, Florida, USA, 7–10 June, 2004. Odum, J. R., Hoffmann, T., Bowman, F., Collins, D., Flagan, R.
C., and Seinfeld, J. H.: Gas/particle partitioning and secondary organic aerosol yields, Environ. Sci. Technol., 30, 2580–2585, 1996
Ohara, T., Akimoto, H., Kurokawa, J., Horii, N., Yamaji, K., Yan, X., and Hayasaka, T.: An Asian emission inventory of an-thropogenic emission sources for the period 1980-2020, Atmos. Chem. Phys., 7, 4419–4444, 2007,
http://www.atmos-chem-phys.net/7/4419/2007/.
Ren, X. R., Harder, H., Martinez, M., Lesher, R. L., Oliger, A., Shirley, T., Adams, J., Simpas, J. B., and Brune, W. H.: HOx
con-centrations and OH reactivity observations in New York City dur-ing PMTACS-NY2001, Atmos. Environ., 37, 3627–3637, 2003. Sadanaga, Y., Yoshino, A., Kato, S., Yoshioka, A., Watanabe,
K., Miyakawa, Y., Hayashi, I., Ichikawa, M., Matsumoto, J., Nishiyama, A., Akiyama, N., Kanaya, Y., and Kajii, Y.: The importance of NO2and volatile organic compounds in the urban air from the viewpoint of the OH reactivity, Geophys. Res. Lett., 31, L08102, doi:10.1029/2004GL019661, 2004a.
Sadanaga, Y., Yoshino, A., Watanabe, K., Yoshioka, A., Waka-zono, Y., Kanaya, Y., and Kajii, Y.: Development of a mea-surement system of OH reactivity in the atmosphere by using a laser-induced pump and probe technique, Rev. Sci. Instrum., 75, 2648–2655, 2004b.
Sadanaga, Y., Kondo, S., Hashimoto, K., and Kajii, Y.: Measure-ment of the rate coefficient for the OH+NO2reaction under the atmospheric pressure: Its humidity dependence, Chem. Phys. Lett., 419, 474–478, 2005a.
Sadanaga, Y., Yoshino, A., Kato, S., and Kajii, Y.: Measurements of OH reactivity and photochemical ozone production in the urban atmosphere, Environ. Sci. Technol., 39, 8847–8852, 2005b.
Sander, S. P., Friedl, R. R., Golden, D. M., Kurylo, M. J., Huie, R. E., Orkin, V. L., Moortgat, G. K., Ravishankara, A. R., Kolb, C. E., Molina, M. J., and Finlayson-Pitts, B. J.: Chemical kinetics and photochemical data for use in atmospheric studies, Evalua-tion No. 14, JPL PublicaEvalua-tion 02–25, 2003.
Schell, B., Ackermann, I. J., Hass, H., Binkowski, F. S., and Ebel, A.: Modeling the formation of secondary organic aerosol within a comprehensive air quality model system, J. Geophys. Res., 106, 28275–28293, 2001.
Shirley, T. R., Brune, W. H., Ren, X., Mao, J., Lesher, R., Carde-nas, B., Volkamer, R., Molina, L. T., Molina, M. J., Lamb, B., Velasco, E., Jobson, T., and Alexander, M.: Atmospheric oxi-dation in the Mexico City Metropolitan Area (MCMA) during April 2003, Atmos. Chem. Phys., 6, 2753–2765, 2006,
http://www.atmos-chem-phys.net/6/2753/2006/.
Sinha, V., Williams, J., Crowley, J. N., and Lelieveld, J.: The Com-parative Reactivity Method - a new tool to measure total OH Re-activity in ambient air, Atmos. Chem. Phys., 8, 2213–2227, 2008, http://www.atmos-chem-phys.net/8/2213/2008/.
Skamarock, W. C., Klemp, J. B., Dudhia, J., Gill, D. O., Barker, D. M., Wang, W., and Powers, J. G.: A description of the advanced research WRF version 2, NCAR Technical Note, NCAR/TN– 468+STR, 2005.
Steiner, A. L., Cohen, R. C., Harley, R. A., Tonse, S., Millet, D. B., Schade, G. W., and Goldstein, A. H.: VOC reactivity in cen-tral California: comparing an air quality model to ground-based measurements, Atmos. Chem. Phys., 8, 351–368, 2008, http://www.atmos-chem-phys.net/8/351/2008/.
Stroud, C. A., Morneau, G., Makar, P. A., Moran, M. D., Gong, W., Pabla, B., Zhang, J., Bouchet, V. S., Fox, D., Venkatesh, S., Wang, D., and Dann, T.: OH-reactivity of volatile organic com-pounds at urban and rural sites across Canada: Evaluation of air quality model predictions using speciated VOC measurements, Atmos. Environ., 42, 7746–7756, 2008.
Volkamer, R., Jimenez, J. L., San Martini, F., Dzepina, K., Zhang, Q., Salcedo, D., Molina, L. T., Worsnop, D. R., and Molina, M. J.: Secondary organic aerosol formation from anthropogenic air pollution: Rapid and higher than expected, Geophys. Res. Lett., 33, L17811, doi:10.1029/2006GL026899, 2006.
Yoshikado, H.: Numerical study of the daytime urban effect and its interaction with the sea breeze, J. Appl. Meteorol., 31, 1146– 1164, 1992.