Pervasive Mitochondrial Sequence
Heteroplasmy in Natural Populations of Wild
Carrot,
Daucus carota
spp.
carota
L
Jennifer R. Mandel1,2*, David E. McCauley3
1Department of Biological Sciences, The University of Memphis, 3700 Walker Avenue, Memphis,
Tennessee, United States of America,2W. Harry Feinstone Center for Genomic Research, The University of Memphis, 3774 Walker Avenue, Memphis, Tennessee, United States of America,3Department of Biological Sciences, Vanderbilt University, VU Station B, Box 351634, Nashville, Tennessee, United States of America
*jmandel@memphis.edu
Abstract
Exceptions to the generally accepted rules that plant mitochondrial genomes are strictly maternally inherited and that within-individual sequence diversity in those genomes, i.e., heteroplasmy, should be minimal are becoming increasingly apparent especially with regard to sequence-level heteroplasmy. These findings raise questions about the potential significance of such heteroplasmy for plant mitochondrial genome evolution. Still studies quantifying the amount and consequences of sequence heteroplasmy in natural tions are rare. In this study, we report pervasive sequence heteroplasmy in natural popula-tions of wild carrot, a close relative of the cultivated crop. In order to assay directly for this heteroplasmy, we implemented a quantitative PCR assay that can detect and quantify intra-individual SNP variation in two mitochondrial genes (Cox1andAtp9). We found hetero-plasmy in>60% of all wild carrot populations surveyed and in>30% of the 140 component individuals that were genotyped. Heteroplasmy ranged from a very small proportion of the total genotype (e.g., 0.995:0.005) to near even mixtures (e.g., 0.590:0.410) in some individ-uals. These results have important implications for the role of intra-genomic recombination in the generation of plant mitochondrial genome genotypic novelty. The consequences of such recombination are evident in the results of this study through analysis of the degree of linkage disequilibrium (LD) between the SNP sites at the two genes studied.
Introduction
Mitochondrial heteroplasmy is the co-occurrence of two or more divergent mitochondrial genotypes within an individual, and for the purpose of this study, we consider heteroplasmy at the level of DNA sequence variation, often single nucleotide polymorphisms (SNPs), for one or more mitochondrial genes recognizing that the broader definition can include structural varia-tion and substoichiometric molecules thoroughly discussed in a nice review by Woloszynska [1]. Plant mitochondrial genomes are usually transmitted maternally; and as such, this strict
a11111
OPEN ACCESS
Citation:Mandel JR, McCauley DE (2015) Pervasive Mitochondrial Sequence Heteroplasmy in Natural Populations of Wild Carrot,Daucus carotaspp.
carotaL. PLoS ONE 10(8): e0136303. doi:10.1371/ journal.pone.0136303
Editor:Renfu Shao, University of the Sunshine Coast, AUSTRALIA
Received:April 26, 2015
Accepted:August 2, 2015
Published:August 21, 2015
Copyright:© 2015 Mandel, McCauley. This is an open access article distributed under the terms of the
Creative Commons Attribution License, which permits unrestricted use, distribution, and reproduction in any medium, provided the original author and source are credited.
Data Availability Statement:All relevant data are within the paper and its Supporting Information files.
Funding:This work was supported by United States Department of Agriculture-National Institute of Food and Agriculture (http://nifa.usda.gov/) grant 2014-33522-21826 to JRM and DEM. The funders had no role in study design, data collection and analysis, decision to publish, or preparation of the manuscript.
uni-parental inheritance should result in sequence homoplasmy, or within-individual genetic homogeneity, by preventing the mixing of differing mitochondrial genomes at fertilization. However, as McCauley [2] points out in a recentTansley Review, it is becoming increasingly apparent that bi-parental inheritance via occasional paternal transmission (leakage) of plant mitochondrial genomes can generate heteroplasmy and thus within-individual mitochondrial genome diversity. The occurrence of such heteroplasmy can enhance the possibility that inter-molecular recombination between divergent genetic partners will result in novel multi-locus genotypic combinations of potential significance for plant mitochondrial genome evolution. Moreover, Burt and Trivers [3] have suggested that in plant species exhibiting gynodioecy (a mating system consisting of a mixture of females and hermaphrodites) and cytoplasmic male sterility (CMS; [4]), selection could favor paternal leakage of mitochondrial genomes. Given that gynodioecy is the second most common mode of reproduction in angiosperms [5], the potential significance for the evolution of the mating system and the plant mitochondrial genome is quite intriguing.
Data from the gynodioecious speciesSilene vulgaris(Family: Caryophyllaceae), the bladder campion, have provided considerable information regarding mitochondrial heteroplasmy, paternal leakage, and recombination [2]. Studies from natural populations first demonstrated evidence for both mitochondrial heteroplasmy and inter-molecular recombination and pro-vided indirect support for paternal leakage of mitochondrial genomes [6–8]. Following these studies, direct evidence for the paternal inheritance of mitochondrial genomes inS.vulgaris
was demonstrated from formal crosses [9]. These studies ofS.vulgarisutilized quantitative real time PCR (qPCR) both to detect and to quantify mitochondrial gene SNPs used to define het-eroplasmy. While such heteroplasmy was found in>10% ofS.vulgarisindividuals assayed
from natural populations by Pearlet al. [8], it remains largely unknown how widely distributed mitochondrial genome heteroplasmy might be across diverse plant taxa, especially in gyno-dioecious species, and therefore the broad significance of mitochondrial heteroplasmy for plant mitochondrial genome dynamics is largely unknown.
Here we utilize qPCR genotyping of SNP markers found in two mitochondrial genes present in wild carrot to assay for heteroplasmy within 140 individuals sampled from thirteen open-pollinated natural populations located in the eastern United States. We find that heteroplasmy across these populations is quite pervasive. We discuss the implications of these findings including the potential role of intra-genomic recombination in generating mitochondrial geno-typic novelty and for the proposed relationship between the presence of CMS-based gyno-dioecy and paternal mitochondrial leakage.
Materials and Methods
Sampling and assay strategy
For this study, either leaf material or seeds (subsequently grown in a greenhouse to obtain leaf material) were collected from 140 wildD.carotassp.carotaL. (hereafter simplyD.carota) individuals found in one of thirteen sites located in the eastern United States (Table 1). All leaves and seeds were collected from publicly available land, and no specific permissions were required for these locations. Moreover, this study did not involve endangered or protected spe-cies. Genomic DNA was isolated from a 2 cm square portion of leaf tissue obtained from indi-vidual leaves using the DNeasy Plant Mini Kit and associated protocols (Qiagen, Valencia, CA, USA). Our previous work demonstrated substantial within and among population genetic alle-lic variation in several mitochondrial genes [13]. For the present study, we used known single nucleotide polymorphisms (SNPs) in the coding sequences of two of these genes (Cox1and
Atp9) as markers to investigate the potential for mitochondrial heteroplasmy, using a genotyp-ing strategy modeled on the methodologies of prior studies inS.vulgaris[6,8,9]. TheCox1
assay distinguishes a T/C polymorphism in the coding region of the gene, and theAtp9assay distinguishes a T/C polymorphism found at the first nucleotide position of theAtp9stop codon [12,14]. Mandelet al. [13], found a thirdAtp9SNP variant (an‘A’) at this site in natural populations that was not known previously from cultivated carrot lines. Note that our current
Atp9assay will therefore only detect T/C heteroplasmy in our samples and underestimate het-eroplasmy when the‘A’is involved.
Table 1. Collection sites of wild carrot,Daucus carotassp.carota, populations.
Population Name State County
Bartlett Massachusetts Nantucket
Moores Massachusetts Nantucket
New Street Massachusetts Nantucket
Polpis Massachusetts Nantucket
Ocean City New Jersey Cape May
Beaver New York Delaware
Bowl New York Delaware
Cemetery New York Delaware
Grand Gorge New York Delaware
Gravel/Railroad New York Schoharie
UT New York Delaware
Bean Pot Tennessee Cumberland
Bett’s Tennessee Davidson
Quantitative PCR assay
We designed two custom TaqMan SNP genotyping assays (Applied Biosystems, Foster City, CA, USA)–one for theCox1gene and one for theAtp9gene. For each assay, two allele-specific TaqMan probes containing distinct fluorescent dyes and a PCR forward and reverse primer pair were designed in order to detect the specific SNP targets. Each probe included a 5’reporter dye (VIC or 6-FAM), a 3’non-fluorescent quencher, and a minor groove binder moiety attached to the quencher molecule. These custom assays can be ordered from ABI by providing assay numbers AHBKC6A forCox1and AH5I5BL forAtp9(see Table A inS1 Filefor primer and probe sequences included in the assays). QPCR reactions were performed using 12.5μl of
TaqMan Genotyping Master Mix (Applied Biosystems), 0.6μl of QPCR assay (Atp9orCox1),
9.9μl dH2O, and 2μl of DNA ([10 ng/μl]). QPCR cycling was as follows: stage 1–50°C, 2:00
min; stage 2–95°C, 10:00 min; stage 3–40 reps, 95°C, 0:15 min followed by 60°C, 1:00 min. All reactions were conducted using an ABI 7300 real-time PCR system. Note that the‘reciprocal knockback’method [8], designed to make very low frequency minority SNP variants within heteroplasmic individuals more detectable, was not employed here owing to a lack of unique restriction sites within theCox1andAtp9probe sequences.
The QPCR experiment yields a Ct, or cycle threshold, value for each probe. The Ct value is inversely proportional to the number of target copies in the original sample. When two probes are used in an assay as above, the difference between the probe-specific Ct values is a function of the relative copy number of their respective targets. In a homoplasmic individual, one of the probes will not produce sufficient fluorescence to generate a Ct value (a result designated here as“U”or undetermined). In the assays reported here, apparently homoplasmic individuals dis-played Ct values of approximately 21 if homoplasmic for one of the twoCox1variants and 26 if homoplasmic for one of the twoAtp9variants (and U for the other variant). In an individual heteroplasmic for the two alleles/haplotypes that are detectable by a given pair of probes, the Ct value for the more common, or primary, allele/haplotype should be the smaller of the two.
For this study, each gene was assayed twice for every individual. For each gene, the only individuals included in the final data set were those, which displayed a Ct value other than“U”
(i.e. detectable Ct<40) for at least one of the two SNP variants for both replicate assays of that
gene. This resulted in a data set containing 140 individualCox1genotypes, of which 50 individ-uals were also genotyped forAtp9. It is assumed that in some individuals, unknown SNP vari-ants within the sequence targeted by theCox1orAtp9probes could render the genotype of that individual undetectable by the current QPCR assays if homoplasmic for that variant. Further, it is known that in natural populations ofD.carota>25% of individuals carry neither the‘T’
nor the‘C’Atp9SNP genotype, but rather harbor an‘A’nucleotide at the T/C SNP site targeted by theAtp9assay [13]. Such‘A’individuals could not be genotyped by the current T/CAtp9
assay.
Artificial heteroplasmy mixture experiment
the methods of Pearlet al. [8], we analyzed the resulting Ct data in a linear regression frame-work (Fig 1). For each assay, the difference between the probe-specific Ct values should be a function of the known relative concentrations of the two target SNPs. The log transformation of the known initial relative concentrations is expected to be linear relative to the difference in Ct values because PCR initially results in exponential growth in amplicon number [8]. This lin-ear function was established by linlin-ear regression using JMP 11.1.1 (SAS Institute Inc.) and data from the mixture experiment. The resulting equation was then rearranged algebraically and used to estimate the unknown relative copy number (i.e., the heteroplasmy score) within an individual from the difference in Ct values between the two probes found in an assay. In these calculations, a score of 60 was arbitrarily assigned to those Ct values of‘U’that would allow a numerical solution that would not indicate the presence of an undetected SNP variant.
Sequencing validation
To confirm the accuracy of the genotyping obtained from our QPCR assays, we performed PCR amplification and direct Sanger Sequencing in twelve samples (italicized inTable 2) sequenced separately for bothCox1andAtp9. PCR primers and reaction conditions were as in Mandelet al. [13]. DNA sequencing was performed by the Molecular Resource Core Facility at the University of Tennessee Health Science Center employing Applied Biosystems Big Dye v3.1 Reaction Mix at 1/10X strength combined with an appropriate nanogram quantity of PCR product and 10 pmol of the relevant primer in a total volume of 12μl; all PCR protocols and
template/primer ratios were those suggested by the manufacturer. The Applied Biosystems BDXterminator system was used to remove salts, primers and unincorporated nucleotides from the labeling reaction; samples were analyzed using an Applied Biosystems 3130XL Genetic Analyzer. Sequences were viewed and aligned using the Sequencher Software (v5, Gene Codes, Ann Arbor, MI), and sequences were aligned with the aid of publishedD.carota
sequences [12,14].
The magnitude of linkage disequilibrium
In order to assess the magnitude of linkage disequilibrium between the SNPs assayed in the
Cox1andAtp9genes, we calculated linkage disequilibrium (asD) following the methods of McCauley & Ellis [7] and McCauley [2]. We used the equation from [16],D=xij−piqj, where xijis the observed frequency of individuals with a particular two-locus genotype,piis the
fre-quency of the relevant allele at the first locus (Cox1SNP: T or C), andqjis the frequency of the
relevant allele at the second locus (Atp9SNP: T or C). We standardized this value by dividing
DbyDmax, the maximum value ofDpossible given the observed allele frequenciespi, (1−pi),
andqj, (1−qj) [16], to obtainD’. By doing this, standardized linkage disequilibriumD’then
ranges from−1 to 1 withD’= 0 indicating linkage equilibrium. The expected frequencies for
the two-locus genotypes were calculated from the products of allele frequencies at the two loci. Finally, a statistical association between the SNP atCox1and the SNP atAtp9(i.e., whether the variant at one gene was independent of the variant at the other gene) was tested using a Fisher’s Exact Test [17].
Results
For both assays, the Ct values obtained from replicates/individual were quite repeatable (Spear-man’s Rank Correlation of the paired Ct values rs= 0.924 for theCox1assay and rs= 0.893 for
theAtp9assay; p<0.001 in both cases with‘U’results assigned an arbitrary Ct numeric score
Fig 1. QPCR Mixture Experiments.A) The mean difference in probe-specific Ct values as a function of known relative concentrations ofCox1haplotypes. B) The mean difference in probe-specific Ct values as a function of known relative concentrations ofAtp9haplotypes. Standard error bars for Ct value differences are also presented, based on six replicates for each relative concentration, along with the line derived from linear regression of mean difference in Ct values on log known relative concentration. Linear regression equations derived from these results are shown on the figure and are used to estimate relative copy number from observed Ct values for each probe pair in field-sampled adults.
Table 2. Heteroplasmy scores and SNP genotypes for 140Cox1and 50Atp9individuals as given by relative proportion of the T SNP for both genes.
Population Cox1 Geno. Atp9 Geno. Population Cox1 Geno. Atp9 Geno.
Bartlett 1.000 T — — Gravel/Railroad 0.000 C 0.945 T/C
Bartlett 1.000 T — — Gravel/Railroad 0.000 C 1.000 T
Bean Pot 0.000 C 1.000 T Gravel/Railroad 0.035 C/T 1.000 T
Beaver 0.000 C 0.934 T/C Gravel/Railroad 0.031 C/T 0.996 T
Beaver* 0.007 C/T 0.980 T/C Gravel/Railroad 0.000 C — —
Beaver 0.012 C/T 0.996 T Gravel/Railroad 0.000 C — —
Beaver 1.000 T 0.998 T Gravel/Railroad 0.001 C — —
Beaver 0.012 C/T 0.998 T Gravel/Railroad 0.002 C — —
Beaver 0.008 C/T 0.998 T Gravel/Railroad 0.004 C — —
Beaver 0.000 C 0.999 T Gravel/Railroad 0.004 C — —
Beaver 0.000 C 1.000 T Gravel/Railroad 0.004 C — —
Beaver 0.000 C — — Gravel/Railroad 0.007 C/T — —
Beaver 0.000 C — — Gravel/Railroad 0.008 C/T — —
Beaver 0.001 C — — Gravel/Railroad 0.009 C/T — —
Beaver 0.001 C — — Gravel/Railroad 0.012 C/T — —
Beaver 0.003 C — — Gravel/Railroad 0.021 C/T — —
Beaver 0.006 C/T — — Gravel/Railroad 0.032 C/T — —
Bett’s 0.000 C — — Gravel/Railroad 0.041 C/T — —
Bett’s 0.007 C/T — — Gravel/Railroad 0.998 T — —
Bowl 1.000 T 0.000 C Gravel/Railroad 0.999 T — —
Bowl 0.000 C 0.000 C Gravel/Railroad 0.999 T — —
Bowl 1.000 T 0.000 C Gravel/Railroad 1.000 T — —
Bowl 1.000 T 0.845 T/C Gravel/Railroad 1.000 T — —
Bowl 1.000 T 0.847 T/C Gravel/Railroad 1.000 T — —
Bowl 0.996 T 0.858 T/C Moores 0.000 C — —
Bowl 1.000 T 0.921 T/C Moores 0.000 C — —
Bowl 1.000 T 0.926 T/C Moores 0.008 C/T — —
Bowl 1.000 T 0.937 T/C New Street 0.002 C — —
Bowl 1.000 T 0.952 T/C Ocean City 0.000 C — —
Bowl 1.000 T 0.955 T/C Ocean City 0.000 C — —
Bowl 0.000 C 1.000 T Ocean City 0.000 C — —
Bowl 0.004 C 1.000 T Ocean City 0.000 C — —
Bowl 0.028 C/T 0.997 T Ocean City 0.000 C — —
Bowl 0.005 C/T 0.998 T Ocean City 0.000 C — —
Bowl 0.016 C/T 0.999 T Ocean City 0.000 C — —
Bowl 0.000 C 0.999 T Ocean City 0.025 C/T — —
Bowl 0.004 C 0.999 T Ocean City 0.040 C/T — —
Bowl 0.000 C — — Ocean City 0.049 C/T — —
Bowl 0.000 C — — Polpis 0.001 C — —
Bowl 0.000 C — — UT 0.994 T/C 0.000 C
Bowl 0.000 C — — UT 1.000 T 0.000 C
Bowl 0.001 C — — UT 1.000 T 0.000 C
Bowl 0.002 C — — UT 1.000 T 0.000 C
Bowl 0.006 C/T — — UT 1.000 T 0.001 C
Bowl 0.007 C/T — — UT* 0.994 T/C 0.853 T/C
Bowl 0.008 C/T — — UT 0.998 T 0.877 T/C
in those genes for the individuals meeting the above criteria for inclusion in the data set. For each individual/gene, these two scores were averaged. In previous works, a minimum threshold frequency of 0.005 (0.5%) of the minority SNP variant was used to define an individual as het-eroplasmic [8,9]. Here we also use an average minority frequency of 0.005 or greater as neces-sary to define an individual as heteroplasmic for that SNP. Note that in all cases, the majority SNP that was obtained from the Q-PCR assay matched that of the Sanger sequencing results. In three individuals from theAtp9assay, the Q-PCR reaction failed i.e., showed no signal for T or C, and these individuals were indeed the third variant (the‘A’) when sequenced (data not shown).
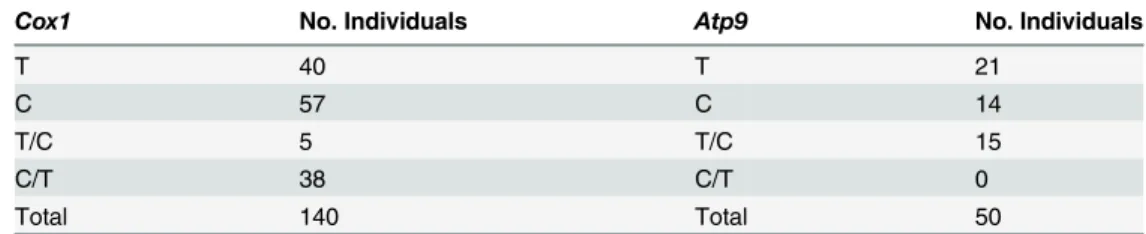
For theCox1SNP marker 43 of 140 individuals (30.7%) were heteroplasmic with each of the twoCox1SNP variants serving as the minority type in at least some heteroplasmic individ-uals (Tables2and3; Table D inS1 File). While the majority-minority distribution was quite uneven in most heteroplasmic individuals, the most even mix of variants was 0.590:0.410, as observed in one individual. Of the remaining 97 individuals, 57 (58.8%) were homoplasmic for the‘C’variant and 40 (41.2%) homoplasmic for the‘T’variant at the SNP site of interest. For theAtp9SNP marker, 15 of 50 individuals (30.0%) were heteroplasmic (Tables2and3; Table E inS1 File). Here only the‘C’Atp9variant was observed as the minority type in hetero-plasmic individuals—an asymmetry also observed in cultivated carrot where the‘T’variant was never observed as a minority haplotype [15]. Of the remaining 35 individuals, 14 (40.0%)
Table 2. (Continued)
Population Cox1 Geno. Atp9 Geno. Population Cox1 Geno. Atp9 Geno.
Bowl 0.013 C/T — — UT 1.000 T 0.984 T/C
Bowl 0.410 C/T — — UT 0.999 T 0.999 T
Bowl 1.000 T — — UT 0.983 T/C 0.999 T
Bowl 1.000 T — — UT 0.993 T/C 1.000 T
Bowl 1.000 T — — UT 0.000 C — —
Cemetery 0.000 C 0.997 T UT 0.000 C — —
Cemetery 0.000 C — — UT 0.000 C — —
Cemetery 0.003 C — — UT 0.000 C — —
Cemetery 0.006 C/T — — UT 0.000 C — —
Cemetery 0.012 C/T — — UT 0.001 C — —
Cemetery 0.015 C/T — — UT 0.001 C — —
Cemetery 0.320 C/T — — UT 0.002 C — —
Cemetery 0.664 T/C — — UT 0.003 C — —
Cemetery 1.000 T — — UT 0.003 C — —
Clift Rd 0.003 C — — UT 0.007 C/T — —
Grand Gorge 1.000 T — — UT 0.009 C/T — —
Grand Gorge 1.000 T — — UT 0.019 C/T — —
Gravel/Railroad 1.000 T 0.000 C UT 0.028 C/T — —
Gravel/Railroad 0.000 C 0.000 C UT 0.039 C/T — —
Gravel/Railroad 0.999 T 0.000 C UT 0.045 C/T — —
Gravel/Railroad 0.999 T 0.000 C UT 0.996 T — —
Gravel/Railroad 0.996 T 0.000 C UT 1.000 T — —
Gravel/Railroad 0.027 C/T 0.002 C UT 1.000 T — —
Gravel/Railroad 0.000 C 0.925 T/C UT 1.000 T — —
Heteroplasmic inds. bolded; doubly heteroplasmic inds. indicated by‘*’. Italics denote inds. verified by Sanger sequencing.
were homoplasmic for the‘C’variant and 21 (60.0%) were homoplasmic for the‘T’variant at the SNP site of interest. Again, the majority-minority distribution was quite uneven in most heteroplasmic individuals, with 0.845:0.155 being the most even mixture observed.
Heteroplasmy was observed in both theCox1and theAtp9markers in two individuals. Con-sidering both markers, heteroplasmy was observed in individuals found in eight of the 13 pop-ulations sampled. These included poppop-ulations located in all four U.S. states in which the sampled natural populations were located (Table 1). When the two-locus genotypes are consid-ered for the 50 individuals (Table 2) for which bothCox1andAtp9genotypes were obtained (with the majority variant considered the SNP genotype in the members of that group that were heteroplasmic) individuals carrying all four possibleCox1/Atp9combinations of nucleo-tides were observed. These included 15 T/T, 11 T/C, 21 C/T, 3 C/C individuals (Table 4). Applying the methods of McCauley & Ellis [7] and McCauley [2] for calculating linkage dis-equilibrium and the equations from [16] to the 50 two-locus SNP genotypes described above, we found that|D’= 0.511|. It should be noted that given the relatively small sample size used here to calculate LD, this value should be viewed as only an estimate of the degree of LD between these two genes. Still, the Fisher’s Exact Test indicated that the variants at the two loci were not randomly associated (df = 1, p<0.05).
Discussion
Here we discovered somewhat surprising levels of sequence heteroplasmy in natural popula-tions of wild carrot. We previously documented some of the genotypic consequences of recom-bination in the mitochondrial genome ofD.carotaand speculated on the occurrence of mitochondrial heteroplasmy [13]. The current results suggest that at least low-level hetero-plasmy of the mitochondrial genome, defined as such, is quite common among individuals found over much of the distribution of wild carrot in the eastern U.S., if not more widely. Few studies have characterized heteroplasmy in natural populations, but work in wild collected individuals ofS.vulgarisfound that heteroplasmy was moderately common with roughly 15%
Table 4. Observation of the four-gamete rule and observed and expected two-locus nucleotide combinations.
Cox1SNP Atp9SNP No. Ind. Obs. No. Ind. Exp.
T T 15 19
T C 11 7
C T 21 17
C C 3 7
No. Ind. Obs. = number of individuals observed and No. Ind. Exp. = number of individuals expected when D’= 0.
doi:10.1371/journal.pone.0136303.t004
Table 3. Summary genotype counts forCox1andAtp9as given by either homoplasmic T or C and het-eroplasmic T/C or C/T where the major SNP is listed first.
Cox1 No. Individuals Atp9 No. Individuals
T 40 T 21
C 57 C 14
T/C 5 T/C 15
C/T 38 C/T 0
Total 140 Total 50
of individuals considered as heteroplasmic [8]. It should also be noted that heteroplasmy is necessarily defined here, and as in the study by Pearl et al. [8], by the collection of mitochon-drial genomes found within a 2 cm square portion of leaf tissue, rather than at the level of the whole plant or individual cell.
Considering cases where paternal leakage leads to sequence heteroplasmy, previous studies
ofS.vulgarisdemonstrate that heteroplasmy can be transmitted across generations via mostly
maternal inheritance of mitochondria, or lost from maternal lines owing to random processes during cell division resulting in homoplasmy in that cell line (vegetative segregation) [8,9]. In order for paternal leakage to result in detectable heteroplasmy in open-pollinated natural pop-ulations, such as studied here, the pollen donor and recipient must differ with regard to marker genotype and so heteroplasmy should be difficult to detect in those local populations displaying low levels of marker polymorphism. In our previous work, we found a moderate number of wild carrot populations harboring mitochondrial DNA polymorphism [13], still many popula-tions studied previously, and here, have little to no variation within the genes used as markers. This factor, along with the detectability issue mentioned above, suggests our current study has likely underestimated heteroplasmy in natural populations of wild carrot.
McCauley [2] suggest that evidence of the consequences of recombination is also found in the magnitude of LD between the two variable sites in question. Again barring recombination, the standardized LD (D’) should have an absolute value of one, and|D’|would approach zero (link-age equilibrium) in populations with frequent recombination between the sites in question [16]. The finding here that|D’= 0.511|suggests substantial, but not rampant, recombination betweenCox1/Atp9mitochondrial genotypes inD.carotaand demonstrates the potential for sequence heteroplasmy to generate mitochondrial genotypic novelty in natural plant populations.
Supporting Information
S1 File. Supporting information.Additional supporting information may be found in the online version of this article and includes six tables described here. Assay Design Details (Table A). Mixture experiment data forCox1assay (Table B). Mixture experiment data for
Atp9assay (Table C). Raw data, analysis calculations, and quantitative heteroplasmy scores for 140 individuals assayed forCox1(Table D). Raw data, analysis calculations, and quantitative heteroplasmy scores for 50 individuals assayed forAtp9(Table E).
(XLSX)
Acknowledgments
The authors would like to thank Jeremy Mandel, Mark Mandel, Michelle McCauley, Dviti Mody, and Sara Samoray for lab work and assistance collecting samples. This work was sup-ported by USDA-NIFA 2014-33522-21826 to JRM and DEM.
Author Contributions
Conceived and designed the experiments: JRM DEM. Performed the experiments: JRM DEM. Analyzed the data: JRM DEM. Wrote the paper: JRM DEM.
References
1. Woloszynska M (2010) Heteroplasmy and stoichiometric complexity of plant mitochondrial genomes— though this be madness, yet there’s method in't. J Exp Bot 61: 657–671. doi:10.1093/jxb/erp361 PMID:19995826
2. McCauley DE (2013) Tansley review: Paternal leakage, heteroplasmy, and the evolution of plant mito-chondrial genomes. New Phytol 200: 966–977. doi:10.1111/nph.12431PMID:23952142
3. Burt A, Trivers R (2006) Genes in conflict. Cambridge, Massachusetts: Belknap Press of Harvard Uni-versity Press. 602 p.
4. Schnable PS, Wise RP (1998) The molecular basis of cytoplasmic male sterility and fertility restoration. Trends Plant Sci 3: 175–180.
5. Richards AJ (1986) Plant Breeding Systems. London: George Allen and Unwin. 529 p.
6. Welch ME, Darnell MZ, McCauley DE (2006) Variable populations within variable populations: quantify-ing mitochondrial heteroplasmy in natural populations of the gynodioecious plant Silene vulgaris. Genetics 174: 829–837. PMID:16888337
7. McCauley DE, Ellis JR (2008) Recombination and linkage disequilibrium among mitochondrial genes in structured populations of the gynodioecious plant Silene vulgaris. Evolution (N Y) 62: 823–832.
8. Pearl S a, Welch ME, McCauley DE (2009) Mitochondrial heteroplasmy and paternal leakage in natural populations of Silene vulgaris, a gynodioecious plant. Mol Biol Evol 26: 537–545. doi:10.1093/molbev/ msn273PMID:19033259
9. Bentley KE, Mandel JR, Mccauley DE (2010) Paternal Leakage and Heteroplasmy of Mitochondrial Genomes in Silene vulgaris: Evidence From Experimental Crosses. Genetics 185: 961–968. doi:10. 1534/genetics.110.115360PMID:20421605
11. Ronfort J, Saumitou-Laprade P, Cuguen J, Couvet D (1995) Mitochondrial DNA diversity and male ste-rility in natural populations of Daucus carota ssp carota. Theor Appl Genet 91: 150–159. doi:10.1007/ BF00220872PMID:24169681
12. Bach IC, Olesen A, Simon PW (2002) PCR-based markers to differentiate the mitochondrial genomes of petaloid and male fertile carrot (Daucus carota L.). Euphytica 127: 353–365.
13. Mandel JR, McAssey E V, Roland KM, McCauley DE (2012) Mitochondrial Gene Diversity Associated with the atp9 Stop Codon in Natural Populations of Wild Carrot (Daucus carota ssp. carota). J Hered 103: 418–425. doi:10.1093/jhered/esr142PMID:22337997
14. Szklarczyk M, Oczkowski M, Augustyniak H, Borner T, Linke B, Michalik B. (2000) Organisation and expression of mitochondrial atp9 genes from CMS and fertile carrots. Theor Appl Genet 100: 263–270.
15. Szklarczyk M, Szymański M, Wójcik-Jagła M, Simon PW, Weihe A, Borner T. (2014) Mitochondrial atp9 genes from petaloid male-sterile and male-fertile carrots differ in their status of heteroplasmy, recombination involvement, post-transcriptional processing as well as accumulation of RNA and protein product. Theor Appl Genet 127: 1689–1701. doi:10.1007/s00122-014-2331-xPMID:24913361
16. Hedrick PW (2009) Genetics of populations. 4th ed. Sudbury, MA: Jones and Bartlett Learning. 675 p.
17. Sokal RR, Rohlf JF (1995) Biometry. 3rd ed. W.H. Freeman, New York, NY.
18. Birky CW (1995) Uniparental inheritance of mitochondrial and chloroplast genes: mechanisms and evo-lution. Proc Natl Acad Sci U S A 92: 11331–11338. PMID:8524780
19. Birky CW (2001) The inheritance of genes in mitochondria and chloroplasts: laws, mechanisms, and models. Annu Rev Genet 35: 125–148. PMID:11700280
20. Mackenzie S, McIntosh L (1999) Higher plant mitochondria. Plant Cell 11: 571–586. PMID:10213779


![Table E in S1 File). Here only the ‘C’ Atp9 variant was observed as the minority type in hetero- hetero-plasmic individuals—an asymmetry also observed in cultivated carrot where the ‘T’ variant was never observed as a minority haplotype [15]](https://thumb-eu.123doks.com/thumbv2/123dok_br/17037404.233438/8.918.59.864.137.616/observed-minority-individuals-asymmetry-cultivated-observed-minority-haplotype.webp)