Natural Variants of At
HKT1
Enhance Na
þ
Accumulation in Two
Wild Populations of
Arabidopsis
Ana Rus, Ivan Baxter, Balasubramaniam Muthukumar, Jeff Gustin, Brett Lahner, Elena Yakubova, David E. Salt*
Center for Plant Environmental Stress Physiology, Purdue University, West Lafayette, Indiana, United States of America
Plants are sessile and therefore have developed mechanisms to adapt to their environment, including the soil mineral nutrient composition. Ionomics is a developing functional genomic strategy designed to rapidly identify the genes and gene networks involved in regulating how plants acquire and accumulate these mineral nutrients from the soil. Here, we report on the coupling of high-throughput elemental profiling of shoot tissue from variousArabidopsisaccessions with DNA microarray-based bulk segregant analysis and reverse genetics, for the rapid identification of genes from wild populations ofArabidopsisthat are involved in regulating how plants acquire and accumulate Naþ
from the soil. Elemental profiling of shoot tissue from 12 differentArabidopsisaccessions revealed that two coastal populations of
Arabidopsiscollected from Tossa del Mar, Spain, and Tsu, Japan (Ts-1 and Tsu-1, respectively), accumulate higher shoot levels of Naþ
than do Col-0 and other accessions. We identify AtHKT1,known to encode a Naþ
transporter, as being the causal locus driving elevated shoot Naþ
in both Ts-1 and Tsu-1. Furthermore, we establish that a deletion in a tandem repeat sequence approximately 5 kb upstream of AtHKT1is responsible for the reduced root expression of AtHKT1
observed in these accessions. Reciprocal grafting experiments establish that this loss of AtHKT1expression in roots is responsible for elevated shoot Naþ
. Interestingly, and in contrast to the hkt1–1 null mutant, under NaCl stress conditions, this novel AtHKT1allele not only does not confer NaCl sensitivity but also cosegregates with elevated NaCl tolerance. We also present all our elemental profiling data in a new open access ionomics database, the Purdue Ionomics Information Management System (PiiMS; http://www.purdue.edu/dp/ionomics). Using DNA microarray-based genotyping has allowed us to rapidly identify AtHKT1 as the casual locus driving the natural variation in shoot Naþ
accumulation we observed in Ts-1 and Tsu-1. Such an approach overcomes the limitations imposed by a lack of established genetic markers in most Arabidopsis accessions and opens up a vast and tractable source of natural variation for the identification of gene function not only in ionomics but also in many other biological processes.
Citation: Rus A, Baxter I, Muthukumar B, Gustin J, Lahner B, et al. (2006) Natural variants of AtHKT1enhance Naþaccumulation in two wild populations of
Arabidopsis. PLoS Genet 2(12): e210. doi:10.1371/journal.pgen.0020210
Introduction
Plants are sessile and therefore have developed mecha-nisms to adapt to their environment, including the soil mineral nutrient composition. High-throughput elemental profiling ofArabidopsis thaliana (Arabidopsis)has been used in an effort to identify the genes and gene networks involved in regulating how plants acquire and accumulate mineral nutrients and trace elements from the soil [1]. In 2003, Lahner et al. [1], in a screening of 6,000 fast-neutron– mutagenized Arabidopsis plants grown under unstressed conditions, identified 51 mutants with altered shoot elemen-tal profiles, and they estimated that about 2% to 4% of the Arabidopsis genome is involved in regulating the elemental composition or‘‘ionome’’of Arabidopsis(for review, see [2]), including accumulation of macronutrients, micronutrients, and nonessential elements such as Naþ
. Recently, one of these ionomic mutants was shown to harbor a deletion in AtHKT1 that is responsible for the elevated shoot Naþ
phenotype of this mutant [3].
As an alternative to induced mutations (fast-neutron, ethylmethane sulfonate, etc.), the large reservoir of natural variation that exists in Arabidopsis is also a potentially powerful resource for the investigation of ionomic gene function [4–6]. Such natural variation has the advantage over
induced mutations in that uncovering the adaptive signifi-cance of such variation provides tools for the integration of gene function in the context of whole plant physiology. However, this genetic resource is still underexploited, mainly because natural phenotypic variation is usually the result of genotypic variation at multiple loci. Even when dealing with monogenic traits, it is a major challenge to identify a particular gene controlling a phenotype of interest. Cur-rently, fewer than ten genes have been identified in Arabidopsisusing the natural variation approach [7,8], whereas variation in multiple traits such as floral and meristem
Editor:Joseph R. Ecker, The Salk Institute for Biological Studies, United States of America
ReceivedAugust 31, 2006;AcceptedOctober 26, 2006;PublishedDecember 1, 2006
A previous version of this article appeared as an Early Online Release on October 26, 2006 (doi:10.1371/journal.pgen.0020210.eor).
Copyright:Ó2006 Rus et al. This is an open-access article distributed under the
terms of the Creative Commons Attribution License, which permits unrestricted use, distribution, and reproduction in any medium, provided the original author and source are credited.
Abbreviations:BSA, bulk segregant analysis; SFP, single feature polymorphism; SNP, single nucleotide polymorphism; Ts-1,Arabidopsisaccessions collected from Tossa del Mar, Spain; Tsu-1,Arabidopsisaccessions collected from Tsu, Japan
development, resistance, and defense against pathogens as well as metabolic enzymes ([9] and references therein) have been documented. Genetic differences between local pop-ulations are presumably associated with adaptation to the prevailing environmental conditions, although well-estab-lished examples of this in Arabidopsis are limited. Such investigations are impeded by the fact that very little information exists about the environmental conditions and habitat of theArabidopsisaccessions that have been collected and are curated at theArabidopsisBiological Resource Center. The term ‘‘accession’’ is used to refer to natural genetic variants of Arabidopsis to avoid the term ‘‘ecotype,’’ which would allude to a variant genetically adapted to a particular habitat [10,11].
Here, we have coupled high-throughput elemental profil-ing of shoot tissue [1] from variousArabidopsisaccessions with DNA microarray-based bulk segregant analysis (BSA) [12,13] and reverse genetics, for the rapid identification of genes involved in regulating how plants acquire and accumulate Naþ
from the soil. Such an approach using DNA microarray-based genotyping overcomes the time constraints imposed on using natural variation by the rapid identification of genetic markers, and opens up a vast and tractable source of natural variation for the identification of gene function not only in ionomics but also in many other biological processes. In a system with multiple quantitative trait loci, an alternative method, eXtreme Array Mapping, was developed to identify major quantitative trait loci using pools of lines with extreme phenotypes [14].
Using this approach, we have identified a novel AtHKT1 allele from two differentArabidopsisaccessions collected from Tossa del Mar (Ts-1) and Tsu (Tsu-1), sites located on the coastal regions of Spain and Japan, respectively. This novel AtHKT1allele, in both Ts-1 and Tsu-1, is responsible for the higher shoot Naþ
accumulation observed in these accessions compared with the reference accession Col-0, when grown under background NaCl levels. Previously, expression of AtHKT1has been shown to be localized in the vascular tissues throughout the plant, with expression being highest in the roots [15–17]. Thehkt1null mutation results in an alteration
of the Naþ
distribution in the plant, with higher levels of Naþ
accumulation in shoots and lower accumulation in roots compared to wild-type plants. Loss of AtHKT1expression in the nullhkt1mutant also confers sensitivity to high levels of NaCl [17–20]. All these studies are consistent with the current model that HKT1 functions to tightly regulate Naþ
accumu-lation in shoots by unloading Naþ
from the xylem in both roots and shoots and recycling Naþ
to the roots via the phloem.
Results reported here confirm that this new naturally evolved AtHKT1allele is responsible for the elevated shoot Naþ
accumulation we observe in Ts-1 and Tsu-1, via the specific downregulation of AtHKT1 expression in roots. Reciprocal grafting also confirms that the primary site for HKT1 function in regulating shoot Naþ
is in the root, with HKT1 playing little role in the shoot. Further, we suggest a deletion in the promoter region as the factor responsible for driving the differential expression of AtHKT1 in both Ts-1 and Tsu-1. Interestingly, and contrarily to the loss-of-function mutants hkt1, this novel allele appears to also be associated with enhanced NaCl tolerance.
Results
Ts-1 and Tsu-1 Accumulate Higher Levels of Naþ
in the Shoot than Col-0
Elemental profiling of shoot tissue collected from 12 differentArabidopsisaccessions, including Col-0, Cvi-0, Est-1, Kas-2, Mrk-0, Mt-0, Se-0, Ts-1, Van-0, Nd-1, Tsu-1, and Ler-2, revealed that Ts-1 and Tsu-1 (Figure 1A) accumulate higher levels of Naþ
than Col-0 and all other accessions tested when propagated in soil with low levels of NaCl under controlled growth conditions (Figure 1B). Interestingly, the Ts-1 and Tsu-1 accessions were collected from the coastal regions of Spain (Tossa del Mar) and Japan (Tsu), respectively. Besides being annotated as having different geographical origins, Ts-1 and Tsu-Ts-1 have different physical appearances (Figure Ts-1A). Moreover, based on a genome-scale DNA polymorphism analysis involving 96Arabidopsis accessions, these two acces-sions appeared to be genetically distinct [21]. The Ts-1 and Tsu-1 accessions can also be distinguished based on the fact that Ts-1 accumulates elevated concentrations of cobalt (þ55%) in shoot tissue compared to Col-0, while Tsu-1 has lower levels of Co. A complete set of the elemental profiling data summarized here can be obtained at the open access Purdue Ionomics Information Management System (PiiMS) at http://www.purdue.edu/dp/ionomics.
Genetic Analysis and Mapping of the High Naþ
Trait To determine the feasibility of using natural variation to identify individual loci regulating ionomic variation, we attempted to map the locus responsible for elevated Naþ
in Ts-1 and Tsu-1. Both accessions were crossed to Col-0, and the shoot concentrations of Naþ
were measured in the F1 hybrid plants (Figure 1C). The concentration of Naþ
was not significantly different from Col-0, suggesting that the loci controlling Naþ
accumulation in Ts-1 and Tsu-1 are recessive in both cases. Analysis of the segregating F2 plants from either cross revealed a pattern consistent with 3:1 segregation ratio of Col-03Ts-1 (Figure 2A) and Col-03Tsu-1 (Figure 2B) for shoot Naþ
concentrations. Therefore, we conclude that the high Naþ
phenotype observed in both Ts-1 and Tsu-1
Synopsis
Unlike most animals, plants are sessile and cannot leave a poor-quality environment after germinating. They therefore need to tolerate the particular conditions they encounter to survive. This makes plants an ideal system for the study of adaptive variation, and this is particularly true ofArabidopsis thaliana (Arabidopsis),which shows substantial natural variation and for which numerous genetic tools exist. Using a combination of analytical chemistry, genetics, and genomics, the authors were able to identify the specific genetic alteration that drive the natural variation in shoot sodium (Naþ
) accumulation capacity observed in Arabidopsis populations from coastal regions of Spain and Japan (Tossa del Mar and Tsu, respectively). They observed that a deletion in the DNA responsible for regulating the expression ofHKT1, a gene known to encode for a Naþ
transporter, causes reduced expression of AtHKT1in roots of both the Spanish and Japanese populations. Such altered expression results in the elevated shoot Naþ
segregates as a monogenic recessive trait. We further used the complementation test to demonstrate that the loci driving elevated shoot Naþ
in Ts-1 and Tsu-1 are allelic to each other, showing that the F1 plants from Tsu-13Ts-1 have shoot Naþ
levels that are similar to each parent (Figure 1D). Based on this evidence, DNA microarray-based BSA [12,13] was used to map the locus responsible for elevated Naþ
in both Ts-1 and Tsu-1. From the Ts-13Col-0 F2 population represented in Figure 2A, two pools of DNA were prepared, one containing genomic DNA from 30 plants with Naþ
levels similar to Col-0, constituting the‘‘control’’pool, and another with DNA from 30 plants with the highest Naþ
levels, similar to those of the Ts-1 parent, constituting the‘‘high Naþ
’’pool. Single feature polymorphisms (SFPs) were identified for Col-0 and Ts-1 by comparing the hybridization of genomic DNA isolated from the parental Col-0 and Ts-1 accessions to the Affymetrix ArabidopsisATH1 microarrays. The frequency of these SFPs in the DNA from the pool of F2 progeny plants with high Naþ
levels, and in the pool with control Naþ
levels, was scored by hybridization of genomic DNA to ATH1 microarrays. The DNA microarray-based BSA revealed a strong peak and therefore enrichment in Ts-1 SFPs linked to the locus causing elevated shoot Naþ
in Ts-1 at 6.6 Mbp on Chromosome IV (Figure 2C). Similarly, a strong peak at 6.4 Mbp in Chromosome IV was obtained when the hybridization was performed using DNA pools from the Tsu-1 3 Col-0 F2 population (Figure 2C). Approximately 513 genes (corre-sponding to 23 BAC clones) are contained within the confidence interval of 5.525 to 7.475 Mbp on Chromosome IV. The confidence interval was derived using previously published simulations [12]. One of the genes in BAC clone F24G24 (at 6.39 Mb), At4g10310, named AtHKT1,stands out as a very strong candidate because it has been previously identified as a Naþ
transporter [15], which when disrupted causes elevated shoot Naþ
[3,17,18]. The shoot Naþ
concen-trations in the hkt1–1 null mutant are significantly higher than Col-0 in leaves at all stages of development, with Naþ
accumulation generally increasing with leaf age (Figure S1A). When grown under the same conditions, the Ts-1 and Tsu-1 accessions also show increased Naþ
accumulation compared to Col-0 in leaves at all stages of development. However, Naþ
accumulation in Ts-1 and Tsu-1 is lower than that observed forhkt1–1(Figure S1A).
The Ts-1 and Tsu-1 Alleles of AtHKT1Have Similar Polymorphisms Compared to the Col-0 Allele
To establish if a different allele of AtHKT1is present in Ts-1 and Tsu-Ts-1, the nucleotide sequence was determined for the AtHKT1 locus in both accessions. The sequenced region comprises 5,456 bp upstream (363 bp downstream of the previous gene At4g10300) of AtHKT1 translational start codon that includes the promoter to 386 bp downstream of the AtHKT1 stop codon. Several polymorphisms were identified both in the coding region and in the upstream and downstream regions of the AtHKT1gene. In the coding region, no nonsense mutation was recognized and 19 single
Figure 1.Genetic Analysis of the High Naþ
Trait in Shoots ofArabidopsis thalianaAccessions Ts-1 and Tsu-1
(A) Seven-week-old plants of Col-0, Ts-1, and Tsu-1 accessions grown under short-day conditions.
(B) Naþ
levels in the shoot are higher in Ts-1 and Tsu-1. Naþ
content in shoots of Cvi-0 (n¼12), Se-0 (n¼12), Van-0 (n¼12), Mt-0 (n¼12), Nd-1 (n¼12), Mrk-0 (n¼12), Col-0 (n¼12), Kas-2 (n¼12), Est-1 (n¼12), Ler-2 (n¼12), Ts-1 (n¼12), and Tsu-1 (n¼8). Presented data are the mean6 SD.
(C) The higher Naþ
accumulation in the shoot of Ts-1 and Tsu-1 is a recessive trait. Naþ
content in shoots of Col-0 (n¼40), Ts-1 (n¼20), Tsu-1 (n¼20), and F1 plants derived from the crosses Ts-13Col-0 (n¼19) and Tsu-13Col-0 (n¼13). Presented data are the mean6SE.
(D) Ts-1 and Tsu-1 are allelic for the loci responsible for the higher Naþ
levels in the shoot. Naþ
content in shoots of Col-0 (n¼140), Ts-1 (n¼40), Tsu-1 (n¼40), and F1 hybrid plants derived from the cross Tsu-13Ts-1 (n¼10).
nucleotide polymorphisms (SNPs) were identified in both Ts-1 and Tsu-Ts-1 (Figure S2A), seven of which result in the amino acid changes R3I, K10N, V66L, C134Y, E385G, V453L, and F477L. None of the amino acid changes are located in the three relatively highly conserved regions identified by Uozumi et al. [15], and none of them affect the first serine residue at position 68 of P-loop A that has been implicated in the Naþ
specificity of the transporter [22]. One of the amino
acid changes, valine to leucine in position 453 (V453L), was also found in the LerAtHKT1allele published by Uozumi et al. [15].
In the upstream region, which includes the promoter of AtHKT1, four major polymorphisms were identified between Ts-1, Tsu-1, and Col-0 (Figure S2B). The most upstream polymorphism affects two repeated units of 681 and 673 bp, linked by a 34-bp sequence (Figure S2B). These two repeated
Figure 2.The Higher Naþ
Accumulation in Shoots of Ts-1 and Tsu-1 Is a Monogenic Recessive Trait Caused by a Gene Located on Chromosome IV (A) Distribution of Naþ
accumulation in shoot tissue of F2 segregating population obtained from crossing Col-0 with Ts-1. Presented data are distribution of Col-0 (n¼99), Ts-1 (n¼20), and F2 (Ts-13Col-0) (n¼158) plants.
(B) Distribution of Naþ
accumulation in shoot tissue of F2 segregating population obtained from crossing Col-0 with Tsu-1. Presented data are distribution of Col-0 (n¼80), Tsu-1 (n¼16), and F2 (Tsu-13Col-0) (n¼143). Naþ
contents were calculated for each plant as a percentage relative to Col-0 average Naþ
content. The‘‘Control pool’’and‘‘High Naþ
pool’’labels indicate the F2 plants used to prepare the corresponding DNA pools for the DNA microarray-based BSA.
units are localized 5,320 to 3,933 bp upstream of the AtHKT1 start codon and are 97% identical to each other in Col-0. In Ts-1 and Tsu-1, we identified a 725- and 687-bp deletion, respectively, which removes the end of the first of these repeated units, the beginning of the second unit, and the 34-bp junction sequence. Consequently, only one of the repeated units is present in Ts-1 and Tsu-1. The second major polymorphism identified in this region, about 3,100 bp upstream of the start codon, is an insertion of 13 bp in the sequence of Ts-1 as well as Tsu-1, resulting in the duplication of a 10-bp sequence (AATGTGTTAT) in Ts-1 and Tsu-1 that is present only once in Col-0. Similarly, 1,210 bp upstream of the start codon, a 14-bp insertion results in a duplicated 10-bp sequence (TCATTGCAAA) in Ts-1 and Tsu-1. The last major polymorphism in the promoter region is localized 148 to 98 bp upstream of the translational start codon. Compared to Col-0, these sequence polymorphisms found in both Ts-1 and Tsu-1 abolish the first of the two putative CAAT boxes suggested by Uozumi et al. [15].
Polymorphisms have also been found in the two introns of AtHKT1, mainly SNPs. We have been unable to sequence the last 157 bp of the second intron of the Ts-1 and Tsu-1 alleles, which according to the published Col-0 sequence is enriched in [TA] repeats. Finally, major differences in the sequence between Col-0 and Ts-1 and Tsu-1 occur in the sequence downstream of the stop codon, including the 39-untranslated region. Several SNPs, as well as deletions in Ts-1 and Tsu-1, result in a sequence of 246 and 140 bp shorter than the 386-bp sequence found in Col-0.
Complementation Studies Indicate AtHKT1Is Responsible for the High Naþ
Content in Shoots of Ts-1 and Tsu-1 Because the Ts-1 and Tsu-1 HKT1 alleles are recessive (Figure 1C) and thehkt1–1null mutant, like Ts-1 and Tsu-1, shows elevated shoot Naþ
accumulation (Figure S1), we used the deficiency complementation test to establish that AtHKT1
is the gene responsible for elevated Naþ
in Ts-1 and Tsu-1 [23]. Both accessions, Ts-1 and Tsu-1, were crossed to the hkt1–1 T-DNA insertional mutant in the Col-0 gl1 genetic background [19]. The hkt1 null mutant accumulates higher levels of Naþ
in the shoot and lower levels in the root than the wild-type, implicating HKT1 in the regulation of Naþ
distribution throughout the plant [17–19]. F1 plants from the cross ofhkt1–1to Col-0 present Naþ
levels similar to the those of the wild-type, as expected from a recessive mutation (Figure 3). However, F1 hybrid plants from the crosses of hkt1–1(Col-0gl1) with Ts-1 or Tsu-1 accumulate levels of Naþ
that are intermediate between each parent and significantly higher than Col-0 (Figure 3), indicating that the Ts-1 and Tsu-1HKT1allele is deficient in complementing the hkt1–1null mutation. This helps establish that elevated Naþ
in Ts-1 and Tsu-1 is due to alterations in the AtHKT1gene. However, the lower levels of Naþ
in the F1 plants compared with hkt1–1 suggest that the Ts-1 and Tsu-1 alleles of AtHKT1 are not nulls but rather weak alleles, although a role of the genetic background cannot be excluded (Figure 3).
The Weaker Ts-1 and Tsu-1 AtHKT1Allele Is the Result of Its Reduced Expression in the Root
Several polymorphisms in the promoter region suggested that HKT1 in Ts-1 and Tsu-1 might have a different expression level or expression pattern compared to Col-0, which could be responsible for the high Naþ
phenotype in Ts-1 and Tsu-Ts-1. Plants displaying elevated shoot Naþ
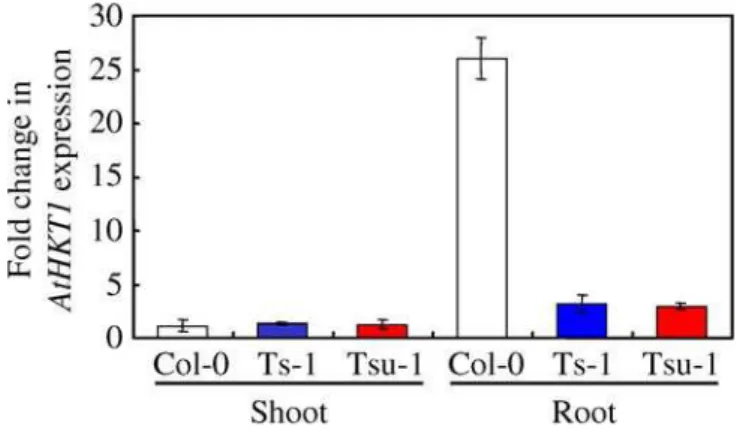
accumu-lation, compared to Col-0, were used to determine expression levels of AtHKT1in shoot and root tissue, using quantitative real-time PCR. As previously described [15–17], expression of AtHKT1in Col-0 is significantly higher in roots compared to shoots (Figure 4). In the shoot, no significant differences in expression levels were found between Col-0 and Ts-1 or Tsu-1. In the root, however, the level of AtHKT1expression in Ts-1 and Tsu-Ts-1 is approximately Ts-10-fold lower than in Col-0 (Figure 4).
Figure 4.Root Differential AtHKT1Expression between Col-0, Ts-1, and
Tsu-1
AtHKT1level of expression was compared in shoots and roots of Col-0, Ts-1, and Tsu-1 plants. RNA was isolated from shoot and root of 60-d-old plants grown in soil under short-day conditions. For normalization across samples, the expression of the Actin 1 gene was used, and relative fold induction was calculated in comparison to AtHKT1
expression in Col-0 shoot using theDDCtmethod. Presented data are
the means of at least three biological replicates, and the error bars represent6SD.
doi:10.1371/journal.pgen.0020210.g004
Figure 3.Complementation Studies Indicate AtHKT1Natural Variant Is
Responsible for the Higher Naþ
Content in Shoots of Ts-1 and Tsu-1 Naþ
contents were analyzed in shoots of Col-0 (n¼140),hkt1–1(n¼78), Ts-1 (n¼40), Tsu-1 (n¼40), and F1 hybrid plants derived from the crosses ofhkt1–13Col-0 (n¼12),hkt1–13Ts-1 (n¼50), andhkt1–13 Tsu-1 (n¼10). Plants were grown for 42 d under short-day conditions. Presented data are the mean6SE.
An Arabidopsismutant (Line 1425), in the Col-0gl1 sos3–1 background, previously identified as a weak suppressor of sos3–1 Naþ
sensitivity (A. Rus and P. M. Hasegawa, unpub-lished data), was found to contain a T-DNA insertion within the tandem repeat region localized 5,320 to 3,933 bp upstream of the AtHKT1start codon (Figure 5A), where Ts-1 and Tsu-Ts-1 also have a 725- and 687-bp deletion, respectively (Figure S2B). We observed that in Line 1425, expression of AtHKT1 in both roots and shoots is drastically reduced to levels comparable to hkt1–1 (Figure 5B). Furthermore, disruption of this tandem repeat, and elimination of AtHKT1 expression in Line 1425, leads to elevated shoot Naþ
compared to both Col-0 and sos3–1 (Figure 5C), and this phenocopies the elevated shoot Naþ
levels observed in both hkt1–1and thesos3–1 hkt1–1double mutant (Figure 5C). Such evidence strongly implicates the approximately 700-bp deletion in the tandem repeat upstream of AtHKT1 in both
Ts-1 and Tsu-1 as being involved in the reduced root expression of AtHKT1in these accessions.
Grafting Establishes that HKT1 Function in Roots Is Critical for Regulation of Shoot Naþ
The elevated shoot Naþ
of Ts-1 and Tsu-1 that maps to the AtHKT1 locus is associated with the loss of AtHKT1 expression in roots. To address the contribution of HKT1 expression in the root to the control of Naþ
accumulation in the shoot, we performed reciprocal grafting experiments (Figure 6). Shoots fromhkt1–1grafted onto Col-0 roots show no significant difference in shoot Naþ
compared to Col-0 self-grafted controls, while Col-0 shoots self-grafted ontohkt1–1roots accumulated Naþ
levels similar to those observed in self-graftedhkt1–1plants (Figure 6). This is further evidence that AtHKT1expression in the root is the primary site for HKT19s role in regulating shoot Naþ
.
Figure 5.The Tandem Repeat Upstream of AtHKT1Is Determinant for AtHKT1Expression and Maintenance of Shoot Naþ
Accumulation
(A) Diagram of the T-DNA insertions in Line 1425. Represented are the two tandem repeats (hatched boxes), positions of the two T-DNA insertions (inverted triangles), and the arrows indicating the orientation of the left border (LB) for each T-DNA insertion. Numbering is based on the A of the At4g10310 start codon ATG asþ1. The diagram is not drawn to scale.
(B) AtHKT1expression using quantitative real-time PCR in Col-0,sos3–1(Col-0gl1), Line 1425, andhkt1–1. RNA was isolated from shoot and root of 6-wk-old plants grown in soil under short-day conditions. For normalization across samples, the expression of theActin 1gene was used, and relative fold induction was calculated in comparison to AtHKT1expression in Col-0 shoot using theDDCtmethod. Presented data are the mean of at least three
biological replicates, and the error bars represent6SD. (C) Naþ
accumulation in shoot tissue of Col-0,sos3–1(Col-0gl1), Line 1425,sos3–1 hkt1–1,andhkt1–1grown for 6 wk in soil under short-day conditions (same plants used for quantitative real-time PCR above). Presented data are the mean6SE (n¼12).
HKT1Allele in Ts-1 and Tsu-1 Is Associated with Enhanced NaCl Tolerance
AtHKT1 has been implicated in Arabidopsis tolerance to NaCl stress. Thehkt1null mutant is sensitive to elevated NaCl as a result of Naþ
overaccumulation in the shoot [Figure 7A; 17–19]. Under unstressed conditions, we have established that the weaker AtHKT1 allele in Ts-1 and Tsu-1 is responsible for the elevated Naþ
content in the shoot of these two accessions, similar to that observed in thehkt1–1 null mutant. Under high NaCl concentrations (50 and 100 mM NaCl), both Ts-1 and Tsu-1 have higher levels of Naþ
in the shoot compared to Col-0, in all leaves at different stages of development, including the youngest ones not fully developed and localized close to the meristem (stage 1; Figure S1B and S1C). However, this elevated shoot Na does not cause increased NaCl sensitivity in Tsu-1 (Figure 7A). Given the connection between AtHKT1expression and NaCl sensitivity, we decided to evaluate the involvement of this novel allele of AtHKT1 in NaCl tolerance by screening F2 plants from a cross between Tsu-13Col-0 for their capacity to survive high levels of NaCl (Figure 7). The genotyping of the F2 population from Tsu-13Col-0 identified 25 plants homozygous for Tsu-1-HKT1and 50 plants heterozygous and 20 plants homozygous for the Col-0-HKT1 allele, following the expected 1:2:1 segregation ratio. The plants homozygous or heterozygous for the Tsu-1-HKT1 allele were able to survive longer in the presence of 100 mM NaCl compared to plants that were homozygous for the Col-0-HKT1 allele (Figure 7). Therefore, although this new AtHKT1 allele contributes to an increased Naþ
accumulation in the shoot, it does not confer NaCl sensitivity but, on the contrary, appears to co-segregate with enhanced NaCl tolerance. Although currently we cannot eliminate the possibility that a second unknown gene is conferring the enhanced NaCl tolerance observed in Tsu-1, and due to a small genetic distance between AtHKT1 and this second gene they segregate together in the F2 population studied. Further transgenic studies are required to discern this.
Discussion
We have used natural variation inArabidopsisto successfully identify a new AtHKT1 allele responsible for elevated Naþ
accumulation in the shoots, compared to Col-0. We propose the reduced expression of AtHKT1 in roots as the cause of this enhanced Naþ
accumulation and provide evidence which points to a deletion in a tandem repeat upstream of AtHKT1 as responsible for this differential regulation of AtHKT1 expression. Identification of AtHKT1as a candidate gene was possible based on the mapping position obtained from our DNA microarray-based BSA analysis, combined with the known phenotype of hkt1. However, the difficulty arises in providing significant proof that AtHKT1 is the causal gene driving elevated shoot Naþ
. To achieve this, we have combined several lines of evidence as suggested by Weigel and Nordborg [23]. First, DNA polymorphisms allow us to distinguish between the AtHKT1 allele in Col-0 and the AtHKT1 allele found in both Ts-1 and Tsu-1. Second, the deficiency complementation test indicates that the new AtHKT1 allele found in Ts-1 and Tsu-1 is responsible for the Naþ
accumulation in the shoot. Third, AtHKT1shows a different expression pattern in Ts-1 and Tsu-1 compared to Col-0. Fourth, the characterization of this new AtHKT1allele was performed in two independent genetic backgrounds, Ts-1 and Tsu-1, with the same results.
High-throughput elemental profiling of Arabidopsis muta-genized lines has proved to be very successful in identifying mutants with altered ionomes, some of which are caused by variation at a single locus [1,3]. As presented here, we have also found, using high-throughput elemental profiling coupled with genetics and DNA microarray-based mapping techniques, that the higher Naþ
levels found in the shoots of Ts-1 and Tsu-1, two differentArabidopsisaccessions, are due to natural variation at the AtHKT1locus. AtHKT1 has been shown to transport Naþ
and, based on studies involving the hkt1 null mutants, has been implicated in Naþ
distribution throughout the plant [15,17,18].
The concentrations of Naþ
found in the shoots of Ts-1 and Tsu-1 are intermediate between thehkt1–1null mutant and Col-0 (Figures 3 and S1). This, coupled with the moderate complementation of the high Naþ
phenotype of hkt1–1 observed in the F1 plants from an hkt1–13Ts-1 or Tsu-1 cross, suggests that the AtHKT1 allele in these accessions is likely not a null, but rather a weak, allele (Figure 3), although a genetic background effect cannot be excluded. Several amino acid changes occur in HKT1 from Ts-1 and Tsu-1; however, no nonsense mutation or frameshifts were found in the coding region (Figure S2A). Interestingly, deletions upstream of AtHKT1 are present in both Ts-1 and Tsu-1, and analysis of AtHKT1 expression revealed it to be dramatically reduced in roots of both Ts-1 and Tsu-1 but unaltered in shoots, compared to Col-0 (Figure 4). Such changes in expression levels are likely to be responsible for the accumulation of Naþ
in the shoots of Ts-1 and Tsu-1. Previously, a suppressor of the NaCl sensitivity of sos3–1 (Col-0 gl1) called Line 1425 (A. Rus and P. M. Hasegawa, unpublished data) was identified as having a T-DNA insertion within the tandem repeat region upstream of AtHKT1(Figure 5A), the same region that contains an approximately 700-bp deletion in both Ts-1 and Tsu-1 (Figure S2B). The reduction in AtHKT1expression in Line 1425, which is associated with
Figure 6. Root AtHKT1 Expression Is Determinant for Shoot Naþ
Accumulation Naþ
contents were analyzed in shoots of self-grafted Col-0 plants (n¼3),
hkt1–1shoot grafted onto Col-0 roots (n¼14), Col-0 shoot grafted onto
hkt1–1root (n¼9), and self-graftedhkt1–1plants (n¼3). Presented data are the mean6SE.
elevated shoot Naþ
(Figure 5C), supports our hypothesis that the deletion in the tandem repeat region between 5,320 to 3,933 bp upstream of AtHKT1 is responsible for both the reduced expression of AtHKT1 in roots and elevated shoot Naþ
observed in both Ts-1 and Tsu-1. Based on our sequence analysis and previous promoter-GUS reporter gene analysis [20], this tandem repeat region is well upstream of the promoter of AtHKT1. However, further analysis of that region in theArabidopsismpss database ([24]; http://mpss.dbi. udel.edu/at) revealed the presence of a dense cluster of small RNAs from the unannotated tandem repeat upstream of AtHKT1. We hypothesize that because this tandem repeat region appears to be involved in positively regulating expression of AtHKT1, siRNAs or miRNAs produced from this region may be involved in interfering with a system that negatively regulates AtHKT1expression. However, confirma-tion of this model requires further experimentaconfirma-tion.
The availability of the natural variant of AtHKT1 in Ts-1 and Tsu-1, in which AtHKT1expression is altered specifically in roots, supports a model for HKT1 function in which the transporter plays a role in controlling Naþ
accumulation in shoots by regulating, at the root level, the transport of Naþ
in the xylem transpiration stream to the shoot. We propose that lower expression of AtHKT1in the roots results in reduced Naþ
retrieval from the root xylem, leading to the elevated Naþ
observed in Ts-1 and Tsu-1 shoots. Such a model is strongly supported by our grafting experiments which clearly dem-onstrate that activity of HKT1 in the roots is the major site of HKT1 function in regulating Naþ
accumulation in shoots (Figure 6). These grafting experiments also demonstrate that the specific loss of HKT1 function in shoots has no significant effect on shoot accumulation of Naþ
(Figure 6). This evidence refines the existing model which proposes that HKT1 also
plays a significant role in retrieving Naþ
from shoots and exporting Naþ
from the shoot to root via the phloem [17,20], for which we find no evidence.
The ArabidopsisNaþ
transporter HKT1 plays an important role in the shoot Naþ
avoidance strategy of Arabidopsis,and because the new AtHKT1 allele reported here results in higher accumulation of Naþ
in shoots (Figures 1, 3, and S1), we would expect plants containing this allele of AtHKT1to be more sensitive to NaCl stress, as compared to Col-0. However, we observed this not to be the case. A comparison of the Col-0 and Tsu-1 ability to survive treatment with Naþ
clearly shows that Tsu-1 survives longer than Col-0 (Figure 7). Furthermore, F2 plants from a cross between Col-13Tsu-1, either homozygous or heterozygous for the AtHKT1 allele from Tsu-1, were more NaCl tolerant than plants homozygous for the Col-0 AtHKT1allele (Figure 7D). Such cosegregation of the Tsu-1 AtHKT1allele with increased NaCl tolerance is consistent with this new allele of AtHKT1being involved in the elevated tolerate to NaCl observed in Tsu-1. This evidence also confirms that inArabidopsis,reduced shoot accumulation of Naþ
is not necessary for enhanced salinity tolerance [25]. Both the Ts-1 and Tsu-1 accessions were collected from geographically (coastal regions of Spain and Japan) and genetically [21] distinct populations. However, both popula-tions contain this new AtHKT1 allele, which makes it tempting to speculate that this allele allows these two populations to thrive in coastal regions where there might be enrichment of NaCl in the soil due to exposure to seawater. However, an extensive haplotype analyses will be required to identify if this new allele of AtHKT1 has been under recent directional selection before we can make any conclusive statements about its adaptive significance.
Figure 7.Contribution of Tsu-1HKT1Allele to Survival Under NaCl Stress
(A) Relative NaCl tolerance ofhkt1–1, Col-0, and Tsu-1. Five-week-oldhkt1–1, Col-0, and Tsu-1 plants were treated biweekly with 100 mM NaCl. Picture was taken 6 wk after beginning of the salt treatment.
(B) NaCl tolerance of F2 plants from a Tsu-13Col-0 cross. Picture of one of four plant growth trays used in the experiment. Each tray includes plants from each parent (Col-0 and Tsu-1) as well as F2 plants.
(C) Distribution of the parental lines Col-0 (n¼11) and Tsu-1 (n¼14) recorded dead each week after beginning of the salt treatment. Presented data are percentage of plants dead each week after beginning of salt treatment.
(D) Distribution of F2 plants (Tsu-13Col-0,n¼95) genotyped as Col-0 homozygous or Tsu-1 homozygous or heterozygous for theHKT1allele and recorded dead each week after beginning of the salt treatment. Presented data are percentage of plants dead each week after beginning of salt treatment.
Materials and Methods
Plant materials.A. thalianaCol-0, Ts-1, Tsu-1, and other accessions reported in this paper were obtained from the Arabidopsis Stock Center at the Arabidopsis Biological Resource Center. The hkt1–1
mutant [19] was from our own seed stock. For the genetic analysis, F1 and F2 plants from different crosses are as specified throughout the paper.
General plant growth conditions. Plants used for elemental profiling by ICP-MS analysis were grown under unstressed conditions in a controlled environment, 8 h light:16 h dark (90lmolm2
s1
light intensity) and 19 to 228C [1]. Briefly, seeds were sown onto moist soil (Sunshine Mix LB2; Carl Brehob & Son, Indianapolis, Indiana, United States) with various elements added at subtoxic concen-trations (As, Cd, Co, Li, Ni, Pb, and Se [1]) and stratified at 48C for 3 d. Plants were bottom-watered twice per week with 0.253Hoagland solution in which iron was replaced with 10lM Fe-HBED [N,N9 -di(2-hydroxybenzyl)ethylenediamine-N,N9-diacetic acid monohydrochlor-ide hydrate; Strem Chemicals, Inc., http://www.strem.com). For sodium analysis after 42 d, plants were nondestructively sampled by removing one or two leaves. The plant material was rinsed with 18 MXwater and placed into Pyrex digestion tubes.
Screening of the F2 population from Tsu-13Col-0 for survival of NaCl stress.The evaluation of the F2 population from the Tsu-13
Col-0 cross in response to salt stress was realized in a growth chamber under controlled environmental conditions, 8 h light:16 h dark (150 lmol m2 s1light intensity), 21 8C:198C (day/night) and 60%
relative humidity. After stratification, F2 seeds as well as seeds from each one of the parents were sown onto moist soil (Scotts Potting Medium; Scotts-Sierra Horticultural Products Company, Marysville, Ohio, United States). About 2 wk after germination, seedlings were thinned to leave one plant per individual cell. Plants were bottom-watered twice per week with 0.53Murashige and Skoog (MS) Macro-and Micronutrients (Caisson Laboratories, Inc., Rexburg, Idaho, United States). One month after the seeds were sewn, NaCl was added to the watering solution increasingly from 50 to 100 mM NaCl and maintained at that level until all the plants were recorded dead.
Naþ
accumulation in plants exposed to increasing concentrations of NaCl in soil.Plants from Col-0,hkt1–1,Ts-1, and Tsu-1 used to evaluate Naþ
accumulation in the shoot in response to NaCl stress were grown under controlled growth conditions (as described above in‘‘General plant growth conditions’’) and treated with NaCl for 2 wk. NaCl treatment was started 1 mo after the seeds were sewn. Plants were watered twice weekly without or with NaCl. The NaCl treatments included plants watered with 50 mM NaCl and plants watered once with 50 mM, once with 75 mM, and twice with 100 mM NaCl. Two weeks after the beginning of the salt treatments, plants were harvested and analyzed by ICP-MS. Naþ
was analyzed in leaves of different age throughout the shoot. The leaves were numbered from the meristem toward the outer leaf ring of the rosette. Four samples (indicated as Nos. 1, 2, 3, and 4 in the graph) were harvested per plant, with No. 1 containing leaves Nos. 4 and 5 and therefore being the youngest leaves, No. 2 containing leaf No. 8, No. 3 containing leaf No. 11, and No. 4 containing leaf No. 14 and being the oldest.
Tissue Naþ
quantification.Approximately 3 mg of dry weight of each plant was sampled into Pyrex tubes (163100 mm) after drying at 928C for 20 h. After cooling, seven of approximately 100 samples from each sample set were weighed. All samples were digested with 0.7 ml of concentrated nitric acid (OmniTrace; VWR Scientific Products; http://www.vwr.com) and diluted to 6.0 ml with 18 MX water. Elemental analysis was performed with an ICP-MS (Elan DRCe; PerkinElmer, http://www.perkinelmer.com) for Li, B, Na, Mg, P, K, Ca, Mn, Fe, Co, Ni, Cu, Zn, As, Se, Mo, and Cd. All samples were normalized to calculated weights, as determined with an iterative algorithm using the best-measured elements, the weights of the seven weighed samples, and the solution concentrations, implemented in Microsoft Excel (http://www.microsoft.com) [1].
DNA microarray-based BSA. DNA microarray-based BSA was realized as previously described [12,13]. Briefly, SFPs were identified between Col-0 and Ts-1 and Tsu-1 by hybridizing labeled DNA from each one of the accessions to Affymetrix ATH1 microarrays and comparing them to Col-0 hybridizations downloaded from http:// www.naturalvariation.org/xam. Two genomic DNA pools from an F2 population of a cross between Ts-1 or Tsu-1 and Col-0 were created and hybridized to arrays. Each one of the pools contained plants with either levels of Naþ
similar to Col-0 (‘‘control’’ pool) or high Naþ
levels similar to Ts-1 or Tsu-1 (‘‘high Naþ’’pool). At loci unlinked to
the ionomic phenotype of interest, the pools should have equivalent amounts of each genotype, and the hybridization signal at each SFP should be intermediate between the two parent accessions, for an
average difference between the two DNA microarrays of zero. At linked loci, the difference between the two DNA microarrays should be approximately two-thirds the difference between the parent accessions. By smoothing the signal across multiple SFPs, the noise is reduced and the peak of the differences in hybridization signal will correspond to the chromosomal region of the loci controlling the mapped trait. Raw hybridization data (.CEL files) for each probe on the ATH1 DNA microarrays used in these experiments have been submitted to both Natrualvariation.org (http://www.naturalvariation. org) and Gene Expression Omnibus (http://www.ncbi.nlm.nih.gov/geo) for public distribution.
Sequencing of the AtHKT1allele from Ts-1 and Tsu-1.To sequence the AtHKT1gene and corresponding promoter from Ts-1 (CS1552) and Tsu-1 (CS1640), synthetic oligonucleotide primers were designed to produce overlapping amplified PCR products from 5,456 bp upstream of the AtHKT1start codon to 386 bp downstream of the AtHKT1stop codon, corresponding to positions 32,115 and 41,615, respectively of the BAC clone F24G24 in Chromosome IV.
Table S1 provides a summary of the pairs of primers used and the size of the PCR products expected for Col-0 (based on published sequence) and obtained for Ts-1 and Tsu-1. The PCR products obtained for each one of the primer pairs were cloned using the pGEM-T Easy Vector System I according to the manufacturer’s instructions (Promega, http://www.promega.com). After transforma-tion of electrocompetent Escherichia coli cells strain DH5a and selection of transformed colonies using ampicillin, positive clones were confirmed by PCR. The plasmids containing the inserted PCR product were extracted and used to carry out the sequencing reaction in both directions using Big Dye terminator v 3.0 according to the manufacturer’s instructions (Applied Biosystems, http://www. appliedbiosystems.com). The sequencing products were then ana-lyzed at the sequencing center (Purdue University), and sequences were compared to the corresponding Col-0 sequence from the
Arabidopsisdatabase.
Quantitative real-time PCR.Plants were first analyzed by ICP-MS and further used to determine the AtHKT1transcript levels. Shoot and root from plants grown under short-day conditions (as described above in ‘‘General plant growth conditions’’) were separated and rinsed thoroughly with deionized water to remove any soil contamination. The samples were then frozen in liquid nitrogen and stored at 80 8C until extraction. Total RNA was extracted from each one of the samples using the Qiagen RNeasy Plant Mini Kit (http://www.qiagen.com), and DNase digestion was performed during the extraction procedure according to the manufacturer’s instructions. Two micrograms of total RNA was used as a template to synthesize first-strand cDNA with random hexamers using SuperScript II Reverse Transcriptase (Invitrogen Life Technologies, http://www.invitrogen.com). Quantitative real-time PCR was performed with the first strand cDNA as a template on a sequence detector system (ABI Prism 7000, Applied Bio-systems). For normalization across samples, the expression of the
Actin 1 gene (At2g37620) was used with the following primers: CPRD66, 59-TGG AAC TGG AAT GGT TAA GGC TG-39 and CPRD67, TCT CCA GAG TCG AGC ACA ATA C-39. For AtHKT1, the following primers were used: HKT-RTF, 59-TGG GAT CTT ATA ATT CGG ACA GTT C-39and HKT-RTR, 59-GAT AAG ACC CTC GCG ATA ATC AGT-39. For each sample, the average value from triplicate real-time PCRs was used to evaluate the transcript abundance, and the relative fold induction relative to AtHKT1
expression in Col-0 shoots was calculated based on the DDCt
method.
transplanted directly to soil (as described above in‘‘General plant growth conditions’’). Plants were harvested for Naþ
analysis 4 wk after transfer to soil. Postharvest analysis of graft unions was performed under the stereoscope to identify any adventitious root formation from grafted individuals. Individuals with adventitious roots emerging at or above the graft union were eliminated from subsequent analyses.
Supporting Information
Figure S1. Higher Naþ
Accumulation in Ts-1 and Tsu-1 Under Unstressed and NaCl Stress Conditions
Naþ
contents were analyzed in leaves at four different stages of development (as described in Materials and Methods) across the shoot of 44-d-old Col-0 (circles), Ts-1 (triangles), Tsu-1 (squares), andhkt1–1
(diamonds) plants grown in soil under short-day conditions and treated for 17 d with (A) no NaCl addition, (B) 50 mM, or (C) 100 mM NaCl. Presented data are the mean6SE.
Found at doi:10.1371/journal.pgen.0020210.sg001 (314 KB PPT).
Figure S2.Alignment of AtHKT1 cDNA and promoter sequences from Col-0, Ts-1, and Tsu-1(A) AtHKT1cDNA sequences.(B) AtHKT1
promoter sequences.
Found at doi:10.1371/journal.pgen.0020210.sg002 (85 KB DOC).
Table S1.List of Primer Pairs Used to Sequence the AtHKT1Gene
and PCR Product Size Expected for Col-0 and Obtained for Ts-1 and Tsu-1
Found at doi:10.1371/journal.pgen.0020210.st001 (42 KB DOC).
Accession Numbers
TheArabidopsisBiological Resource Center (ABRC) (http://www.biosci. ohio-state.edu/pcmb/Facilities/abrc/abrchome.htm12) accessions used in this paper were Col-0 (CS6000), Cvi-0 (CS1096), Est-1 (CS1150), Kas-2 (CS1264), Mrk-0 (CS1374), Mt-0 (CS1380), Se-0 (CS1502), Ts-1 (CS1552), Van-0 (CS1584), Nd-1 (CS1636), Tsu-1 (CS1640), and Ler-2 (CS8581).
Acknowledgments
We would like to thank theArabidopsisBiological Resource Center for providing the seeds of theArabidopsisaccessions used in this paper.
Author contributions.AR, IB, and DES conceived and designed the experiments. AR, IB, BM, JG, BL, and EY performed the experiments. AR, IB, BM, JG, BL, and DES analyzed the data. AR and DES wrote the paper.
Funding. This research was supported by the National Science Foundation Plant Genome Research (DBI 0077378) and Arabidopsis
2010 (IOB 0419695) programs and the Indiana 21st Century Research and Technology Fund (912010479).
Competing interests.The authors have declared that no competing interests exist.
References
1. Lahner B, Gong J, Mahmoudian M, Smith EL, Abid KB, et al. (2003) Genomic scale profiling of nutrient and trace elements in Arabidopsis thaliana. Nat Biotechnol 21: 1215–1221.
2. Salt DE (2004) Update on plant ionomics. Plant Physiol 136: 2451–2456. 3. Gong JM, Waner DA, Horie T, Li SL, Horie R, et al. (2004) Microarray-based
rapid cloning of an ion accumulation deletion mutant in Arabidopsis thaliana. Proc Natl Acad Sci U S A 101: 15404–15409.
4. Payne KA, Bowen HC, Hammond JP, Hampton CR, Lynn JR, et al. (2004) Natural genetic variation in caesium (Cs) accumulation by Arabidopsis thaliana. New Phytologist 162: 535–548.
5. Vreugdenhil D, Aarts MGM, Koornneef M, Nelissen H, Ernst WHO (2004) Natural variation and QTL analysis for cationic mineral content in seeds of
Arabidopsis thaliana. Plant Cell Environ 27: 828–839.
6. Harada H, Leigh RA (2006) Genetic mapping of natural variation in potassium concentrations in shoots ofArabidopsis thaliana. J Exp Bot 57: 953–960.
7. Salvi S, Tuberosa R (2005) To clone or not to clone plant QTLs: Present and future challenges. Trends Plant Sci 10: 297–304.
8. Teng S, Keurentjes J, Bentsink L, Koornneef M, Smeekens S (2005) Sucrose-specific induction of anthocyanin biosynthesis inArabidopsisrequires the
MYB75/PAP1gene. Plant Physiol 139: 1840–1852.
9. Alonso-Blanco C, Koornneef M (2000) Naturally occurring variation in
Arabidopsis: An under exploited resource for plant genetics. Trends Plant Sci 5: 22–29.
10. Koornneef M, Alonso-Blanco C, Vreugdenhil D (2004) Naturally occurring genetic variation inArabidopsis thaliana. Annu Rev Plant Biol 55: 141–172. 11. Pigliucci M (1998) Ecological and evolutionary genetics of Arabidopsis.
Trends Plant Sci 3: 485–489.
12. Borevitz JO, Liang D, Plouffe D, Chang HS, Zhu T, et al. (2003) Large-scale identification of single-feature polymorphisms in complex genomes. Genome Res 13: 513–523.
13. Hazen SA, Borevitz JO, Harmon FG, Pruneda-Paz JL, Schultz TF, et al. (2005) Rapid array mapping of circadian clock and developmental mutations inArabidopsis. Plant Physiol 138: 990–997.
14. Wolyn DJ, Borevitz JO, Loudet O, Schwartz C, Maloof J, et al. (2004) Light-responsive quantitative trait loci identified with composite interval and eXtreme Array Mapping inArabidopsis thaliana. Genetics 167: 907–917. 15. Uozumi N, Kim EJ, Rubio F, Yamaguchi T, Muto S, et al. (2000) The
Arabidopsis HKT1gene homolog mediates inward Naþ
currents inXenopus
laevisoocytes and Naþ
uptake inSaccharomyces cerevisiae. Plant Physiol 122: 1249–1259.
16. Rus A, Yokoi S, Sharkhuu A, Reddy M, Lee Bh, et al. (2001) AtHKT1 is a salt tolerance determinant that controls Naþ
entry into plant roots. Proc Natl Acad Sci U S A 98: 14150–14155.
17. Berthomieu P, Cone´je´ro G, Nublat A, Brackenbury WJ, Lambert C, et al. (2003) Functional analysis of AtHKT1 in Arabidopsis shows that Naþ
recirculation by the phloem is crucial for salt tolerance. EMBO J 22: 2004–2014.
18. Ma¨ser P, Eckelman B, Vaidyanathan R, Horie T, Fairbairn DJ, et al. (2002a) Altered shoot/root Naþ
distribution and bifurcating salt sensitivity in
Arabidopsisby genetic disruption of the Naþ
transporter AtHKT1. FEBS Lett 531: 157–161.
19. Rus A, Lee Bh, Mun˜oz-Mayor A, Sharkhuu A, Miura K, et al. (2004) AtHKT1 facilitates Naþ
homeostasis and Kþ
nutritionin planta. Plant Physiol 136: 2500–2511.
20. Sunarpi, Horie T, Motoda J, Kubo M, Yang H, et al. (2005) Enhanced salt tolerance mediated by AtHKT1 transporter-induced Naþ
unloading from xylem vessels to xylem parenchyma cells. Plant J 44: 928–938.
21. Nordborg M, Hu TT, Ishino Y, Jhaveri J, Toomajian C, et al. (2005) The pattern of polymorphism inArabidopsis thaliana. PLoS Biol 3: e196. doi:10. 1371/journal.pbio.0030196
22. Ma¨ser P, Hosoo Y, Goshima S, Horie T, Eckelman B, et al. (2002b) Glycine residues in potassium channel-like selectivity filters determine potassium selectivity in four-loop-per-subunit HKT transporters from plants. Proc Natl Acad Sci U S A 99: 6428–6433.
23. Weigel D, Nordborg M (2005) Natural variation inArabidopsis. How do we find the causal genes? Plant Physiol 138: 567–568.
24. Lu C, Tej SS, Luo S, Haudenschild CD, Meyers BC, Green PJ (2005) Elucidation of the small RNA component of the transcriptome. Science 309: 1567–1569.
25. Essah PA, Davenport R, Tester M (2003) Sodium influx and accumulation in
Arabidopsis. Plant Physiol 133: 1–12.
26. Paul AL, Semer C, Kucharek T, Ferl RJ (2001) The fungicidal and phytotoxic properties of benomyl and PPM in supplemented agar media supporting transgenicArabidopsisplants for a Space Shuttle flight experi-ment. Appl Microbiol Biotechnol 55: 480–485.