UNIVERSIDADE FEDERAL DE MINAS GERAIS
Programa de Pós-Graduação em Engenharia Metalúrgica, Materiais e de Minas
Tese de Doutorado
“Oxidação de calcopirita: Investigação do mecanismo eletroquímico via difração de raios-X ex situ e in situ usando radiação síncrotron e quantificação do efeito galvânico da
associação com pirita”
Autor: Daniel Majuste
Orientadora: Professora Virgínia S. T. Ciminelli Co-orientador: Professor Kwadwo Osseo-Asare
ii UNIVERSIDADE FEDERAL DE MINAS GERAIS
Programa de Pós-Graduação em Engenharia Metalúrgica, Materiais e de Minas
Daniel Majuste
“Oxidação de calcopirita: Investigação do mecanismo eletroquímico via difração de raios-X ex situ e in situ usando radiação síncrotron e quantificação do efeito galvânico da
associação com pirita”
“Chalcopyrite oxidation: Investigation of the electrochemical mechanism by applying ex situ and in situ synchrotron X-ray diffraction techniques and quantification of the galvanic
effect of pyrite”
Tese de Doutorado apresentada ao Programa de Pós-Graduação em Engenharia Metalúrgica, Materiais e de Minas
da Universidade Federal de Minas Gerais
Área de Concentração: Tecnologia Mineral Orientadora: Professora Virgínia S. T. Ciminelli
Co-orientador: Professor Kwadwo Osseo-Asare, The Pennsylvania State University
Belo Horizonte
iv AGRADECIMENTOS
Agradeço aos meus pais Majuste e Vera pelo amor, exemplo, dedicação e, principalmente, por sempre acreditarem nos meus sonhos. Amo muito vocês!
Agradeço aos meus irmãos Rafa e Leco, e ao meu sobrinho João Gabriel, pela amizade e apoio constante ao longo desses anos.
Agradeço à minha namorada Ana Paula, meu amor, por perfumar todas as minhas manhãs, tardes e noites e, assim, tornar suave a realização dessa etapa.
Agradeço a todos os meus familiares e amigos de Montes Claros, Belo Horizonte e State College pelo carinho e apoio.
Agradeço imensamente à minha orientadora, Profa. Virgínia S. T. Ciminelli, pelo grande incentivo, suporte, confiança e amizade. Obrigado, Virgínia, pelos inúmeros conselhos e ensinamentos nesse período. Foi e será sempre uma honra poder trabalhar ao seu lado.
I would like to express my sincere gratitude to my co-adviser, Prof. K. Osseo-Asare, for providing me exceptional guidance and encouraging me, all the time, to push my research expectations to high levels. Thanks, Osseo, for everything!
Agradeço à Dra. Cláudia L. Caldeira e Profa. Maria Sylvia S. Dantas pelo conhecimento transmitido, excelente convivência, e por todo o apoio durante esses anos.
Agradeço à Ilda S. Batista e Christina Salvador pelo carinho, atenção e disponibilidade em me ajudar sempre. Vocês são muito especiais! Adoro vocês!
v Agradeço a toda equipe do Laboratório de Análises Químicas, em especial, Prof. Júlio C. Silva, Profª. Roberta Froes e Izabella Costa Martins pelas análises realizadas.
Agradeço ao Prof. Dagoberto B. Santos (DEMET, UFMG), Prof. Paulo. R. G. Brandão (DEMIN, UFMG), Prof. Hélio A. Duarte (DQ, UFMG), Profa. Vanessa F. C. Lins (DEQ, UFMG) e Prof. Edwin A. Vilegas (DEMET, UFMG) pelo apoio e contribuições.
Agradeço ao Prof. Rogério M. Paniago (DF, UFMG) pela colaboração na elaboração de projeto e importante assistência na realização de medidas no Laboratório Nacional de Luz Síncrotron (LNLS), Campinas.
I’m grateful to Dr. Peter Eng (Consortium for Advanced Radiation Sources, University of Chicago) for the receptiveness to me and to the project, and for the valuable contributions during the measurements at the Argonne National Laboratory (ANL), Chicago.
I would like to thank Claire R. Fleeger and Andy J. Wall at Penn State University for the support on the construction work of the reaction cell used for measurements at ANL.
Agradeço a todos os funcionários do DEMET e CPGEM pela colaboração e convivência prazerosa, mas especialmente à Andréia B. Henriques, Laboratório de Difração de Raios-X; Patrícia M. T. Azevedo, Laboratório de Microscopia Eletrônica; Nelson A. Azevedo e Maria Aparecida Pacheco, Colegiado de Pós-graduação.
Agradeço ao Sr. Newton Urias Pinto por todos os serviços prestados nesses anos.
Agradeço ao Conselho Nacional de Desenvolvimento Científico e Tecnológico (CNPq) e ao INCT-ACQUA (Instituto Nacional de Ciência e Tecnologia em Recursos Minerais, Água e Biodiversidade), pelo suporte financeiro.
Agradeço a Deus que me guia e protege e que nesta data, com saúde e alegria, me permite agradeçer do fundo do meu coração a todas essas pessoas:
vi OUTLINE
CHAPTER 1. INTRODUCTION……….. 1
1.1. Copper: Economic value and main ore deposits…..………..………... 1
1.1.1. Chalcopyrite oxidation mechanisms..………..……….... 3
1.2. Objectives………. 6
1.3. Thesis structure and organization………. 7
CHAPTER 2. LITERATURE REVIEW……….. 9
2.1. Extractive metallurgy of copper……….... 9
2.1.1. Hydrometallurgical processing of copper sulfide ores……… 10
2.2. Chalcopyrite: Fundamental properties... 13
2.2.1. Structure and bonding……….. 13
2.2.2. Semiconductor character……….. 14
2.2.3. Thermodynamic stability………. 17
2.3. Chalcopyrite dissolution………...……….... 19
2.3.1. Anodic oxidation………..……….... 26
2.3.2. Galvanic interaction………...……….. 34
2.4. Electrochemical techniques………... 38
2.4.1. Potentiometry………... 38
2.4.2. Linear sweep voltammetry………... 39
2.4.2.1. Tafel plots………... 40
2.4.3. Chronoamperometry……….... 42
2.5. Characterization techniques……….. 43
2.5.1. Raman spectroscopy……….... 44
2.5.2. X-ray diffraction ………. 48
2.5.2.1. Ex situ synchrotron small angle X-ray diffraction………...…... 51
2.5.2.2. In situ synchrotron time-resolved X-ray diffraction………... 52
CHAPTER 3. QUANTITATIVE ASSESSMENT OF THE EFFECT OF PYRITE INCLUSIONS ON CHALCOPYRITE ELECTROCHEMISTRY UNDER OXIDIZING CONDITIONS………. 53
Abstract……… 53
3.1. Introduction………... 54
vii
3.3. Experimental………...………...………... 57
3.3.1. Mineral electrodes……….………... 57
3.3.2. Characterization of the mineral electrodes………... 58
3.3.3. Electrochemical measurements……….... 59
3.4. Results………... 60
3.4.1. Characterization of the mineral electrodes………... 60
3.4.2. Electrochemical measurements: Mixed potential……….... 63
3.4.2.1. Effect of pyrite inclusions………. 63
3.4.2.2. Effects of dissolved oxygen and ferric ion………... 64
3.4.3. Electrochemical measurements: Dissolution current density………….…. 67
3.4.3.1. Effect of pyrite inclusions………. 67
3.4.3.2. Effects of dissolved oxygen and ferric ion……….... 68
3.5. Discussion………. 70
3.5.1. Effects of oxidants on the electrochemistry of chalcopyrite……….... 70
3.5.2. Effects of pyrite inclusions on the electrochemistry of chalcopyrite……... 75
3.6. Conclusions………... 80
CHAPTER 4. ELECTROCHEMICAL DISSOLUTION OF CHALCOPYRITE: DETECTION OF BORNITE BY SYNCHROTRON SMALL ANGLE X-RAY DIFFRACTION AND ITS CORRELATION WITH THE HINDERED DISSOLUTION PROCESS……….. 81
Abstract……….. 81
4.1. Introduction………... 82
4.2. Reaction products of chalcopyrite dissolution…...………... 83
4.3. Experimental………...……...………... 87
4.3.1. Chalcopyrite electrodes……….... 87
4.3.2. Characterization of the chalcopyrite electrodes………... 88
4.3.3. Electrochemical measurements……….... 88
4.4. Results………... 90
4.4.1. Characterization of the chalcopyrite electrodes………... 90
4.4.2. Electrochemical measurements……….………... 92
4.4.2.1. Linear sweep voltammetry……… 92
4.4.2.2. Chronoamperometry………. 94
viii
4.4.3.1. At 0.60 V………... 98
4.4.3.2. At 0.70 V………... 99
4.4.3.3. At 0.80 V………... 101
4.4.3.4. At 1.00 V………... 105
4.5. Discussion………. 107
4.5.1. Formation of bornite as an intermediate product of chalcopyrite oxidation 107 4.5.2. The role of bornite in the chalcopyrite oxidation mechanism.……… 109
4.6. Conclusions………... 111
CHAPTER 5. APPLICATIONS OF IN SITU SYNCHROTRON XRD IN HYDROMETALLURGY: REVIEW OF THE LITERATURE AND NEW RESULTS FOR CHALCOPYRITE DISSOLUTION... 113
Abstract……….. 113
5.1. Introduction………... 114
5.2. In situ investigations in aqueous media by synchrotron X-ray diffraction……... 115
5.2.1. S-XRD………. 115
5.2.2. In situ investigations of mineral formation and dissolution reactions…… 123
5.3. Experimental…………..………... 127
5.3.1. Chalcopyrite sample………. 127
5.3.2. Reaction solution………. 128
5.3.3. S-TRXRD measurements………. 129
5.4. Results and discussion……….. 131
5.4.1. Characterization of the chalcopyrite sample……….... 131
5.4.2. S-TRXRD measurements: Flow method….……… 133
5.4.3. S-TRXRD measurements: No-flow method….……….. 136
5.5. Conclusions………... 141
CHAPTER 6. FINAL CONSIDERATIONS……….... 143
6.1. Main contributions…..………... 143
6.2. Suggestions to future investigations………. 144
APPENDICE. CHARACTERIZATION OF CHALCOPYRITE ELECTRODES BY MEANS OF RAMAN SPECTROSCOPY PRIOR TO ELECTROCHEMICAL MEASUREMENTS………..… 146
Abstract………. 146
ix
A.2. Experimental…………..……….. 150
A.2.1. Chalcopyrite samples……….………. 150
A.2.2. Characterization of the chalcopyrite samples………...………….. 150
A.3. Results and discussion………. 151
A.3.1. Quantitative chemical composition of the mineral sample…..…….…….. 151
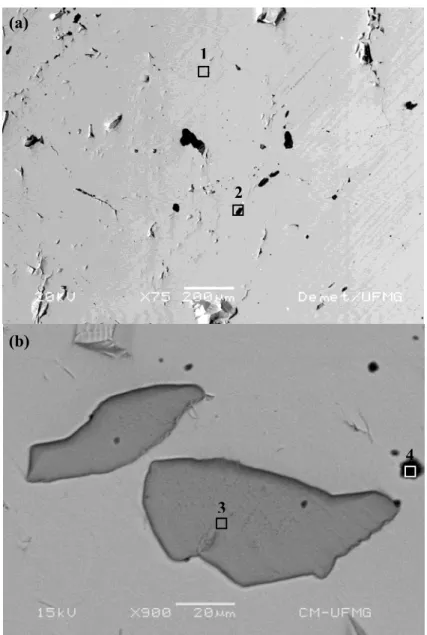
A.3.2. Analysis of mineral samples by SEM/EDS……….………... 152
A.3.3. Analysis of mineral samples by Raman spectroscopy……… 155
A.4. Conclusions……….. 160
x LIST OF TABLES
Table II.1: Chloride-based processes for copper sulfide ores (Dutrizac, 1992; Wang, 2005; Liddicoat and Dreisinger, 2007)………... 11 Table II.2: Sulfate-based processes for copper sulfide ores (Dreisinger, 2006;
Wang, 2005; McDonald and Muir, 2007a, 2007b)………...…. 12 Table II.3: Leaching kinetics of chalcopyrite in ferric sulfate and ferric chloride
solutions: Curve shape, apparent activation energy (Ea, in kJ/mol) and rate-determining step………... 22 Table II.4: Ex situ analysis of chalcopyrite after dissolution in acidic solutions
under atmospheric conditions……… 24 Table II.5: Experimental conditions and electrochemical techniques applied in
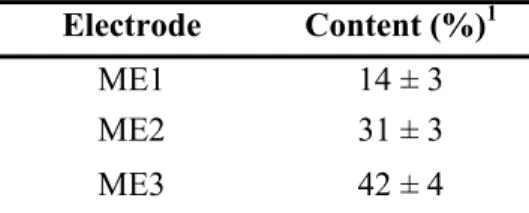
investigations of chalcopyrite dissolution in acidic solutions………... 28 Table III.1: Pyrite content on the surface of mixed (CuFeS2-FeS2) electrodes…… 63
Table III.2: Mixed potentials (V/SHE) for the mineral electrodes in 0.1 mol.L-1 H2SO4 solutions after nitrogen bubbling and in the presence of ferric
ion and dissolved oxygen, under atmospheric conditions………. 66 Table III.3: Dissolution current densities (A/cm2) for the mineral electrodes in
0.1 mol.L-1 H2SO4 solutions after nitrogen bubbling and in the
presence of ferric ion and dissolved oxygen, under atmospheric
conditions………... 69
Table IV.1: Ex situ analysis of chalcopyrite after dissolution in acidic solutions under atmospheric conditions……… 84 Table V.1: Applications of in situ S-XRD techniques in reactions relevant to
hydrometallurgy and corrosion reactions in aqueous media…………. 117 Table V.2: Main findings obtained by in situ S-XRD techniques applied to
investigate reactions relevant to hydrometallurgy and corrosion reactions in aqueous media……… 120 Table AI.1: Mixed potential of chalcopyrite in sulfate media under atmospheric
conditions………... 148
Table AI.2: Quantitative chemical composition (% wt.) of the CuFeS2 sample…... 152
xi LIST OF FIGURES
Figure 1.1: Copper LME, grade A: historic evolution of the average prices (1991-2010) (adapted of LME, 2010)……… 2 Figure 2.1: CuFeS2: (a) Crystal structure and (b) Atomic arrangement. The
yellow spheres represent S atoms, while the blue and green spheres Cu and Fe atoms (Webmineral, 2010)………... 14 Figure 2.2: (a) Simplified energy-band diagram of chalcopyrite: Eg = band
gap; Ev = upper valence band edge; Ec = lower conduction band
edge; and (b) Relative position of the energy levels of common redox couples into solution (adapted of Crundwell, 1988)………… 15 Figure 2.3: Eh-pH diagram for the Cu-Fe-S-H2O system at 25°C: [S] = 0.1
mol/L; [Fe] = [Cu] = 0.01 mol.L-1 (HSC Chemistry®, version 6)…. 19 Figure 2.4: Typical linear sweep voltammogram for a chalcopyrite electrode… 27 Figure 2.5: Electrochemical behavior of anodic polarized chalcopyrite
electrode in acidic sulfate solution containing ferrous and cupric ions (adapted of Hiroyoshi et al., 2004)……… 32 Figure 2.6: Galvanic interaction between CuFeS2 and FeS2 (adapted of You et
al., 2007)……… 35
Figure 2.7: (a) Anodic and cathodic sites on the surface of metal sulfide electrode; and (b) The mixed potential diagram: ia and ic are the
anodic and the cathodic current densities, respectively (adapted of Nicol and Lázaro, 2002)……… 39 Figure 2.8: Typical linear sweep voltammogram: Ea = anodic peak potential; ia
= anodic peak current. The solid arrow indicates the sweep
direction………... 40
Figure 2.9: Tafel plots: EM = mixed potential (zero overpotential). The solid
and dotted arrows indicate the sweep direction in the anodic and cathodic regions, respectively……… 41 Figure 2.10: Typical chronoamperogram obtained under a positive potential
pulse: ia = anodic peak current; and iss = steady-state current……... 43
xii heteronuclear diatomic molecule (adapted of Smith, 1999)……... 45 Figure 2.12: Schematic interaction between the light electric vector with a
heteronuclear polyatomic molecule (adapted of Smith, 1999)…….. 46 Figure 2.13: Normal vibrations of a heteronuclear polyatomic molecule. The
arrows indicate the direction of atoms motion and the signs + and – the atoms motion upward and down relatively to the plan of paper, respectively (adapted of Ferraro et al., 2003)……… 47 Figure 2.14: X-ray diffraction by a crystal (adapted of Klug and Alexander,
1974)……….. 49
Figure 2.15: X-ray diffraction: relation between the incident and diffracted beams at grazing angles (adapted of Klug and Alexander, 1974)…. 49 Figure 3.1: Back-scattered electron micrographs of (a) CE, (b) ME and (c) PE
electrodes, and selected areas analyzed by EDS……… 61 Figure 3.2: Raman spectra obtained for areas 1, 2, 3 and 5 (vide Fig. 3.1)……. 62 Figure 3.3: Potentials on chalcopyrite, pyrite and pyrite-containing
chalcopyrite electrodes in 0.1 mol.L-1 H2SO4 solutions after N2
bubbling, under atmospheric conditions……… 64 Figure 3.4: Potentials on the CE electrode in 0.1 mol.L-1 H2SO4 solutions after
nitrogen bubbling and in the presence of different oxidants, under atmospheric conditions……….. 65 Figure 3.5: Tafel plots for the CE and ME electrodes in 0.1 mol.L-1 H2SO4
solutions after nitrogen bubbling, under atmospheric conditions. Legend: Solid (black) - CE electrode; Dot (black) - ME1 electrode; Dash (black) - ME2 electrode; Solid (gray) - ME3 electrode……… 67 Figure 3.6: Tafel plots for the CE electrode in 0.1 mol.L-1 H2SO4 solutions
under atmospheric conditions. Legend: Solid (black) - After N2
bubbling; Dot (black) - 0.001 mol.L-1 O2; Dash (black) - 0.01
mol.L-1 Fe3+; Dash Dot Dot (black) - 0.05 mol.L-1 Fe3+; Solid (gray) - 0.001 mol.L-1 O2 + 0.05 mol.L-1 Fe3+………... 68
Figure 3.7: Tafel plots (cathodic branch) for the CE electrode in 0.1 mol.L-1 H2SO4 solutions in the presence of oxygen (0.001 mol.L-1 O2) and
xiii mol.L-1 H2SO4 solutions in the presence of (a) oxygen (0.001
mol.L-1 O2) and (b) ferric ion (0.01 mol.L-1), under atmospheric
conditions.………... 76 Figure 3.9: Tafel plots (cathodic branch) for the CE and ME3 electrodes in 0.1
mol.L-1 H2SO4 solutions in the presence of (a) oxygen (0.001
mol.L-1 O2) and (b) ferric ion (0.05 mol.L-1), under atmospheric
conditions………... 78
Figure 3.10: Electrode-solution interface: (a) Area available for reduction reactions on the surface of CE electrodes (Aanodic Acathodic); and
(b) area available for reduction reactions on the surface of ME electrodes (Aanodic < Acathodic)………. 79
Figure 4.1: Huber diffractometer: (a) the detector; (b) the sample holder with electrode sample; and (c) the X-ray beam optics………... 89 Figure 4.2: (a) Back-scattered electron micrograph of chalcopyrite electrode
and selected areas analyzed by EDS and micro Raman spectroscopy; and (b) Raman spectra obtained for areas 1 and 2….. 91 Figure 4.3: S-SAXRD patterns for chalcopyrite electrode and the
corresponding Miller indices. Legend: CuFeS2 (C); and
Fe-CaMgSi2O6 (D)……….. 92
Figure 4.4: Linear sweep voltammograms (0.5 mV/s) of chalcopyrite electrodes in 0.1 mol.L-1 H2SO4 solutions under atmospheric
conditions………... 93
Figure 4.5: Effect of potential on the potentiostatic current-time profiles for chalcopyrite electrodes in 0.1 mol.L-1 H2SO4 solutions under
atmospheric conditions. Two electrode samples (Eclow and Echigh)
were oxidized at 0.80 V………. 94 Figure 4.6: Optical micrographs of CuFeS2 electrodes oxidized in 0.1 mol.L-1
H2SO4 solutions under atmospheric conditions at: (a) 0.70 V, for 2
h; (b) 0.70 V, for 4 h……….. 95 Figure 4.7: Linear sweep voltammograms (0.5 mV/s) of CuFeS2 electrodes
Eclow (lower critical potential) and Echigh (higher critical potential)
in 0.1 mol.L-1 H2SO4 solutions under atmospheric conditions…….. 96
xiv H2SO4 solutions under atmospheric conditions at: (a) 0.80 V
(Eclow), for 1 h; (b) 0.80 V (Eclow), for 2 h………. 96
Figure 4.9: Optical micrographs of CuFeS2 electrodes oxidized in 0.1 mol.L-1
H2SO4 solutions under atmospheric conditions at: (a) 0.80 V
(Echigh), for 1 h; (b) 0.80 V (Echigh), for 2 h………... 97
Figure 4.10: Potentiostatic current-time profiles at 0.80 V for six CuFeS2
electrodes in 0.1 mol.L-1 H2SO4 solutions under atmospheric
conditions………... 97
Figure 4.11: Optical micrographs of CuFeS2 electrodes oxidized in 0.1 mol.L-1
H2SO4 solutions under atmospheric conditions at: (a) 1.00 V, for
0.5 h; (b) 1.00 V, for 3 h……… 98 Figure 4.12: Optical micrograph of chalcopyrite electrode oxidized at 0.60 V in
0.1 mol.L-1 H2SO4 solution under atmospheric conditions for 24 h,
and Raman spectra obtained for areas 1 and 2………... 100 Figure 4.13: S-SAXRD patterns of chalcopyrite electrode oxidized at 0.70 V in
0.1 mol.L-1 H2SO4 solution under atmospheric conditions for 6 h.
Legend: CuFeS2 (C); and Cu5FeS4 (B)……….. 101
Figure 4.14: S-SAXRD patterns of chalcopyrite electrodes oxidized at 0.80 V in 0.1 mol.L-1 H2SO4 solutions under atmospheric conditions for 2 h:
(a) Echigh; and (b) Eclow. Legend: CuFeS2 (C); Cu5FeS4 (B); and S8
(S)………... 102
Figure 4.15: Optical micrograph of chalcopyrite electrode oxidized at 0.80 V in 0.1 mol.L-1 H2SO4 solution under atmospheric conditions for 1 h,
and Raman spectra obtained for areas 1 and 2………... 104 Figure 4.16: Optical micrograph of chalcopyrite electrode oxidized at 0.80 V in
0.1 mol.L-1 H2SO4 solution under atmospheric conditions for 2 h,
and corresponding Raman spectra………. 106 Figure 4.17: S-SAXRD patterns of chalcopyrite electrode oxidized at 1.00 V in
0.1 mol.L-1 H2SO4 solution under atmospheric conditions for 0.5 h.
Legend: CuFeS2 (C); and S8 (S)……… 107
xv Figure 5.2: XRD patterns for the chalcopyrite sample and corresponding
Miller indices. Legend: CuFeS2 (C); and SiO2 (Q)………... 132
Figure 5.3: In situ S-TRXRD measurements of chalcopyrite under 0.1 mol.L-1 H2SO4 solution (0.75 V vs. SHE) flow. From 0 to 10 h the
temperature was kept constant at 25 °C. Legend: Corresponding Miller indices of CuFeS2 (C); and SiO2 (Q)……….. 133
Figure 5.4: Variation of the relative intensity of the strongest (a) quartz XRD peak (plane (1 0 1) at 2 angle of 17.9°) and (b) chalcopyrite XRD peak (plane (1 1 2) at 2 angle of 19.7°), as a function of time…… 135 Figure 5.5: In situ S-TRXRD measurements of chalcopyrite sample
conditioned in 0.1 mol.L-1 H2SO4 solution at 0.75 V vs. SHE. 2θ
from 16 to 24°. Legend: Corresponding Miller indices of CuFeS2
(C); SiO2 (Q); CuS (Co); and S8 (S)……….. 137
Figure 5.6: In situ S-TRXRD measurements of chalcopyrite sample conditioned in 0.1 mol.L-1 H2SO4 solution at 0.75 V vs. SHE: (a)
2θ from 28 to 40°; and (b) 2θ from 17 to 19°. Legend: Corresponding Miller indices of CuFeS2 (C); SiO2 (Q); S8 (S);
CuSO4.H2O (CS); and FeSO4.H2O (IS)………. 139
Figure AI.1: Back-scattered electron micrographs of typical chalcopyrite samples. Magnification: (a) 25x; (b) 75x; and (c) 300x……… 153 Figure AI.2: Back-scattered electron micrograph of chalcopyrite sample.
Magnification: 100x……….. 154
xvi LIST OF ABBREVIATIONS
Advanced Photon Source - Argonne National Laboratory (APS-ANL) Atomic absorption spectrophotometry (AAS)
Brazilian Synchrotron Light Laboratory (LNLS) Carbon paste electrode (CPE)
Critical potential (Ec)
Chalcopyrite-free pyrite electrode (PE) Chronoamperometry (CA)
Cyclic voltammetry (CV) Density functional theory (DFT)
Electrochemical impedance spectroscopy (EIS) Electron probe microanalyses (EPMA)
Energy dispersive spectrometry (EDS)
Ex situ synchrotron small angle X-ray diffraction (S-SAXRD) Flow method (FM)
Highest occupied molecular orbital (HOMO)
In situ synchrotron time-resolved X-ray diffraction (S-TRXRD) Inductively coupled plasma mass spectrometry (ICP-MS)
Inductively coupled plasma optical emission spectrometry (ICP-OES) Infrared spectroscopy (IR)
International Centre for Diffraction Data (ICDD) Linear sweep voltammetry (LSV)
London Metal Exchange (LME)
Lowest unoccupied molecular orbital (LUMO) Massive electrode (ME)
Mineral Liberation Analysis (MLA)
Mixed (chalcopyrite-pyrite) electrode (ME) Mixed potential (EM)
Non-flow method (NFM) Open circuit potential (OCP)
xvii Raman spectroscopy (RS)
Rotating ring-disk electrode (RDE) Saturated Calomel Electrode (SCE) Scanning electron microscopy (SEM) Silver/Silver chloride Electrode (Ag/AgCl) Standard hydrogen electrode (SHE)
Stainless Steel Pseudo Reference Electrode (SSRE) Synchrotron radiation (S)
Time-of-flight secondary ion mass spectrometry (TOF-SIMS) X-ray absorption near edge structure spectroscopy (XANES) X-ray absorption spectroscopy (XAS)
X-ray diffraction (XRD)
xviii RESUMO
A calcopirita (CuFeS2) é o mineral de cobre mais abundante. A taxa de dissolução desse
sulfeto em baixas temperaturas é lenta e tipicamente diminui com o tempo. A maioria dos estudos atribui essa cinética à formação de uma camada de produto insolúvel que impede o progresso da dissolução. Porém, o mecanismo de formação dessa camada, bem como sua natureza/efeito no processo não são completamente estabelecidos. Assim, o propósito desta tese foi investigar a taxa e mecanismos de dissolução de calcopirita em baixas temperaturas visando aumentar a extração de cobre a partir de minérios calcopiríticos de baixo teor. Os resultados dessa investigação incluem evidências experimentais originais de que a forma-ção de sulfeto deficiente em metais nas condições de pré-onda anódica (i.e., potenciais menores que o potencial crítico de CuFeS2: 0.75-0.90 V vs. SHE) contribui para a taxa
lenta de dissolução do mineral. Resultados obtidos por espectroscopia Raman e difração de raios-X (DRX) em baixo ângulo, com radiação síncrotron, demonstraram que a sua oxida-ção envolve a formaoxida-ção de camada de bornita (Cu5FeS4), produto este que diminui a taxa
de oxidação de calcopirita à 0.70 e 0.80 V vs. SHE. Camadas de enxofre elementar (S8) e
covelita (CuS) também foram detectadas sobre eletrodos de CuFeS2. Enquanto a formação
de CuS impediu o progresso da reação, nenhuma evidência associando a formação de S8 à
diminuição da taxa de oxidação foi encontrada. Pela primeira vez, a transição in situ de CuFeS2 para tais produtos foi investigada por DRX resolvido no tempo, com radiação
sín-crotron. À 25 °C, nenhum produto foi detectado durante o tempo de reação adotado (10 h). Por outro lado, o efeito significativo da temperatura na taxa de dissolução do mineral foi ilustrado. À 100 °C, observou-se a transição direta de CuFeS2 para CuS em potencial de
pré-onda anódica (i.e., 0.75 V vs. SHE). Enxofre elementar fundido também foi detectado. Até então avaliado de forma qualitativa, o efeito galvânico de pirita (FeS2) – fase presente
em minérios de cobre – na taxa de oxidação de CuFeS2 foi quantificado nesta tese. Quando
associada à FeS2, a densidade de corrente de dissolução de CuFeS2 aumentou em até 2.6 e
2.2x, respectivamente, em soluções contendo 0.001 mol.L-1 O2 ou 0.05 mol.L-1 Fe3+, e em
até 1.6x na presença de ambos os oxidantes. Portanto, o maior efeito de FeS2 na taxa de
oxidação de CuFeS2 foi observada em condições de baixa oxidação. Resumindo, a
aplicação original de métodos eletroquímicos e técnicas ex situ e in situ de DRX permitiu uma avaliação detalhada do mecanismo de oxidação de CuFeS2, resultados essenciais ao
xix ABSTRACT
Chalcopyrite (CuFeS2) is the most abundant copper mineral. The dissolution rate of this
sulfide at low temperatures is slow and typically tends to decline with time. Most of the studies ascribe the slow kinetics to the formation of an insoluble layer, which prevents further mineral dissolution. However, the formation mechanism of this product layer and its nature/effects on the process are poorly understood. Thus, the purpose of this thesis was to investigate the rate and mechanisms of CuFeS2 dissolution at low temperatures aiming at
enhancing Cu extraction from low-grade, chalcopyrite ores. The findings of the present investigation provide experimental, original evidences that the formation of metal-deficient sulfides under anodic prewave conditions (i.e., potentials lower than the critical potential of CuFeS2: 0.75-0.90 V vs. SHE) contributes to the slow dissolution rate of this sulfide.
Results by using Raman spectroscopy and ex situ synchrotron small angle X-ray diffraction (XRD) demonstrated that CuFeS2 oxidation involves the formation of an intermediate
bornite (Cu5FeS4) layer, which declined the CuFeS2 oxidation rate at 0.70 and 0.80 V vs.
SHE. Elemental sulfur (S8) and covellite (CuS) were also detected at 0.80-1.00 and 0.80 V
vs. SHE, respectively. While the presence of CuS led to hindered dissolution, no evidence to link the formation of S8 to the diminution of CuFeS2 oxidation rate was found. For the
first time, the in situ transition of CuFeS2 to the reaction products was also investigated by
in situ synchrotron time-resolved XRD. At 25 °C, no reaction product was detected up to 10 h. On the other hand, the significant effect of temperature on the dissolution rate was illustrated. At 100 °C, a direct transition of CuFeS2 to CuS at anodic prewave potential
(i.e., 0.75 V vs. SHE) takes place. Melted S8 was also detected under these conditions. So
far evaluated qualitatively, the effect of pyrite (FeS2) – mineral phase often found in copper
sulfide ores – on CuFeS2 dissolution was quantified in this thesis. When associated to FeS2,
the dissolution current density of CuFeS2 increased by a factor of approximately 2.6 and
2.2, respectively, in solutions containing 0.001 mol.L-1 O2 and 0.05 mol.L-1 Fe3+, and by
1.6 times in the presence of both oxidants. Therefore, more pronounced effect of pyrite on chalcopyrite oxidation rate was observed under the lower oxidizing conditions. In summary, this original application of electrochemical methods and ex situ and in situ synchrotron XRD techniques allowed a detailed discussion of the oxidation mechanism of CuFeS2, which is essential to develop alternative processes for treating low-grade, copper
1
Chapter 1 – Introduction
1.1. Copper: Economic value and main ore deposits
Copper (Cu) is the third most consumed metal in the world after iron and aluminum
(USGS, 2010). Due to properties such as high ductility and malleability, high electrical and thermal conductivity, and resistance to corrosion, copper is found in diverse applications, either in the metallic form or alloys. Materials produced from copper are largely used in building wiring and construction, energy generation, telecommunications, transportation, consumer/general products, and high technology devices (ICSG, 2010).
In the nearby future, the global market may face a constant shortage of this important commodity. According to forecasts (CRU International, 2011), the worldwide demand for copper will overcome the supply from 2018. Among the main reasons for a decreasing production of copper is the drop in the metal content in the existent ore deposits.
Copper deposits are widely distributed in the world, but approximately 42% of the world mine production of copper comes from Chile and Peru (USGS, 2010). In Brazil, the main deposits are located in the states of Pará, Goiás, Bahia, and Ceará. Brazilian production of copper concentrates is relatively small, approximately 1.3% of the world production, level similar to that presented for the production of metallic copper (DNPM, 2010). This mineral commodity has as the main producers China, Chile, Japan and the United States (USGS, 2010).
2 Figure 1.1. Copper LME, grade A: historic evolution of the average prices (1991-2010)
(adapted of LME, 2010).
In nature, Cu is found in association with a range of elements in different structural forms and stoichiometric proportions, rarely in the pure state. Copper deposits, originated from volcanism, hydrothermal activity or weathering processes (Jensen and Bateman, 1981), are usually of large dimensions, but with low content. Typical deposits contain from 0.5% Cu (open mines) to 1-2% Cu (underground mines), and are classified in (1) primary or sulfide deposits, typically high-grade ores, found in the deeper zones of the earth crust; and (2) secondary or oxidized ores, with relatively lower Cu content, found in the superficial zones
(Davenport et al., 2002).
For the sulfide deposits, chalcopyrite (CuFeS2) is the most abundant copper mineral. This
sulfide accounts for approximately 70% of the world’s known copper deposits (Davenport
et al., 2002). In the porphyry ores, the most extensive deposits, chalcopyrite is found in association to pyrite (FeS2), with minor bornite (Cu5FeS4), molybdenite (MoS2), and
3 pentlandite ((Fe,Ni)9S8) (Jensen and Bateman, 1981; Berry et al., 1983; Habashi, 1993).
Chalcopyritealso occurs in low-temperature hydrothermal deposits (associated with galena (PbS), ZnS and dolomite (CaMg(CO3)2)), and high-temperature deposits (associated with
Fe1.0-0.8S and (Fe,Ni)9S8) (Berry et al., 1983).
In the last decades, the processing of sulfide ores has been extensively investigated, mainly for treating chalcopyrite – the main copper source and the main constituent in low-grade ores. The future development of copper industry is, therefore, allied to the effectiveness of chalcopyrite dissolution.
1.1.1. Chalcopyrite oxidation mechanism
As will be discussed in this thesis, chalcopyrite does not dissolve significantly under heap bioleaching conditions and economically attractive processing at high pressures requires high-grade ores.
For low temperatures, the mineral leaching rate in acidic media is known to be extremely slow, and often tends to decline with time (Jones and Peters, 1976; Dutrizac, 1978, 1981; Muñoz et al., 1979; Majima et al., 1985; Hirato et al., 1987a). In an attempt to overcome this constraint, a number of investigations have been conducted aimed at understanding the kinetics and mechanisms of dissolution of this sulfide. Most of the studies available in the literature ascribe the slow leaching rate of chalcopyrite to the formation of an insoluble layer, which prevents further mineral dissolution. Nonetheless, the nature of such product layer and the mechanisms by which it is formed and affects the dissolution reaction are subject of debate in the literature.
4 The efforts to improve the mineral leaching rate have mainly focused on the understanding on the kinetics and mechanisms of dissolution of this sulfide. Kinetics and mechanistic investigations have been conducted by different techniques at varied acidity, oxidizing and temperature conditions, and by using chalcopyrite samples from different sources. Many authors have investigated the nature and effects of the product phases (Jones and Peters,
1976; Linge, 1976; Dutrizac, 1978, 1989; Ammou-Chokroum et al., 1979; Biegler and
Swift, 1979; Muñoz et al., 1979; Parker et al., 1981; Warren et al., 1982; Majima et al.,
1985; Hirato et al., 1986, 1987a; Yin et al., 1995; England et al., 1999; Klauber et al.,
2001; Arce and González, 2002; Elsherief, 2002; Farquhar et al., 2003; Lázaro and Nicol,
2003, 2006; Parker et al., 2003; Todd et al., 2003; Abraitis et al., 2004; Hiroyoshi et al.,
2004; Mikhlin et al., 2004; Al-Harahsheh et al., 2006; Harmer et al., 2006; Nava and
González, 2006; Viramontes-Gamboa et al., 2007; Córdoba et al., 2008b; Nava et al.,
2008; Parker et al., 2008; Sasaki et al., 2009; Ghahremaninezhad et al., 2010; Sequeira and
Santos, 2010; Velázques-Yévenes et al., 2010).
Elemental sulfur (S8) has been identified as a common product of chalcopyrite dissolution
in both the ferric sulfate and ferric chloride solutions by means of X-ray diffraction (XRD), X-ray photoelectron spectroscopy (XPS), X-ray absorption spectroscopy (XAS), Raman spectroscopy (RS), scanning electron microscopy (SEM) coupled with energy dispersive spectrometry (EDS) and electron probe microanalyses (EPMA). The formation of sulfur on chalcopyrite in ferric sulfate media has been pointed out as the main cause for the slow and parabolic leaching rate (Linge, 1976; Muñoz et al., 1979; Dutrizac, 1981, 1989; Majima et al. 1985; Hirato et al., 1987a; Klauber, 2008). In contrast, for ferric chloride media, linear kinetics and formation of a porous elemental sulfur layer, throughout which soluble products and reactants can diffuse, have been reported (Jones and Peters, 1976; Ammou-Chokroum et al., 1979; Palmer et al., 1981; Majima et al., 1985; Hirato et al., 1986;
Dutrizac, 1978, 1989, 1990).
Regarding the metal-deficient sulfides (Cu1-xFe1-yS2-z), many authors have claimed that
these phases are formed on chalcopyrite during its dissolution in acidic media (Jones and
Peters, 1976; Linge, 1976; Ammou-Chokroum et al., 1979; Biegler and Swift, 1979;
Parker et al., 1981; Warren et al., 1982; Biegler and Horne, 1985; Price and Warren, 1986;
5
Nicol, 2003; Abraitis et al., 2004; Mikhlin et al., 2004; Nava and González, 2006; Parker
et al., 2008; Ghahremaninezhad et al., 2010). The formation of these intermediate phases, mainly demonstrated by the preferential leaching of Fe over Cu, formation of the anodic prewave during the electrochemical polarization of chalcopyrite electrodes, and also non-stoichiometric Cu/Fe ratio on oxidized surfaces, is often linked to the observed hindered dissolution effect: that is, the inhibition of the reaction progress. To the knowledge of the author no direct identification of these phases has been provided.
Covellite (CuS) has also been proposed as an intermediate product phase of chalcopyrite dissolution in acidic, oxidizing media, under atmospheric conditions (Ammou-Chokroum,
1979; Warren et al., 1982; Biegler and Horne, 1985; Nava and González, 2006; Córdoba et
al., 2008b; Ghahremaninezhad et al., 2010; Nicol et al., 2010; Velásquez-Yévenes et al.,
2010) on the basis of the preferential leaching of Fe over Cu, thermodynamic modeling and
electrochemical studies, mainly by cyclic voltammetry. This mineral phase was positively detected on oxidized chalcopyrite particles by using XRD and Mineral Liberation Analysis (MLA) (Córdoba et al., 2008b; Velásquez-Yévenes et al., 2010). CuS was also detected as an intermediate layer on chalcopyrite particles after bioleaching in acidic solution using Raman spectroscopy (Sasaki et al., 2009).
Among the efforts to improve chalcopyrite dissolution at low temperatures, the use of many catalysts has been quite investigated. Metallic copper (Cu) (Hiskey and Wadsworth,
1975) and gold (Au) (Lorenzen and Denventer, 1992); manganese dioxide (MnO2)
(Madhuchhanda et al., 2000); metallic ions such as bismuth (Bi3+) and mercury (Pb2+)
(Mateos et al., 1987; Gómez et al. 1997; Hiroyoshi et al., 2007) and mainly silver (Ag+)
(Miller and Portillo, 1979; Miller et al., 1981; Warren et al., 1984; Price and Warren, 1986;
Mateos et al., 1987; Osseo-Asare, 1993; Scaini et al., 1995; Hiroyoshi et al., 2002, 2007;
Parker et al., 2003; Nazari et al., 2011); chloride (Cl-) ions (Dutrizac, 1978, 1981, 1992; Palmer et al., 1981; Majima et al., 1985; Hirato et al., 1986, 1987; Lu et al., 2000a;
Carneiro and Leão, 2007; McDonald and Muir, 2007b); carbon particles (Wan et al., 1984;
Nakazawa et al., 1998; Liang et al., 2010); silver sulfide (Ag2S) (Mateos et al., 1987;
Scaini et al., 1995); and pyrite (FeS2) (Berry et al., 1978; Mehta and Murr, 1983; Nowak et
al., 1984; Abraitis et al., 2004; You et al., 2007; Dixon et al., 2008; Miller et al., 2008;
6 reaction kinetics promoting a different reaction mechanism. Nevertheless, the mechanisms by which the catalysts affect the chalcopyrite dissolution in both the sulfate and chloride media are not fully established.
In light of the above brief review, it becomes evident that considerable advances on the chalcopyrite dissolution mechanism have been made under atmospheric conditions by means of leaching and electrochemical methods and characterization techniques. However, the nature of the product layers, as well as the mechanisms by which they form and affect the leaching reaction are not fully understood, and neither are the details of the oxidative process in the presence of catalysts, such as pyrite. Since pyrite is a mineral phase often found in copper sulfide ores (Jensen and Bateman, 1981; Berry et al., 1983), the beneficial effects of this impurity phase on the dissolution rate of chalcopyrite has important practical implications for the leaching processes.
In this context, a better understanding of the chalcopyrite oxidation mechanisms under practical, low-temperature leaching conditions, represents a relevant contribution to copper hydrometallurgy, in view of the commercial and technological importance of this sulfide.
1.2. Objectives
A systematic investigation of the electrochemical oxidation of chalcopyrite coupled with a detailed study of chalcopyrite surface by using advanced characterization techniques will help to elucidate unclear issues on the nature of the product layers and their effects on the dissolution rate of this copper sulfide. A systematic investigation of the effects of pyrite on chalcopyrite electrochemistry under typical leaching conditions will help to elucidate the unclear issues on the mechanisms of copper extraction in the presence of this important natural catalyst.
7 (i) To evaluate the magnitude of the effect of pyrite on the electrochemical behavior of chalcopyrite under typical, low-temperature leaching conditions, that is, in the presence of ferric (Fe3+) ion and oxygen, with a method that better represents the association in the ore;
(ii) To investigate the nature and the role of the intermediate- and end-product phases that forms on chalcopyrite under anodic prewave conditions, which includes the typical potentials for the ferric ion leaching of copper ores (i.e., potential of about 0.7 V vs. SHE);
(iii) To establish the kinetics and mechanisms of chalcopyrite oxidation under anodic prewave conditions, by an in situ investigation of the mineral transition to crystalline and amorphous product phases.
For the first time, to the author’s knowledge, an investigation of chalcopyrite oxidation was conducted by ex situ synchrotron small angle X-ray diffraction (S-SAXRD), and in situ
synchrotron time-resolved X-ray diffraction (S-TRXRD); and the galvanic effect of pyrite on chalcopyrite oxidation was quantified by experimental approach that allowed a better assessment of the magnitude of the galvanic current. The findings of the present thesis are an original contribution to the current understanding on chalcopyrite oxidation in acidic media.
1.3. Thesis structure and organization
This thesis was organized in 6 chapters. Chapter 1 provides an introduction to the theme of this investigation and a critical summary of important works found in the literature.
8 In Chapter 3, the effects of pyrite inclusions, dissolved oxygen, and ferric ion on the electrochemistry of chalcopyrite was investigated by using potentiometry and linear sweep voltammetry.
In Chapter 4, chalcopyrite electrodes oxidized under anodic prewave conditions by means of chronoamperometry were analyzed by ex situ synchrotron small angle X-ray diffraction and Raman spectroscopy. The synchrotron measurements were conducted at the beamline XRD1, Brazilian Synchrotron Light Laboratory (LNLS) – Campinas, with the assistance of Prof. Rogério Magalhães Paniago, from the Department of Physics, UFMG.
In Chapter 5, an in situ investigation of chalcopyrite dissolution under anodic prewave conditions was conducted by means of synchrotron time-resolved X-ray diffraction. The measurements were conducted at the beamline 13-BM-C, Advanced Photon Source (APS) of the Argonne National Laboratory (ANL) – Chicago, U.S, with the assitance of Dr. Peter Eng, from the University of Chicago.
9
Chapter 2 – Literature review
2.1. Extractive metallurgy of copper
Different metallurgical routes are required to produce copper depending on the mineralogy of the deposit and metal content. Two main processing routes may be distinguished: the pyrometallurgical and the hydrometallurgical ones.
The copper ores typically treated by hydrometallurgy may be represented by the oxidized minerals such as oxides, carbonates, sulfates, hydroxy-silicates and hydroxy-chlorides, and chalcocite (Cu2S) in the presence of oxidants. Treatment of oxidized ores involves heap
leaching with sulfuric acid (H2SO4) as leaching solution, followed by solvent extraction,
and electrowinning (Davenport et al., 2002; Habashi, 1993).
Regarding the sulfides, the treatment of low-grade ores involves heap bioleaching, an option very well revised by Dreisinger (2006), Watling (2006) and Pradhan et al. (2008). Chalcocite and covellite are amenable to dissolve under heap bioleaching conditions, but the leaching kinetics of chalcopyrite is very slow and tends to decline with time, when assisted by mesophilic microorganisms. Several papers on chalcopyrite bioleaching with termophilic microorganisms or mixed cultures are available in the literature, and in spite of the promising results the processes continue in developmental stage.
Regarding the high-grade ores, these are mostly treated by pyrometallurgical processes, but the treatment at high pressure conditions has being used as well. About 80% of the total production of copper comes from the pyrometallurgical treatment of sulfide concentrates
(Bravo, 2006). It has dominated the copper industry since the 1800’s, but it is expected a
10
2.1.1. Hydrometallurgical processing of copper sulfide ores
Tab. II.1 and II.2 summarizes the hydrometallurgical alternatives for processing copper sulfide ores, especially chalcopyrite concentrates. It may be noticed that all the chloride- (Tab. II.1) and sulfate-based (Tab. II.2) processes include fine grinding and result in high copper leaching (≥ 95%). Ferric chloride (FeCl3) and cupric chloride (CuCl2) leaching
(Tab. II.1) has received a large attention, mainly as a result of the higher leaching rate and higher copper solubility (i.e., the formation of stable chloro-complexes) in chloride media
(Jones and Peters, 1976; Ammou-Chokroum et al., 1979; Dutrizac, 1981, 1990, 1992;
Majima et al. 1985; Hirato et al., 1986, 1987a; Winand, 1991; Senanayake and Muir, 2003;
Liddicoat and Dreisinger, 2007).
Negative aspects of the chloride-based hydrometallurgical processes are related to purity and morphology of the metal recovered and corrosion problems as well. In consequence, the progress of these processes toward commercial plants has been slow, in spite of the recognized effectiveness.
The sulfate-based processes (Tab. II.2) offer many advantages over the chloride-based processes, such as the lower costs; minimal corrosion problems; simpler copper recovery from the sulfate solutions by solvent extraction and electrowinning; and easier regeneration of the sulfuric acid during the electrowinning (Hackl et al., 1995; Davenport et al., 2002;
Dreisinger, 2006; Klauber, 2008). However, such processes present a critical disadvantage
that is the slow leaching kinetics, comparatively to that reported in chloride media (Jones and Peters, 1976; Dutrizac, 1978, 1981; Majima et al., 1985; Hirato et al., 1987b), as will be better discussed later.
11 Table II.1. Chloride-based processes for copper sulfide ores (Dutrizac, 1992; Wang, 2005; Liddicoat and Dreisinger, 2007).
Process Scale General characteristics
U.S. Bureau of Mines Mini plant Single-stage leach (FeCl3 solution; 105°C; 2 h);
Copper electrowinning directly from CuCl solution. Cyprus Metallurgical Processes Pilot plant Two-stage leach (FeCl3/CuCl2/NaCl solution; 98°C; 3 h);
Corporation (CYMET Process) Copper crystallization as CuCl and reduction with hydrogen gas (H2) at 500°C;
Melting of the product to produce copper.
Duval Corporation Pilot plant 1st stage leach: oxidation (FeCl3/CuCl2/NaCl/KCl solution; 105°C);
(CLEAR Process) Treatment of the pregnant solution with Cu powder and copper electrowinning;
2nd stage leach: leaching of the 1st stage leach residue (150°C; pO2 3 atm).
CUPREX Process Pilot plant Two-stage leach (FeCl3 solution; atmospheric conditions);
Selective CuCl2 extraction by solvent extraction and copper electrowinning.
Intec Limited Pilot plant Four-stage leach (BrCl2 solution; atmospheric conditions);
(INTEC Process) Precipitation of impurities and copper electrowinning from the CuCl2 solution.
Outokumpu HydroCopperTM Pilot Plant Single-stage leach (CuCl2/O2 solution; 80-100°C);
Process Purification of the CuCl solution with NaOH to precipitate Cu2O;
Cu2O is reduced with H2 to produce metallic copper.
Goethite / Hematite Bench Two-stage leach (FeCl3/CuCl2/O2 solution; 95°C; 3 h);
Process Copper extraction by solvent extraction and precipitation of FeOOH or Fe2O3;
Copper electrowinning from the sulfate solution.
12 Table II.2. Sulfate-based processes for copper sulfide ores (Dreisinger, 2006; Wang, 2005; McDonald and Muir, 2007a, 2007b).
Process Scale General characteristics
BacTech/Mintek Process Demonstration Bioleaching (stirred reactors; 25-55°C; pH 0.5-2.5; 30 days); plant Recovery of copper by solvent extraction and electrowinning.
BHP Billiton and Codelco Commercial Bioleaching (two stirred reactors; O2 bubbling; 60-90°C; pH 1.5-2.5; 10 days);
(BioCOPTM Process) Facility* Recovery of copper by solvent extraction and electrowinning. Albion Process Pilot plant Ultra-fine grinding/atmospheric cc leach (85°C; Fe3+ addition);
Recovery of copper by solvent extraction and electrowinning. Mt. Gordon Copper Process Commercial Pressure leach (90°C; pO2 8 atm; 1 h; Fe3+ addition) ;
facility Recovery of copper by solvent extraction and electrowinning.
ACTIVOX® Process Demonstration Ultra-fine grinding/pressure leach (90-110°C; pO2 10-12atm; Cu2+, Cl- additions);
plant Recovery of copper by solvent extraction and electrowinning.
Anglo/UBC Process Pilot plant Pressure leach (150°C; pO2 10-12 atm; 2 h; Fe3+, Cu2+, surfactants additions);
Recovery of copper by solvent extraction and electrowinning.
Cominco Engineering Services Demonstration Pressure leach (140-150°C; pO2 10-12 atm; pH 3; 2 h; Cu2+, Cl- additions) ;
Limited (CESL Process) plant Recovery of copper by solvent extraction and electrowinning. Dynatec Process Pilot plant Pressure leach (150°C; pO2 10-12 atm; coal as anti-agglomerant);
Recovery of copper by solvent extraction and electrowinning. Phelps Dodge-Placer Dome Commercial Pressure leach (200-230°C; pO2 30-40 atm);
and total POX Processes facility Recovery of copper by solvent extraction and electrowinning.
13
2.2. Chalcopyrite: Fundamental properties
2.2.1. Structure and bonding
The theoretical composition of chalcopyrite is 34.6% wt. Cu, 30.4% wt. Fe, and 35.0% wt. S. Chalcopyrite is recognized by its brass-yellow color and its greenish-black stripes. Its atomic weight is 183.5 g/mol and it has a hardness of 3.5 to 4.0 Mohs and density of 4.1 to 4.3 g/cm3 (Weast and Selby, 1968). Chalcopyrite has similar crystal structure to sphalerite (ZnS), however its unit cell is almost double the size of the ZnS cell (Rosso and Vaughan,
2006). Cu and Fe atoms replace Zn atoms according to the tetragonal space group I42d,
and the parameters of the crystal lattice are a = 5.25 Å and c = 10.32 Å (Lavrentyev et al., 2004). Fig. 2.1 illustrates the crystalline structure and atomic arrangement of chalcopyrite. It should be noticed that Cu and Fe atoms are in tetrahedral coordination with S and they are ordered into alternate cation sites. Each S atom is bonded to two Fe and two Cu atoms and there are not S-S bonds, such as in pyrite. Fe-S and Cu-S bond lengths are 2.26 Å and 2.33 Å, respectively (Gibbs et al., 2007), and the inter-atomic distances between the atoms are dCu-Fe = dCu-Cu = dFe-Fe = 3.71 Å (Edelbro et al., 2003).
Due to the complexity of its electronic structure and chemical bonding, there has been a debate in the literature regarding the valence states of Cu and Fe in chalcopyrite (Tossell et al., 1982; van der Laan et al., 1992; Li et al., 1994; Yin et al., 1995; Todd et al., 2003;
Mikhlin et al., 2004, 2005; Goh et al., 2006; Pearce et al., 2006). Evidences obtained by Mössbauer spectroscopy, X-ray photoelectron spectroscopy (XPS) and X-ray absorption near edge structure spectroscopy (XANES) supports the formal electronic configuration Cu+Fe3+S22- (Pearce et al., 2006). The authors concluded that Cu is nominally monovalent
14 Figure 2.1. CuFeS2: (a) Crystal structure and (b) Atomic arrangement. The yellow spheres
represent S atoms, while the blue and green spheres Cu and Fe atoms (Webmineral, 2010).
Several authors claim that the electronic structure and chemical bonds in chalcopyrite characterize its stability and physical properties, such as its electrical conductivity, and that is essential to consider these to understand the electrochemical reactions involved in the dissolution of this mineral, a semiconductor. The influence of electrical properties on the electrochemical behavior of sulfide minerals, such as CuFeS2, FeS2, ZnS and PbS has been
previously discussed (Biegler and Swift, 1979; McMillan et al., 1982; Crundwell, 1988; Mishra and Osseo-Asare, 1988; Osseo-Asare, 1992; Hiskey, 1993; Wei and Osseo-Asare,
1997). However, it is not of the authors’ knowledge that a full understanding on the effects of electronic structure and chemical bonds on copper extraction rate is currently available.
2.2.2. Semiconductor character
Chalcopyrite is a semiconductor material with a band gap of 0.5-0.6 eV and mean resistivity of 10-2-10-3 Ωm (Biegler and Swift, 1979; McMillan et al., 1982; Hiskey, 1993).
15 The conduction band edge of chalcopyrite is constituted by Fe 3d orbitals, while the valence band edge is Cu 3d and S 3p in character (Shuey, 1975). A simplified energy-band structure of chalcopyrite is shown in Fig. 2.2a. The highest occupied energy level is the filled Cu 3d 4t2g antibonding orbital and the lowest unoccupied is the Fe 3d 2eg antibonding
orbital (Vaughan and Tossell, 1983).
Figure 2.2. (a) Simplified energy-band diagram of chalcopyrite: Eg = band gap; Ev = upper
valence band edge; Ec = lower conduction band edge; and (b) Relative position of the
energy levels of common redox couples into solution (adapted of Crundwell, 1988).
The relative position of the energy levels of redox couples commonly found in leaching processes such as Cu2+/Cu+, Fe3+/Fe2+ and O2/H2O, in relation to the energy-band structure
of CuFeS2, is indicated in Fig. 2.2b. The position of each redox couple was obtained after
conversion of standard redox potentials (E) in units of electron volts (eV) (i.e., E(eV) = -E(V) - 4.5). The couples are usually depicted in terms of a single energy level, which is positioned equidistant of the energy level of the oxidant (Eoxi) and that of the reductant
(Ered). These energy levels are different, since they have different ionic charges and interact
Ev
Ec
Lower conduction
band
Fe 3d
Cu 3d S 3p
Upper valence
band Band gap
Cu2+ / Cu+ -4.7 eV
Fe3+ / Fe2+ -5.3 eV
O2 / H2O -5.7 eV
Ev
Ec
Lower conduction
band
Upper valence
band Eg (eV)
16 differently with the water dipoles. According to Osseo-Asare (1992), for charge transfer, the energy level of the aqueous species must fluctuate to the same energy as the conduction or valence band of the solid phase. The resulting alignment of these energy levels allows charge transfer to occur. The charge transfer may then be established by comparing the energy levels of the redox couples with the energy bands of the solid. If Eoxi is relatively
closer to Ec, the electron transfer from the conduction band is the favored pathway for
charge transfer. If Ered is closer to Ev, hole (h+) exchange with the valence band is the
preferred pathway. In addition, if Eoxi is closer to Ev, hole injection into the valence band of
the solid takes place. Using this approach, Parker et al. (1981) attributed faster chalcopyrite dissolution in the presence of Cu2+ ion, comparatively with Fe3+ ion, to a good overlap among the energy levels of the mineral conduction band and the corresponding couple (Cu2+/Cu+).
Biegler and Swift (1979) observed that the anodic oxidation of chalcopyrite in 1.0 mol/L
H2SO4 solution at high potentials (about 1.3 to 2.5 V vs. the Standard Hydrogen Electrode -
SHE) under atmospheric conditions is not affected by illumination, but the corresponding experimental evidences have not been provided in this paper. Under lighting, it is expected the creation of holes in the valence band of semiconducting minerals by photoexcitation. When a hole is created the electron originally residing in that bonding orbital is excited to an antibonding orbital in the conduction band, and this loss of bonding electron weakens the interaction among the adjacent atoms, thus favoring the oxidation reaction. Biegler and
Swift (1979) then concluded that the semiconducting character of chalcopyrite did not
affect its dissolution behavior. It may also be relevant to mention that the redox potential range investigated by them is very different from that found in practical leaching systems, as will be better discussed later.
Experiments conducted by Hiskey (1993) revealed that chalcopyrite typically displays n -type semiconduction due to the excess of metal cations (i.e., electron donor elements) in its structure and, therefore, electrons are the main charge carriers in this mineral. This author did not consider a hole dissolution pathway for this sulfide as well. On the contrary,
Crundwell (1988) proposed that the anodic oxidation of chalcopyrite takes place with a
17 of the Fe–S bonds and implies that Cu remains in the crystal lattice (Eq. 2.1). The second step would involve electron (Eq. 2.2) or hole transfer (Eq. 2.3), which represents the breaking of the Cu–S bonds. This mechanism involves the decomposition of an undetected, unstable radical intermediate (•CuS2) to covellite (CuS) (Eq. 2.4).
CuFeS2 + 3 h+ Fe3+ + •CuS2 (2.1)
•CuS2 Cu2+ + 2 S + 2 e- (2.2)
•CuS2 + 2 h+ Cu2+ + 2 S (2.3)
•CuS2 CuS + S (2.4)
It is evident from the few papers available in the literature that unresolved controversies exist concerning the mechanisms by which the semiconducting character of chalcopyrite affects its dissolution. The contribution of electrons and holes to the dissolution of this sulfide are still to be investigated.
2.2.3. Thermodynamic stability
It is well-known that the relative thermodynamic stability of metals and minerals into aqueous phase may be used to predict possible dissolution reactions. Garrels and Christ (1965) and Peters (1976) first investigated the thermodynamic stability of chalcopyrite by means of Pourbaix diagrams. Regularly named Eh-pH diagrams, the predominance areas of several species (neutral and ionic) are presented as a function of pH and redox potential scales. Information on the rate and mechanisms of the probable reactions are not provided by these diagrams.
18 In pH values lesser than 4, this reaction is favorable only at potentials higher than about 0.40 V vs. SHE (i.e., under oxidizing conditions). The equilibrium modeling calculated by
Garrels and Christ (1965) and Peters (1976) revealed that chalcopyrite dissolves under
oxidizing, non-oxidizing, and also reducing conditions, and that intermediate phases are expected to be formed.
According to calculations made by Garrels and Christ (1965) the oxidation of chalcopyrite may involve the formation of bornite (Cu5FeS4), covellite (CuS) and chalcocite (Cu2S),
sulfide phases with decreasing content in iron. Under non-oxidizing conditions (i.e., the dissolution by protonic attack), Cu5FeS4 and Cu2S may be formed, and under reducing
conditions, these same products may be formed.
Peters (1976) reported that the oxidation of this mineral may involve the formation of the
intermediates CuS and Cu2S, and also elemental sulfur (S). On the other hand, under
non-oxidizing conditions, CuS may be formed, while under reducing conditions, Cu5FeS4 and
Cu2S may be produced.
By means of the HSC Chemistry® (v.6) software (HSC Chemistry©, 2007), Pourbaix
diagrams were calculated for the Cu-Fe-S-H2O system under atmospheric conditions (Fig.
2.3). The exhibited simulation was carried out assuming the ideality condition (i.e., the activity coefficient is equal to 1). Only very acidic conditions (-1 pH 3) are represented here. It can be observed that Cu2+ extraction from CuFeS2 occurs at potentials higher than
about 0.40 V vs. SHE, a finding similar to those obtained by others. On the basis of thermodynamic, chalcopyrite oxidizes to bornite, covellite and chalcocite. It can be seen that the formation of cuprous oxide (Cu2O) was predicted at pH around 3 and, in addition,
that chalcopyrite oxidizes to ions such as bisulfate (HSO4-) and sulfate (SO42-) only at high
potentials.
19 Figure 2.3. Eh-pH diagram for the Cu-Fe-S-H2O system at 25°C: [S] = 0.1 mol/L; [Fe] =
[Cu] = 0.01 mol/L (HSC Chemistry®, version 6).
2.3. Chalcopyrite dissolution
There have been numerous investigations on the dissolution mechanisms of chalcopyrite under atmospheric conditions. The overall processes have being described by the following reactions:
CuFeS2 Cu2+ + Fe2+ + 2 S + 4 e- (2.5)
CuFeS2 + 8 H2O Cu2+ + Fe3+ + 2 SO42- + 16 H+ + 17 e- (2.6)
The mineral oxidation rate depends on the redox potential, and as discussed in the last section, at low pH, Cu2+ is expected to be leached from chalcopyrite at potentials larger than about 0.40 V vs. SHE. On the basis of standard redox potential values (Bockris and
Cu2+ + Fe3+ + HSO4
-Cu5FeS4 + Fe2+
Cu2+ + FeOOH + HSO4- Cu2+ + FeOOH + SO42-
Cu + Fe + H2S
Cu2+ + Fe2+ + HSO4
-Cu2+ + Fe2+ + SO4
2-Cu2O + FeOOH + SO42-
CuS + Fe2+
Cu2S + Fe2+
CuFeS2 + Fe2+
20
Reddy, 1998; Brett and Brett, 1998), e.g., chalcopyrite oxidation is expected to be more
favored in the presence of chlorine (Cl2) (+1.36 V vs. SHE) and oxygen (O2) (+1.23 V vs.
SHE) gases, and less favored in the presence of aqueous species as ferric (Fe3+) (+0.77 V
vs. SHE) and cupric (Cu2+) (+0.16 V vs. SHE) ions. However, this hypothesis has not been verified in practice. Peters (1986) observed that ferric ion gives faster sulfide dissolution comparatively with oxygen. The reactivity of these oxidants was also evaluated by
Osseo-Asare (1993), according to their electronic structure. The electron transfer between the
electron source (i.e., the highest occupied molecular orbital – HOMO) of the sulfide (S2-) and the electron receptor (i.e., the lowest unoccupied molecular orbital – LUMO) of the oxidant follows the order Cl2(g) > Cu2+(aq) > Fe3+(aq) > O2(g), trend which is consistent with
experimental evidences. This order of reactivity takes into account the availability of the unoccupied d orbitals, constraints on orbital overlap, and also the rearrangement of the electronic configurations.
In spite of this trend, ferric ion has being quite investigated to dissolve chalcopyrite, especially because it is a cheap oxidant and can be regenerated in the hydrometallurgical processes. The dissolution reactions are given by (Jones and Peters, 1976; Dutrizac, 1978; Muñoz et al., 1979):
CuFeS2 + 4 Fe3+ Cu2+ + 5 Fe2+ + 2 S (2.7)
CuFeS2 + 16 Fe3+ + 8 H2O Cu2+ + 17 Fe2+ + 2 SO42- + 16 H+ (2.8)
At low temperatures, ferric ion, either in sulfate or chloride media, attacks chalcopyrite slowly and incompletely. The copper leaching rate typically exhibits one of the three behaviors: parabolic, linear and parabolic-linear (Tab. II.3). For the parabolic shape, Cu2+ leaching rate becomes very slow, but it not actually stops. In the case of linear, a complete conversion (100% Cu2+ leaching) is expected, but this is not attained, except at extended reaction times. When the leaching rate exhibits the parabolic-linear behavior, an initial high leaching rate followed by a decreasing rate, followed by a linear increasing rate is observed. This behavior has been attributed to changes in the morphology of the product layer that develops on the mineral (Jones and Peters, 1976; Ammou-Chokroum et al.,
21
2008). It has been discussed that at the beginning, an elemental sulfur layer forms on
chalcopyrite and after growth it peels off, leaving a roughened surface. It causes an increase of the exposed surface area of chalcopyrite and, as a result, the mineral leaching rate becomes linear. Most of authors agree that chalcopyrite dissolution rate in ferric chloride media follows a linear behavior (Jones and Peters, 1976; Dutrizac, 1978, 1981; Palmer et al., 1981; Majima et al. 1985; Hirato et al., 1986; Al-Harahsheh et al., 2008), while in sulfate media it is better described by a parabolic pattern (Dutrizac, 1978, 1981;
Muñoz et al., 1979; Majima et al. 1985). This behavior has been often related with the
formation of product layers on the mineral, hindering the dissolution reaction. Tab. II.3 also indicates an agreement on the apparent activation energy, which varies from 46 to 69 kJ/mol in chloride, and from 63 to 84 kJ/mol in sulfate media. Based on these values, dissolution kinetics is less dependent on temperature in chloride solutions, and apparent activation energies are within the normal range for leaching processes controlled by reaction (i.e., Ea > 40 kJ/mol). It can be seen that in chloride media, chalcopyrite leaching rate has been considered to be under reaction control, and in sulfate media, it has been assumed to be limited by reaction or electron transfer through an elemental sulfur layer.
The main discrepancies observed in the literature for the leaching kinetics of chalcopyrite are possibly related to the nature of the chalcopyrite sample; the experimental conditions (i.e., oxidant concentration, reaction time and temperature range); and also the method used for calculating the rates. In chloride media, Cu2+ leaching rate is directly proportional to the oxidant concentration and a linear kinetics is reported (Jones and Peters, 1976; Ammou-Chokroum et al., 1977; Dutrizac, 1978; Palmer et al., 1981; Majima et al., 1985;
Hirato et al., 1986). A 0.3 (Ammou-Chokroum et al., 1977; Jones and Peters, 1976) and 0.5 reaction orders (Palmer et al., 1981; Majima et al., 1985; Hirato et al., 1986) with respect to the Fe3+ ion concentration have been obtained. Dutrizac (1978) found a 0.8 reaction order for synthetic samples and a 0.3 for natural samples. In sulfate solutions,
Dutrizac (1981) reported that the leaching rate depends on the Fe3+ ion concentration
below 0.01 mol Fe3+/L, but it is independent above this value. In agreement, Dutrizac
(1978) and Muñoz et al. (1979) found a zero reaction order with respect to the oxidant
22 Table II.3. Leaching kinetics of chalcopyrite in ferric sulfate and ferric chloride solutions: Curve shape, apparent activation energy (Ea, in
kJ/mol) and rate-determining step.
References Leaching conditions Curve Ea Rate-determining step
Jones and Peters, 1976 0.5 mol/L Fe2(SO4)3 - 0.2 mol/L H2SO4; 90°C L - Electrochemical reaction
1.0 mol/L FeCl3 - 0.2 mol/L HCl; 90°C L - Electrochemical reaction
Dutrizac, 1978* 0.05 mol/L Fe2(SO4)3 - 0.3 mol/L H2SO4; 50-100°C P 63 Chemical reaction
0.1 mol/L FeCl3 - 0.3 mol/L HCl; 50-100°C L 46 Chemical reaction
Ammou-Chokroum et al., 1979* FeCl3 - HCl (pH 0-3; 0.45-0.70 V SHE); 25-70°C P-L 29-42 Mixed control
Muñoz et al., 1979 0.25 mol/L Fe2(SO4)3 - 1.0 mol/L H2SO4; 60-90°C P 84 Electron transfer
Dutrizac, 1981 0.1 mol/L Fe2(SO4)3 - 0.3 mol/L H2SO4; 40-100°C P 75 Chemical reaction
0.2 mol/L FeCl3 - 0.3 mol/L HCl; 40-100°C L 63 Chemical reaction
Palmer et al., 1981 0.1 mol/L FeCl3 - 1.0 mol/L HCl; 75-96°C L 62 Electrochemical reaction
Majima et al., 1985 0.5 mol/L Fe2(SO4)3 - 0.2 mol/L H2SO4; 70°C P - -
1.0 mol/L FeCl3 - 0.2 mol/L HCl; 55-85°C L 69 Chemical reaction
Hirato et al., 1986 0.1 mol/L FeCl3 - 0.2 mol/L HCl; 52-85°C L 69 Electrochemical reaction
Hirato et al., 1987b 0.05 mol/L Fe2(SO4)3 - 0.2 mol/L H2SO4; 50-78°C P-L 77-88 Chemical reaction
Hackl et al., 1995 5 g/L Fe2(SO4)3 - 98 g/L H2SO4 - CuSO4; 110°C P-L - Mixed control
Maurice and Hawk, 1998 1.0 mol/L FeCl3 - 0.25 mol/L HCl; 60-90°C P-L 68 -
Al-Harahsheh et al., 2008 0.5 mol/L FeCl3 - 0.5 mol/L HCl; 70-90°C L 69 Chemical reaction
Córdoba et al., 2008b Fe2(SO4)3/FeSO4 - H2SO4 (pH 1.8; 0.60 V SHE); 35-68°C P-L 131 Chemical reaction