FUNDAÇÃO GETÚLIO VARGAS
ESCOLA DE ECONOMIA DE SÃO PAULO
FERNANDO CARVALHAES BARBI
TRÊS ENSAIOS SOBRE POLÍTICA MONETÁRIA E CRÉDITO
FERNANDO CARVALHAES BARBI
TRÊS ENSAIOS SOBRE POLÍTICA MONETÁRIA E CRÉDITO
Tese defendida à Escola de Economia
de São Paulo da Fundação Getúlio
Vargas, como requisito para obtenção
do título de Doutor em Economia.
Orientador: Prof. Dr. Pedro Luiz Valls
Pereira
Carvalhaes Barbi, Fernando..
Três Ensaios Sobre Política Monetária e Crédito / Fernando Carvalhaes
Barbi. - 2014.
130 f.
Orientador: Pedro Luiz Valls Pereira
Tese (doutorado) - Escola de Economia de São Paulo.
1. Política monetária - Brasil. 2. Crédito bancário - Brasil. 3. Mercados
emergentes. 4. Crédito público - Brasil. 5. Teoria bayesiana de decisão
estatística. 6. Previsão econômica. 7. Indicadores econômicos - Brasil. I.
Valls Pereira, Pedro Luiz. II. Tese (doutorado) - Escola de Economia de São
Paulo. III. Título.
DEDICATÓRIA
FERNANDO CARVALHAES BARBI
TRÊS ENSAIOS SOBRE POLÍTICA MONETÁRIA E CRÉDITO
Tese defendida à Escola de Economia de
São Paulo da Fundação Getúlio Vargas,
como requisito para obtenção do título de
Doutor em Economia.
Orientador: Prof. Dr. Pedro Luiz Valls
Pereira
Data de defesa: 08/04/2014, às 14 horas
Banca examinadora:
__________________________________
Prof. Dr. Pedro Luiz Valls Pereira
EESP FGV
__________________________________
Prof. Dr. Paulo Picchetti
EESP FGV
__________________________________
Prof. Dr. Emerson Fernandes Marçal
EESP FGV
__________________________________
Prof. Dr. Eurilton Alves Araújo Júnior
BCB
__________________________________
Prof. Dr. Hedibert Freitas Lopes
AGRADECIMENTOS
Agradeço à professora Maria Carolina da Silva Leme que me apresentou à
Macroeconomia.
Agradeço ao meu orientador, professor
Pedro Luiz Valls Pereira, pelas excelentes aulas,
orientação e atenção.
Agradeço aos membros da banca de qualificação, professores Alkimar Ribeiro Moura e
Emerson Fernandes Marçal pelas valiosas sugestões.
Agradeço aos professores Paulo Picchetti, Márcio Holland de Brito e Rogério Mori que
foram fonte constante de grande inspiração para meu trabalho.
Agradeço aos demais membros da banca examinadora, professores Eurilton Alves
Araújo Júnior e Hedibert Freitas Lopes, pela participação e comentários.
Agradeço ao professor Emerson Fernandes Marçal com quem tive o privilégio de
trabalhar no CEMAP.
Agradeço ao Secretário Márcio Holland de Brito pela oportunidade de trabalhar no
Ministério da Fazenda.
Agradeço ao Dr. André Minella pela experiência profissional que generosamente me
transmitiu quando trabalhei no Ministério da Fazenda.
Agradeço ao professor Yoshiaki Nakano, Diretor da EESP, que me proporcionou um
ambiente rico para aprender Economia e debater os problemas do Brasil.
Agradeço aos amigos Marcos Rocha, Wagner Monteiro e Denísio Liberato com quem
tive a felicidade de conviver trabalhar.
ABSTRACT
In the first essay, "Determinants of Credit Expansion in Brazil", analyzes the
determinants of credit using an extensive bank level panel dataset. Brazilian economy
has experienced a major boost in leverage in the first decade of 2000 as a result of a set
factors ranging from macroeconomic stability to the abundant liquidity in international
financial markets before 2008 and a set of deliberate decisions taken by President Lula's
to expand credit, boost consumption and gain political support from the lower social
strata. As relevant conclusions to our investigation we verify that: credit expansion
relied on the reduction of the monetary policy rate, international financial markets are
an important source of funds, payroll-guaranteed credit and investment grade status
affected positively credit supply. We were not able to confirm the importance of
financial inclusion efforts. The importance of financial sector sanity indicators of credit
conditions cannot be underestimated. These results raise questions over the
sustainability of this expansion process and financial stability in the future.
The second essay, “
Public Credit, Monetary Policy and Financial Stability
”, discusses
the role of public credit. The supply of public credit in Brazil has successfully served to
relaunch the economy after the Lehman-Brothers demise. It was later transformed into a
driver for economic growth as well as a regulation device to force private banks to
reduce interest rates. We argue that the use of public funds to finance economic growth
has three important drawbacks: it generates inflation, induces higher loan rates and may
induce financial instability. An additional effect is the prevention of market credit
solutions. This study contributes to the understanding of the costs and benefits of credit
as a fiscal policy tool.
This paper uses Bayesian forecasting methods to predict short-term interest rates. We
take two different approaches: from a theoretic perspective we focus on an augmented
version of the Taylor rule and include the Real Exchange Rate, the Credit-to-GDP and
the Net Public Debt-to-GDP ratios. We also take an
“
atheoretic
”
approach based on the
Expectations Theory of the Term Structure to model short-term interest. The selection
of priors is particularly relevant for predictive accuracy yet, ideally, forecasting models
should require as little a priori expert insight as possible. We present recent
developments in prior selection, in particular we propose the use of hierarchical hyper-g
priors for better forecasting in a framework that can be easily extended to other key
macroeconomic indicators.
RESUMO
O primeiro ensaio, "Determinantes da expansão do crédito no Brasil", analisa os
determinantes do crédito usando um extenso conjunto de dados em painel sobre o
sistema bancário. A economia brasileira teve um grande impulso na alavancagem na
primeira década de 2000 como resultado de um conjunto de fatores que vão desde a
estabilidade macroeconômica passando pela liquidez abundante nos mercados
financeiros internacionais antes de 2008 até um conjunto de decisões deliberadas
tomadas pelo presidente Lula para expandir o crédito, impulsionar o consumo e obter
apoio político das camadas sociais mais baixas. Como conclusões verificamos que a
expansão do crédito beneficiou-se da redução da taxa de juros, os mercados financeiros
internacionais são uma fonte importante de recursos, o crédito garantido em folha de
pagamento e o grau de investimento afetaram positivamente a oferta de crédito. Nós não
fomos capazes de confirmar a importância dos esforços de inclusão financeira. A
importância dos indicadores de sanidade do setor financeiro de condições de crédito não
pode ser subestimada. Estes resultados levantam questões quanto à sustentabilidade
desse processo de expansão e estabilidade financeira no futuro.
O segundo ensaio, "Crédito Público, Política Monetária e Estabilidade Financeira",
discute o papel do crédito público. A oferta de crédito público no Brasil serviu para
relançar a economia após a crise desencadeada pela quebra do banco Lehman-Brothers.
Mais tarde, ele foi transformado em um motor de crescimento econômico bem como
num dispositivo de regulação para forçar os bancos privados a reduzir as taxas de juros.
Argumenta-se que a utilização de fundos públicos para financiar o crescimento
econômico tem três desvantagens importantes: ele gera inflação, induz taxas de
financiamento mais elevadas e pode induzir à instabilidade financeira. Um efeito
adicional é impedir o desenvolvimento de soluções de crédito de mercado.
regra de Taylor. Também testamos uma abordagem baseada na teoria das expectativas
da estrutura a termo cauva de juros para modelar os juros de curto prazo. A seleção dos
priores é particularmente relevante para a precisão da previsão, no entanto deseja-se
usar prior robustas a falta de conhecimento prévio. Apresentamos os recentes
desenvolvimentos na seleção de priors, em especial, propomos o uso de priors
hierárquicas da família de distribuição hiper-geométrica.
SUMÁRIO
Determinants of Credit Expansion in Brazil
12
Public Credit, Monetary Policy and Financial Stability
54
Determinants of Credit Expansion in Brazil
Fernando C. Barbi
∗S˜ao Paulo School of Economics (FGV)
March 17, 2014
Abstract
This paper analyzes the determinants of credit using an extensive bank level panel dataset. Brazilian economy has experienced a major boost in leverage in the first decade of 2000 as a result of a set factors ranging from macroeconomic stability to the abundant liquidity in international financial markets before 2008 and a set of deliberate decisions taken by President Lula’s to expand credit, boost consumption and gain political support from the lower social strata. As relevant conclusions to our investigation we verify that: credit expansion relied on the reduction of the monetary policy rate, international financial markets are an impor-tant source of funds, payroll-guaranteed credit and investment grade status affected positively credit supply. We were not able to confirm the importance of financial inclusion efforts. The importance of financial sector sanity indicators of credit conditions cannot be underestimated. These results raise questions over the sustainability of this expansion process and financial stability in the future.
keywords bank credit, public credit, emerging markets, financial stability JEL E44, G18, G21, H81
1
Introduction
During the presidential campaign in 2002, concern was raised about the future conduction of economic policy should the candidate from the leftist party, Luis In´acio Lula da Silva (Lula), be elected. Just a few months before election, Lula proposed in an open letter1
that the main priority of his administration, besides respecting contracts and keeping inflation under control, would be to reduce external vulnerabilities by creating a strong domestic market2 based on consumption. By catering to macroeconomic stability granting the central bank ade facto autonomy and by closing the social inequality gap with social transfer programs and an aggressive policy of real minimum salary appreciation, Lula created the political and economic conditions to radically reduce poverty and build an emerging middle class that would guarantee his reelection in 2006 (Hunter and Power (2007)) and keep being his loyal electoral base from 2010 on. Singer (2012) suggests that since 2010 Brazil lives a “New Deal atmosphere” born out of how the 2008 crisis was tackled.
The expansion of domestic demand was based on a set of political decisions that created the conditions for economic growth. According to Lima and Ferreira (2012) “credit expansion is a deliberate outcome of Lula’s government economic policy”3
. Ricci (2006), Souza and Lamounier (2010) and Singer (2012) concur that Lula’s vision is based on: (a) the expansion of formal employment, (b) real increases to minimum wage and (c) the expansion of public and private supply of credit. These three economic policy directions are complemented with a series of microeconomic reforms in credit market rules and regulations that allow for the expansion of credit supply at reduced rates. It is not possible to understand the continuous expansion of the economy between 2003 and 2008 without a correct perception of the determinants of credit expansion.
Before the 2007/8 credit crunch crisis, economists paid little attention to credit and the financial markets frictions that might affect output. Both academia and policymakers focused
1
“Carta ao Provo Brasileiro” was signed on June 22, 2002, at the beginning of the presidential campaign. 2
“O desenvolvimento de nosso imenso mercado pode revitalizar e impulsionar o conjunto da economia, ampliando de forma decisiva o espa¸co da pequena e da microempresa, oferecendo ainda bases s´olidas para ampliar as exporta¸c˜oes. (. . . ) [A]cima de tudo, vamos fazer um Compromisso pela Produ¸c˜ao, pelo emprego e por justi¸ca social.”
3
their attention to other more pressing topics: on the macro level, the monetary policy research agenda was dominated by inflation control mechanisms and on the micro level, market regula-tion was neglected as most believed that markets could self regulate themselves more efficiently than government agencies. The 2007/8 crisis showed that financial intermediation matters for macroeconomic stability. As Blanchard (2010) puts it, “the crisis has made clear that poli-cymakers have to watch many targets, including the composition of output, the behavior of asset prices and the leverage of different agents”. Brazil went through deep changes in the financial market. Before inflation control brought by Plan Real in 1994, the Brazilian banking system made most of its profit from rolling government’s debt. After the taming of inflation, the banking sector underwent severe concentration and sanitization4
processes as the surviving institutions reoriented their business models to increase lending to firms and households. Lima and Ferreira (2012) offer a detailed view of the financial system privatization period from 1996 to 2001 and the contraction in the number of public banks as state banks were closed or sold. The few remaining public banks stayed under federal control.
The surviving private institutions learned to profit from credit but as a considerable chunk of the consumers worked in informal activities, personal credit lagged behind as households had a hard time producing collaterals. Macroeconomic stability brought a new wave of investments and some social transfer programs tentatively implemented were raising average income while preparing the ground for the growth years that characterize the Lula Administration. Besides that, an increasing formalization rate in labor relations was key to pave the way for the credit expansion that would later happen.
Figure 1: Interest rates, actual and expected inflation trajectories
%
2000 2002 2004 2006 2008 2010
5
10
15
20
25
inflation (ipca)
monetary policy rate (selic) inflation target (tcpi)
bonanza” to characterize the conjunction of easy foreign financing and the high terms of trade for Latin American commodity exporter countries.
Brazil was granted investment grade status in 2008, first by Standard & Poor’s and later by Fitch. Moody’s followed and also conferred it in 2009. This contributed to the inflow of funds supplementing the need for resources as domestic savings are not enough to sustain investment. As a side effect the Real appreciated and the competitiveness of the manufactured sector declined.
The Brazilian economy experienced a major boost in leverage from 2001 to 2010 (figure 2) as total credit expanded from 26.8% of GDP in 2001 to 48% in 2010. This movement is mainly credited to macroeconomic stability but also to institutional reforms that reduced the cost of credit for both households and firms. We briefly mention the new funding facility FIDC5 created as a source of new funding for smaller banks. New payroll backed credit legislation
5
Figure 2: Expansion of Credit relative to GDP
%
2000 2002 2004 2006 2008 2010
10
20
30
40
total credit/gdp private credit/gdp public credit/gdp
(“cr´edito consignado”) was passed by the end of President Lula’s first year in power. In the beginning of 2005, bankruptcy legislation (“Lei de Falˆencias”) was passed in Congress that would speed up the capture of debtors assets.
Brazil has gone through some profound changes in the last decade that explain the expan-sion of the credit market. On the supply side, a series of structural microeconomic reforms increased property rights of creditors and created a market for credit portfolios that would increase the recycling of liquidity. Some four events must be mentioned: the first reform was the creation of FIDC. This financial instrument was created to allow small and medium banks to generate funds by selling their credit portfolios.
A second innovation was payroll-backed loans legislation6
passed in 2003 that allowed lenders to automatically deduce principal and interest payments directly from the credit takers’ payroll: this credit modality is the single most important source of credit for individuals today. A third reform is the new bankruptcy legislation passed in 2005 to facilitate the recovery of
Figure 3: Evolution of Credit for Households and Firms
million R$
2000 2002 2004 2006 2008 2010
1e+05
2e+05
3e+05
4e+05
5e+05
credit to households credit to corporations
assets by creditors.
As a result, the stock of credit for individuals reached the same levels of credit to corpora-tions (Figure 3) while spreads for these two categories converged by the end of 2010 (Figure 4).
On the demand side, a steady increase in real wages (figure 5), including minimal wages, a steady decrease of unemployment and a series of social transfer programs were adopted as government policy to reduce social inequalities and increase consumption from the lower social classes. At the same time that the population got better educated: comparing PNAD7
results from 1992 to 2007 the percentage of workers with 11 or more years of education went from 18.40% in 1992 to 39.6% in 2007. The lower end also showed improvements as illiteracy rate reduced from 17.2% in 1992 to 9.6% in 2009 considering all the population above 15 years old. As more educated workers are more productive, education improvement suggests that real wage is increasing in for workers in general.
7
Figure 4: Spreads for Corporations x Individuals (%)
%
2000 2002 2004 2006 2008 2010
20
30
40
50
60 spread for corporations %
spread for individuals %
The official employment report (RAIS8
) shows that during the Lula Administration some 15 millions formal jobs were created (in both private and public sectors) for a total of 44 million people regularly employed. Formal employment was a priority to ensure economic growth. Special attention was dedicated to labor intensive sectors such as construction and small businesses. Fiscal stimulus in the form of payroll taxes rebates were offered to companies to keep employees and the result is that formal employment reached historical full employment rates.
Figure 5: Evolution of formal employment and real wages
%
2000 2002 2004 2006 2008 2010
6
8
10
12
unemployment real wages
conferred it in 2009. This contributed to the inflow of funds supplementing the need for resources as domestic savings are beneath the necessary level to sustain investment. This inflow complements another one originated in a terms-of-trade shock in commodities prices since 2003 (Figure 6). As Brazil is a big exporter of metals and food commodities, a side effect to these inflows is the appreciation of the domestic currency.
All these micro and macroeconomic changes conflate to explain the expansion of the credit market that changed the face of consumption and investment even at the high levels of interest rates practiced by the BCB. This work is unique in the large sample of banks considered and the degree of details provided by data retrieved in the accounting records. It makes two contributions. The first is to perform intervention analysis to test a series of events that may explain temporary and permanent shocks to the domestic credit market. These events are credit ensured by payroll legislation, the achievement of investment grade, Lehman’s demise, Lula’s candidacy for Presidency and his first year in government.
Figure 6: REER and Metal Commodities Prices
%
2000 2002 2004 2006 2008 2010
50
100
150
200
REER R$/U$
Index of Metal Commodities Prices (RBA)
expansion and macroeconomic variables such as GDP, industrial production, unemployment, inflation, exchange rate and minimum wage. Minimum wage is not generally used in the literature but in Brazil it has added relevance because it is not only an indicator of wage costs but also a key index for social security transfers to pension recipients. Hunter and Power (2007) further explain that “[M]ost Brazilian salaries are in some way linked to the minimum wage as a unit of reference, so increases in the minimum wage have a ripple effect in consumer spending and throughout the economy.”
participation of the elder in population income, given the aging of the population”. Hunter and Power (2007) concur: “[T]he real increase in the purchasing power of the minimum wage was approximately 23 percent in Lulas first term. This, combined with cash injections from the poverty-reducing income transfer program, the Bolsa Fam´ılia, has had a palpable effect on the local economies of smaller and less developed municipalities, which depend heavily on small-scale personal spending for their livelihood.” Programa Bolsa Fam´ılia (PBF) is the most visible social transfer program. In 2003 it transferred some R$ 570 million, in 2006 this grew up to R$ 7.5 billion. In 2010 the program received R$ 13.46 billion, some 0.4% of GDP, to support more than 13.5 million families.
This paper is organized in five sections besides this introduction. The second part presents the credit channel and offers a brief literature review to conclude with some pending questions that this work will investigate. The third part is a list of empirical models to be tested. The fourth part presents and discusses empirical results, while the last part concludes.
2
Literature review
The very existence of the banking system is based on the concept of liquidity provisioning. Banks recycle liquidity by taking deposits and turning them into loans. The principle of Delegated Monitoring (Diamond (1984)) states that monitoring of credit takers is made more efficiently by banks. According to Calomiris and Kahn (1991) depositors do not have to monitor banks as long as they may credibly threaten bankers with liquidation at any time. Bankers have incentives to act prudently to keep in business. They have to face maturity mismatch concerns as their assets (loans) usually have longer maturities then their liabilities (deposits) so whenever they anticipate delinquency upheavals they influence the supply of credit to ensure their good reputation. This is why the structure of the banking system is a concern for policymakers: the medium may distort the message9
.
There is an extensive literature on how interest rate shocks propagate to the real economy through the credit channel. Most of it shows how lenders influence the contraction process by
9
redirecting credit to more reliable firms (“flight to quality”) or simply by reducing the supply of credit (credit rationing). We briefly review some of the more relevant results in credit literature to contextualize our research.
Stigliz and Weiss (1981) credit rationing model explains the adverse selection process in the credit market that happens when interest rates increase: as the more trustworthy customers leave for cheaper financing source only the credit takers less likely to repay remain. To avoid the deterioration of the borrower profile, banks ration credit to the most risky projects in order to preserve their profit margins.
The Kyiotaki and Moore (1997) credit model argues that as only part of production can be collateralized, the lending allocation is suboptimal: constraints imposed on creditors on their capacity to recuperate assets from borrowers make them lend less than socially desirable. The paper emphasizes the importance of institutions to protect lenders as a mean to increase economic surplus.
Bernanke, Gertler and Gilchrist (1996) propose the concept of Financial Accelerator that is at the heart of the broad credit channel by exposing the dynamics of a contractionary shock that spreads through corporate balance-sheets when collateral assets lose value. Credit constrained firms reduce investments and soon the product will be negatively affected in a process that will drag all the economy down. As lenders perceive big companies as more reliable to repay, more transparent and cheaper to monitor, with smaller information gathering/agency costs, they turn their resources to these borrowers and reduce credit to riskier, smaller firms, in a process the authors call ‘flight to quality’.
Kashiap and Stein (2000) verify that the impact of monetary policy in terms of lending behavior is stronger in banks with less liquid balance sheets, the smaller banks that have less deposits to fund its loan operation. As noted by Cetorelli (2008) “the key Kashiap and Stein insight is that monetary policy influences lending activity by altering the sensitivity of lending to balance sheet health”.
author reaches two major conclusions: while pass-through is faster to corporate loans, it is higher for retail (personal) loans in the long-run. The paper also observes higher loan rates and interest spreads in banks with large market shares, a phenomenon that could be explained by the market power hypothesis stated by Berger (1995). This is rather unexpected since bigger banks face lower funding costs and would imply important differences in the composition of bank spread according to bank size. Also relevant to our analysis is the fact that corporate loans are more sensitive to bank related variables (size and funding inefficiency being the most relevant factors) than retail rates that are more sensitive to the monetary policy rate (selic), its volatility and market structure (higher concentration leading to higher spreads). The author conjectures that this might be caused by higher competition in the corporate loan market. Finally the debt maturity of also affects the pass-through effect: the shorter the maturity the fastest is the transmission of movements in the MPR to loan rates. This is of special relevance since the majority of outstanding credit has short maturity. The author analyzed data from the Brazilian credit market and showed that the long run coefficients of bank loan interest rates are heavily linked to market structure (concentration), seconded by their own volatility, to default rate and finally to the MPR at a much lower degree. These results pave our choices for macroeconomic indicators as discussed in the next section.
The monetary policy rate is a key component of the cost of credit that it influences twice: directly as the opportunity cost of creditors and indirectly by affecting credit spread. Koyama et al. (2008) decompose the banking spread into six components: loan default costs, opera-tional costs, reserve requirements, taxes, cross subsidies in credit lines and the cost of deposit insurance. This insight leads us to consider in our dataset the provision to bad debt as a proxy for precautionary behavior.
while small and medium sized banks lost deposits at rates of 11% and 23% respectively. The authors present the series of measures taken by the BCB to supply liquidity to the market in 2008/2009 with special attention to the smaller institutions. In this context, the reserve requirements were relaxed but bigger banks could only access these funds to purchase credit portfolios from the smaller banks. This measure was seen as an orderly way of supplying liquidity to smaller institutions as direct access to the BCB refinance lines is usually shrouded in stigma. The authors also observe that the situation was critical since the short maturity of funding could jeopardize banks already facing liquidity mismatchs. The solution was the creation of a new deposit securitization mechanism, DPGE10
,to allow smaller institutions access to funding through time deposits.
On the supply side of credit, Calani et al. (2010) document the importance of credit stan-dards in the supply of credit. According to data obtained by surveying senior loan officers in Chile, the authors verify that the most relevant factors to explain commercial credit de-mand in Chile are: (1) the cost of credit, (2) the MPR (an important component of the cost of credit) and (3) the expansion of the economy. On the supply side, the authors show the overwhelming importance of nonperforming loans distantly followed by the cost of credit as the major determining factors.
Tabak et al. (2010) bring three relevant results as they empirically verified that “during pe-riods of loosening/tightening monetary policy, banks increase/decrease their loans. Moreover, our results illustrate that large, well-capitalized and liquid banks absorb better the effects of monetary policy shocks. We also find that low interest rates lead to an increase in credit risk exposure, supporting the existence of a risk-taking channel”. These results are important as they give some clues about the sources of vulnerability the Brazilian financial sector maybe exposed to. First, MPR is distorted and delayed by an important part of the banking system (small and medium banks) that usually represent the key funding source for small and medium companies. Besides, these results also suggest that some sort of financial vulnerability may be building up inside banks that are taking increasingly more risk.
Gambacorta and Marques-Ibanez (2011) verify that important changes happened to the
10
monetary policy transmission mechanism after 2008. According to the authors, traditional bank-specific characteristics (size, liquidity and capitalization) have lost relevance to explain the bank lending channel while short-term funding and securitization became more important. They suggest these changes could be permanent and not a mere reflection of the thigh credit markets. The authors support the need for closer coordination between monetary policies and financial stability requirements.
Guo and Stepanyan (2011) study a panel dataset of emerging economies before and after the 2008 crisis and conclude that “foreign capital is a mixed blessing for credit growth in EMEs. Countries that relied more heavily on foreign borrowing to finance domestic credit, notably some European EMEs, in general experienced the largest swings of credit growth before and after the crisis, while countries that relied less on foreign borrowing, e.g. EMEs in Latin America and Asia, fared much better during the crisis. Given the volatility of capital flows to EMEs, a banking sector that is dependent on foreign capital for funding may prove vulnerable to external shocks and could also be prone to boom-bust cycles. Therefore, macro-prudential policies should be particularly vigilant to foreign-capital fueled credit booms, which could reverse course very quickly. (...) Building a robust domestic deposit base could be a key for sustained and stable credit growth. As is evident from our analysis, countries that experienced little or no deceleration of credit growth during the crisis were all supported by relatively robust/stable domestic deposit growth.”
3
The models
A number of studies of credit treat the identification of supply and demand determinants to explain the credit level. We take a different approach. From the banks perspective, we first explore the different bank funding channels that lead to the stock of liquid assets available for credit operations. We study the determinants of the four main channels of resources: cash deposits, time deposits, interbank and foreign lending. The second step is to relate these channels to the pool of liquid resources (netfunds) and a set of macroeconomic and control variables. In the last step we model the flow of loans from this pool of liquid resources in relation to key macroeconomic variables. By taking this approach we separate the two processes: fund gathering and credit concession.
We use a board definition of credit, encompassing both free and channeled (earmarked) credit. This is done to simplify the analysis as the scope of this paper is not concerned with the allocation of resources between the different credit channels. This methodological note is due here since in Brazil a significant share of credit is earmarked . The most relevant earmarked credit for our discussion probably is destined to the construction sector as it generates a significant demand for low-qualified workforce. Notably the popular housing program “Minha Casa Minha Vida” received the major part of resources available in the PAC stimulus package. Lundberg (2011) further elaborates on the different destinations of earmarked credit, that also contemplate resources to finance agricultural production and infra-structure long-term investments.
As the first contribution of this work is to unwind the funding channels for credit expansion, we propose a simple credit model, we then analyze each component to understand the basic relations between these components and macroeconomic variables. The basic model is derived from the accounting rule that equates assets (loans) to liabilities primarily in the form of debt:
Loansit =Capitalit+Depositsit+Interbankit+F oreignit+N P Lit+ǫit
was also studied but empirical tests did not result fruitful for our analysis and we will later suggest a possible explanation. We model each of these sources to test which factor(s) are determinant for the allocation of resources to be lent by the banks. All models control for bank characteristics (size, liquidity and capital) and the short-term interest rate (selic).
Model 1 relates minimum wage (minwage) and price stability (measured by the inflation index ipca) to cash - highly liquid - deposits. We expect that cash deposits maintain a positive relation with minimum wage and with price levels:
f undsourceit=SLCit+selict+minwaget+ipcat+ǫit
where SLC stands for size, liquidity and capital.
Model 2 relates economic activity indicators such as GDP, industrial production (indprod) and unemployment (unemp) to funding: we expect that a higher activity generates more funding, while a lower unemployment rate guarantees a higher volume of resources, salaries, deposited at the banks:
f undsourceit=SLCit+selict+gdpt+indprodt+unempt+ǫit
Model 3 takes the foreign funding perspective and relates rear exchange rate (rer), libor and fed funds rates. We expect to see a positive relation between the internalization of foreign funds and the domestic currency appreciation. We expect that this flow increases as risk-free rates abroad plunge: libor is tied to funds coming from Europe while Fed Funds rate relates to US originated funds:
f undsourceit =SLCit+selict+rert+libort+f edf undst+ǫit
as capital is already controlled for there is no need to include another regressor that would present a strong collinearity with an already existing regressor:
f undsourceit =SLCit+nplit+provisionsit+leverageit+selict+ǫit
In this context leverage is the loanstock/assets ratio that indicates a propensity to lend (and take risks) of the financial institution.
A last remark is that funding is not perfectly related to the amount available since there are some monetary policy tools, such as reserve requirements and capital requirements, that affect each funding category differently according to central bank policies. To isolate the effect of these different rates, we also observe an aggregate measure of liquid assets that will be directly available to be lent. This indicator (netfunds) is modeled with the different sources of funding so we may have an idea of how relevant each funding source actually. The results are presented in table 7 and will be analyzed in the next section.
Model estimation is done using as much as possible bank level data to build a panel dataset. Models are estimated with a fixed effects framework with robust estimators. As an instrument for credit demand we consider industrial production, as did Tabak et al. (2010), and the external funding channel. We assume that the supply of credit was severely impacted by the liquidity restrictions imposed on foreign lenders.
smaller banks in July 2003 and the new payroll backed credit legislation was passed by the end of Lulas first year in power. In the beginning of 2005, a new bankruptcy legislation was passed in Congress that would speed up of creditors assets. It is still unclear whether the piece of legislation reached its full potential as the Justice system is still plagued with the same old issues. In 2007, the Bear Stearns filing for bankruptcy is another relevant event that is controlled for. The investment grade status granted by three credit agencies (S&P, Fitch and Moodys) in 2008/2009 are treated as three different events. The final event is Lehman Brothers demise in September 2008.
Traditionally the banking sector is studied under three perspectives: by institution size, nationality and ownership. The size cleavage is justified by difference in access to funds. The big banks have an extensive number of branches where they can collect funds, either free (cash deposits) or remunerated (time deposits). They also have international outreach for funding either by debt or by equity (bank notes). The small and medium-sized banks either recur to borrowing from the bigger institutions or to sale of their credit portfolios to the big banks. We do not enforce this cleavage in our analysis since our focus is in the relation of the financial system as a whole with and macroeconomic variables.
In Brazil banks are not allowed to issue commercial papers (with the notable exception of their leasing affiliates). Their key funding sources are deposits: cash, time and savings. Debt is the second best source of funds and it exists in three forms: (a) big banks contract credit abroad, (b) big banks lend to smaller ones and (c) all banks negotiate in the interbank market. The interbank market is mainly used for short-period financing as the interest rate is high and closely follows the short-term interest rate defined by the Central Bank. One key measure is the reduction of this basic interest rate as, we will see, it affects cash deposits, the main source of funds for banks.
4
Data and Results
regressors. We also detail the four dummies related to institutional breaks (investgrade, pay-roll) and time events (lehman, lula) that might affect credit supply and/or demand. Models are estimated with a fixed effects framework with robust estimators. All models were estimated with year dummies and constants (results omitted).
Table 1 and 2 presents the sources of data and the descriptive statistics of the regressors and is divided in two parts: the top part presents panel data available for each bank, while the lower part brings the time series data that was incorporated in the panel. For the 11 years in the sample, from 2000 to 2010, we observe data twice a year, in June and December, when banks consolidate balance sheets. The choice is conditioned by the availability of loan information that started in 2000. The end of the sample coincides with the end of Lula’s presidency as we focus on getting a clear picture of the Lula Administration (2003-2010). President Dilma (2011-2014) later continued the economic policies started by President Lula (notably the steady reduction of short-term interest rates) and deepened credit policy by increasing positively the supply of credit by public banks11
.
To understand the equilibrium between supply and demand it would be good to have data on the quantity as well as about the price of credit. Quantity data is at hand in great detail (by financial institution) but unfortunately there is no available data on the particular interest rate each institution offered. The existing data is in aggregated format and we decided not to use it since the relation to the specific bank characteristics is lost.
We do not study the determinants of domestic raised equity but as this funding source composes the liquid funds in the banks, we take them into account as an aggregate when we analyze liquid assets (table 8). The accounting data on foreign funding encompasses all funds obtained in foreign currencies such as equities and bonds sold abroad. Table 6 shows that these funding sources can not be overlooked.
but the key concept is that the system as a whole relies on external funding to supply credit domestically. The risk of foreign borrowing raised by Guo and Stepanyan (2011) was such a concern that the whole apparatus of Brazilian public banks was mobilized to smooth the impact of the 2008 Lehman financial shockwave (Barbi (2013). Needless to remember that all the exchange rate depreciation risk is bore by the banks, leaving them vulnerable to exchange rate volatility. We may suppose that one reason for the Brazilian central bank to manage a dirty float exchange rate regime is to prevent shocks to the financial system.
A final word about two financial inclusion indicators: the number of bank accounts opened per year (depbank) and the number of credit cards (ccard) activated per year. These data are available in yearly basis so we replicate the observation for the June and December records of each year.
(depbank) as well as the number of credit cards (ccard) activated per year. Results were not significant and were omitted.
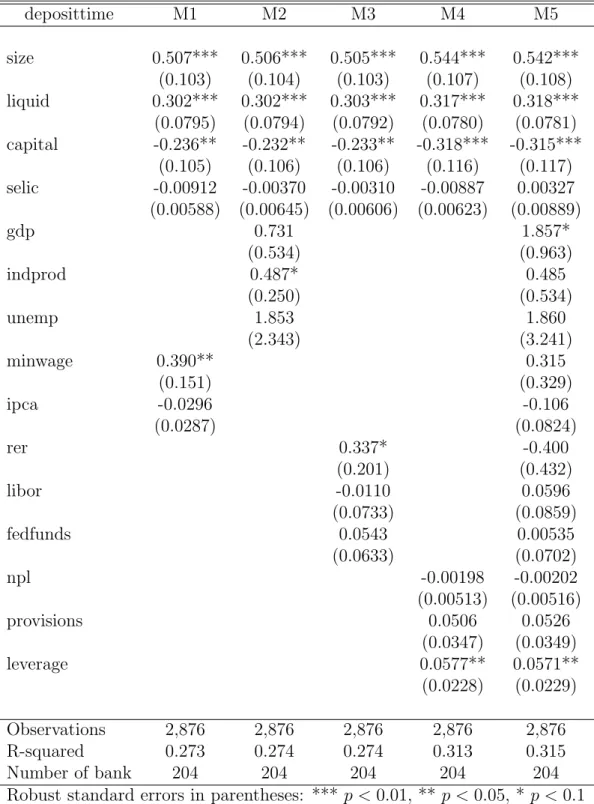
Table 4 presents the conditioning of time (remunerated) deposits. Banks with more assets and more liquid positions perform better in capturing these deposits. It must be noted that these deposits are not generally ensured by government or the FGC (“Fundo Garantidor de Cr´edito”). The interesting result is a robust negative relation with capital that can be explained by considering that smaller banks, with lower capital, pay a premium to sell their certificates of deposit in the market. As these small and medium sized banks do not have an extensive network of agencies and have little or no access to international financial markets, they are likely to have recourse to this source of funding. Also noteworthy is the lack of statistical relevance of the level of short-term interest rate (selic). Although all coefficients are negative, they are not statistically significant. If they were significant, we might explain that as investors are risk averse, when government bonds yield more (selic rises), time deposits fall. Another surprising results is that average investor in bank certificates may not be concerned with bank risks, as long as the institution has a solid asset position, this is why NPL and provisions are not relevant but size and liquidity are. As a bank lends more it needs more funds so the leverage coefficient is positive and significant. A final note is the positive relation of GDP in model 5: although expected it is not robust.
A conspicuously absent analysis is about the determinants of savings deposits (“cadernetas de poupan¸ca”). We tested different models including whether minimum wage could somehow explain these deposits. It so happens that it does not explain savings, suggesting that the average saver is not remunerated in terms of this wage indicator. We may expect that recipients of low wages do consume all of their income and the savings mechanism is used by higher income depositors.
higher the short-term rate, the less able are the banks to finance themselves with time deposits as discussed above, so banks are more likely to access the interbank market in scenarios of high short-term interest rates. Some authors also suggest that the credit takers in this market are generally middle or small-size banks, while the lenders are the big national institutions. The positive leverage coefficient in models 4 and 5 suggest that banks with higher leverage (here defined as the ratio of loans to assets) tend to access this source of funds. Who might be the credit takers? As the industrial production coefficient is significant and positively related to interbank credit, as indicated in models 2 and 5, we may infer that banks participate in this market to get resources to lend to corporations . The industrial production index indicates the level of activity in the industrial sector, proxying corporate credit needs. As the financing horizon is basically on the short term (after all there are other much cheaper sources of funds of one can spare some time to get them) the resources obtained on this market will probably feed some short-term corporate credit lines (such as hot money) to avoid maturity mismatches. The fact that the coefficient for the real exchange rate is positive in models 3 and 5 suggest some relation with international trade activities. As the coefficient for GDP in model 2 is significant but not robust as occurs with the coefficients of libor m model 3 and ipca in model 1, we will not interpret these results further.
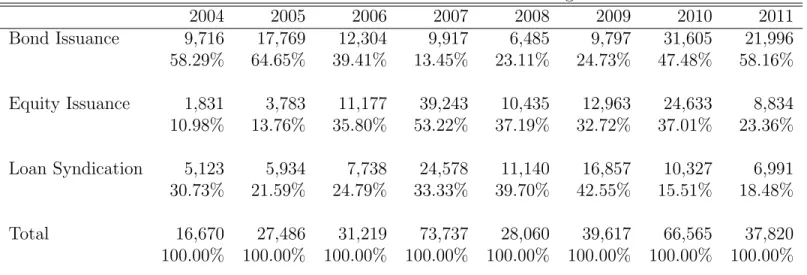
Table 6 presents some statistics of the composition of external funding considering all forms of funding: bond, equity and loan syndication. The overall amounts went from US$ 16.7 billion in 2004 up to U$ 73.7 billion in 2007. Bonds are the preferred instruments, representing from 13% in 2007 up to 58% in 2011 of the total inflow of resources. This distribution elicits the investors preference for security.
credit supply but these results are only marginally significant. Some might argue that we should control for some form of bank credit rating. We believe that the risk-related regressors included in the models (NPL, provisions and leverage) convey the necessary information to foreign lenders besides the banks balance-sheets as indicated by the positive coefficients for size, liquidity and capital in all five models. The interesting fact to note is the signs for NPL and provisions: a negative coefficient for provisions and positive coefficient for NPL suggesting that banks increase risky-taking the more they rely on foreign funds. The sign for leverage is positive as expected (more leverage requires more funds). When we estimate a first difference version of this model (omitted results) the only significant coefficients are related to size and leverage, both with the same signs of the presented models.
depbank and ccard. Results were again not significant and were omitted to save space. Finally tables 9 and 10 present the determinants of loans, in levels and first differences. The results are basically the same. The amount of assets is positively related to the capacity to supply credit. Liquidity is reduced by the concession of loans in models 1 and 4. Capital is positively related to loans in models 2 and 3, as expected: the level of capital is a binding constraint to lending. Surprisingly the interest rate is not significant in any model. This has a sad interpretation as suggested by Figure 4: the average spread rate for non-earmarked funds is so much higher than the short-term rate (MPR) that the final price of credit actually is more dependent on the level of default (NPL) faced by financial institutions. An increase in the MPR should be very large to generate the desired effects in reducing the level of economic activity. The two hikes in the MPR in 2005 and 2008 were sizeable, 5% and 3% respectively, and effective in reducing actual inflation (ipca) as can be seen in figure 1.
The negative relation between credit supply and NPL is well documented in the literature, see Alencar (2011) and Alfaro et al. (2004). This results concurs with Calomiris and Powell (2000) that studied the banking system in Argentina, they explain that “market discipline encourages banks to respond to increases in default risk by limiting asset risk or lowering leverage”. The positive coefficient for provisions only suggests a precautionary attitude as the volume of NPL is expected to increase in absolute terms. If screening is well conducted, and standards for credit concession are not softened as reported by Calani et al. (2010), the proportion of NPL to loans should keep stable as indicates table 11. The positive relation with netfunds is expected, since these constitute the resource pool to originate the loans. The coefficient of industrial production is positive, as more production begets demand for corporate credit, while the negative coefficient of unemployment suggests that employment level affects the demand for loans by individuals for the reasons already discussed.
The separation in netfunds (table 8) and loanstock (tables 9 and 10) is not only didactic but also performs the important task of separating the process of fund acquisition to the decision of credit concession. The intervention variables were not significant in the loanstock regressions but were relevant to explain the origin of funds.
issued the credit. In this case the coefficient for netfunds would be biased and not consistent. To test this hypothesis, we propose to instrument netfunds in the regression using as the variables liquid, capital and unemployment. In table 12 model 1 indicates that these variables are not significant to explain loanstock but are significant to explain netfunds (model 2). We instrument (Schaffer (2005)) netfunds in the loanstock regression in model 3. With this setup, it is difficult to understand how netfunds is not related to loanstock as indicated in model 3. We suspect of sample heterogeneity so we split the sample among public and private institutions. Model 4 indicates that loanstock is correlated to size, netfunds, npl and provisions for private banks, while model 5 shows that loanstock is correlated to netfunds, gdp, npl e provisions in public banks. The fact that coefficients for netfunds have different signs in models 4 and 5 suggests that the effects were compensating each other and rendering the coefficient too small to be significant in model 3. All the other results from model 3 are confirmed in models 4 and 5 so they are considered robust.
Model 5 also suggests that public bank credit is positively related to gdp. Some might expect a negative coefficient to indicate that public credit is counter-cyclical but this would be a wrong interpretation, the correct test would require a crisis dummy to test whether public credit is pro or counter-cyclical in bad times. The counter-cyclical result is confirmed in Barbi (2013).
An interesting result is the negative relation of netfunds to loanstock in the public sector, while being positive in the private sector as expected. As the source of financing is not a constraint for public banks, they are not limited by their liquid funds and the more aggressively they participate in the market, the more depleted are their stock of liquid funds. The coefficient for the private banks (0.168) is well below the one suggested in models 5 of table 9 (0.639) and table 10 (0.413) suggesting that the previous estimations were indeed biased but consistent.
5
Conclusions
As the first important conclusion to our investigation we verify the importance in the reduction of the monetary policy rate (selic) to assure the supply of credit. Figure 1 shows that this processes started in 2000 and continued through the years only to be temporarily interrupted to deter inflation spikes. The overall picture is that there exists a firm long-term commitment to both inflation control and economic growth.
We also verified the statistical relevance of both the payroll guaranteed legislation and investment-grade status were relevant microeconomic shocks to explain the credit expansion. Payroll guaranteed legislation is a good example of the microeconomic reform agenda that should be carried away further to improve public governance.
Finally the importance of sanity indicators of credit conditions (NPL, provisions and lever-age) cannot be overstated. The IMF 2012 Financial System Stability Assessment for Brazil states that “Despite considerable progress in recent years, capital market development re-mains constrained by the low duration and high interest rate environment. Further progress will take time and be contingent upon maintaining a stable macro-financial environment, but could be spurred by financial sector reforms, including providing incentives for longer duration and infrastructure investments, as well as refocusing BNDES to support private long-term fi-nance.” The case for the reduction of the public banking sector is further made in Barbi (2013) where the author also discusses the possible nefarious implications for financial stability of the expanding public credit.
Appendix.COSIF accounts
Loans stock is the sum of accounts 14300002, 16100004, 16200007, 16300000, 16400003, 16500006, 16600009, 16700002, 16800005, 16910005, 16995006, 17100003, 17300009, 17500005, 17700001, 17800004, 17910004, 17920001, 17995005, 18100002, 18275009, 18278006, 18820007, 18600007, 18835009, 18875007, 18878004, 18880009, 18910003, 18995004, 23200007, 24180009, 24199801, minus the accounts 14399006, 18880205, 49206009, 49207008, 49214008, 49217005, 49236000, 49248005, 49285006, 49908008, 49909007.
Non Performing Loans (NPL) is the sum of accounts 31600008, 31700001, 31800004, 31900007. These are the credit operations more than 90 days due and classified under levels E, F, G and H.
Loan Loss Provisions (provisions) is the sum of accounts 16900008, 17900007 e 18900006.
Bank Size is Total Assets as reported in account 39999993.
Bank Capital is the account 61100004.
References
Alfaro,R., Franken, H., Garcia, C., Jara, A. 2004. “The Bank Lending Channel in Chile”. Banco Central de Chile.
Alencar, L.S. 2011. “Revisiting Bank Pricing Policies in Brazil: evidence from loan and deposit markets”. BCB Working Paper 235. March 2011.
Barbi, F.C. 2013. “Public Credit, Monetary Policy and Financial Stability”. EESP FGV. PhD Thesis.
Berger, A. 1995. “The profit structure relationship in banking: Tests of market-power and efficient-structure hypotheses.” Journal of Money, Credit and Banking, 27, 404-431.
Bernanke, B., Gertler, M., Gilchrist, S. 1996. “The Financial Accelerator and the Flight to Quality,” The Review of Economics and Statistics, Vol. 78, No. 1. (Feb., 1996), pp. 1-15.
Blanchard, O., DellAriccia, G., Mauro, P. 2010. “Rethinking Macroeconomic Policy”. IMF Staff Position Note. SPN/10/03. February 2010.
Calani, M., Garcia, P. Oda, D. 2010. “Supply and Demand Identification in the Credit Market”. Central Bank of Chile Working Papers No.571. April 2010.
Calomiris, C.W., Kahn, C.M. 1991. ”The Role of Demandable Debt in Structuring Optimal Banking Arrangements,” American Economic Review, American Economic Ass., vol. 81(3), pages 497-513, June.
Calomiris, C.W., Powell, A. 2000. “Can Emerging Market Bank Regulators Establish Credible Discipline? The Case of Argentina, 1992-1999,” NBER Working Paper No. 7715. May 2000
Cetorelli, N, Goldberg, L.S. 2008. “Banking Globalization, Monetary Transmission, and the Lending Channel”. NBER Working Paper No. 14101. June 2008.
Diamond, D.W. 1984. “Financial Intermediation and Delegated Monitoring,” Review of Eco-nomic Studies, Wiley Blackwell, vol. 51(3), pages 393-414, July.
Eyzaguirre, N., Kaufman, M.,Phillips,S., Vald´es, R. 2011. “Managing Abundance to Avoid a Bust in Latin America.” IMF Staff Discussion Note SDN/11/07
Gambacorta, L., Marques-Ibanez, D. 2011. “The new bank lending channel: lessons from the crisis”. BIS Working Papers 345. May 2011.
Guo,K, Stepanyan,V. 2011. “Determinants of Bank Credit in Emerging Market Economies,” IMF Working Papers 11/51, International Monetary Fund.
Hunter, W. and Power, T. J. (2007), “Rewarding Lula: Executive Power, Social Policy, and the Brazilian Elections of 2006”. Latin American Politics and Society, 49: 1-30.
Jim´enez,G., Ongena,S., Peydr´o,J.L. and Saurina, J. 2012a “Credit Supply Versus Demand: Bank and Firm Balance-Sheet Channels in Good and Crisis Times”. EBC Discussion Paper No. 2012-003.
Jim´enez,G., Ongena,S., Peydr´o,J.L. and Saurina,J. 2012b. “Credit Supply and Monetary Pol-icy: Identifying the Bank Balance-Sheet Channel with Loan Applications”. AER 102(5) (p.2301-26)
Kashiap,A., Stein, J. 2000. “What Do a Million Observations on Banks Say About the Trans-mission of Monetary Policy?,” American Economic Review, 90(3), pp. 407/28. 2000
Kyiotaki,N., Moore,R. 1997. “Credit Cycles” Journal of Political Economy, 1997, vol.105, no.2
Koyama,S. Annibal,C., Lunberg,E., Bader,F., Takeda, T. 2008. “Decomposi¸c˜ao do Spread Ban-crio e Apresenta¸c˜ao da Nova Metodologia”. Banco Central do Brasil. Relat´orio de Economia Bancria 2008.
Lundberg, E.L. 2011. “Bancos Oficiais e Cr´edito Direcionado o que diferencia o mercado de cr´edito brasileiro ?”. Banco Central do Brasil Working paper 258.
Mesquita, M., Tor´os, M. 2010. “Considera¸c˜oes sobre a Atua¸c˜ao do Banco Central do Brasil na Crise de 2008. BCB Working Papers
Mori, R., Holland, M., 2010. “Respostas `a crise financeira de 2008 de uma perspectiva brasileira,” Textos para discuss˜ao 249, Escola de Economia de S˜ao Paulo, Get´ulio Vargas Foundation (Brazil).
Neri, M.C. (Org.) 2010. “A Nova Classe M´edia: O Lado Brilhante dos Pobres”. Rio de Janeiro: FGV/CPS, 2010.
Ricci, R. 2006. “Lulismo: trˆes discursos e um estilo”, In revista Lutas Sociais 15/16, S˜ao Paulo: NEILS/PUC.
Schaffer, M.E. 2005. “XTIVREG2: Stata module to perform extended IV/2SLS, GMM and AC/HAC, LIML and k-class regression for panel data models,” Stat Soft Comp. Boston College Dept of Economics.
Singer, A. 2012. “Os Sentidos do Lulismo: Reforma Gradual e Pacto Conservador”. Companhia das Letras, S˜ao Paulo.
Souza, A., Lamounier, N. 2010. “A Classe M´edia Brasileira: ambi¸c˜oes, valores e projetos de sociedade”. Rio de Janeiro. Elsevier Editora Ltda.
Stiglitz,J.E., Weiss,A. 1981. “Credit Rationing in Markets with Imperfect Information”. The American Economic Review, Volume 71, Issue 3 (Jun., 1981)
Table 1: Data Sources
Regressor Description Source
capital bank capital COSIF
cash cash holdings COSIF
depositcash cash deposits COSIF
deposittime time deposits COSIF
extfund external (foreign) funds COSIF interbank funds exhanged in the Interbank market COSIF
liquid liquid assets COSIF
loanstock loan protfolio COSIF
netfunds net funding COSIF
npl non performant loans (loans due past 90 days) COSIF provisions provisions for bad credit COSIF
size total assets COSIF
fedfunds Official interest rate United States BCB 18152 gdp GDP monthly - current prices (R$ mil.) BCB 4380 ccard Number of new credit cards activated DSPV deflator Implicit deflator BCB 1211 depbank Bank deposit accounts (in thousands) DSPV ipca Broad National CPI (IPCA) Monthly % var. BCB 433 libor Interest on deposits in LIBOR US$ (3 months) BCB 3840 indprod Industrial Production Index (2002=100) BCB 13609 minwage Minimum wage (annual) BCB 1619 reer Real eff.exch.rate index (IPCA) Jun/94=101 BCB 11752 rer Real exch.rate index (IPCA) Jun/94=100 BCB 11753 selic Interest rate (annual) - % p.y. BCB 4189 unemp Open unemployment rate (metropolitan region) BCB10777
Table 2: Descriptive Statistics
Variable Obs Mean Std.Dev Min Max Bank level data
capital 4693 18.4377 1.7082 14.5075 24.8637 cash 3174 11.4543 4.0534 1.0280 22.8866 depositcash 3099 15.5580 3.4155 0.0262 24.7266 deposittime 3404 18.5297 2.5784 4.0985 26.2636 foreign 2255 18.5659 2.5178 1.9676 24.5004 interbank 3086 14.9389 3.8726 1.2907 26.1188 leverage* 4024 86.5301 7.4169 22.7285 96.6262 liquid 4692 19.0602 2.4669 8.1497 26.7195 loanstock 4024 19.1499 2.5527 3.9722 26.6950 netfunds 4680 19.9056 2.1038 10.9475 27.0999 npl 4024 9.1211 16.5084 0.0000 100.0000 provisions 3995 15.9433 2.7971 3.5056 23.6515 size 4693 21.8553 2.4946 14.9501 29.5379
Time series (common to all banks)
ccard 11 11.1428 0.6074 10.2888 12.0750 depbank 11 11.4680 0.2507 11.0612 11.8584 fedfunds 22 2.3739 2.1705 0.0000 6.5000 gdp 22 11.6239 0.1252 11.4246 11.8764 indprod 22 4.6808 0.1191 4.4554 4.9049 ipca 22 0.4791 0.4579 -0.2100 2.1000 libor 22 2.6187 2.1689 0.0000 6.7900 minwage 22 5.7342 0.4275 5.0173 6.4329 rer 22 1.0457 0.2385 0.6529 1.5045 selic 22 15.0984 4.4268 8.3900 26.0900 unemp 22 4.6952 0.0180 4.6568 4.7274
Table 3: Sources of Funding: Cash Deposits
depositcash M1 M2 M3 M4 M5
size 0.452*** 0.449*** 0.453*** 0.429*** 0.423*** (0.128) (0.128) (0.128) (0.143) (0.143) liquid 0.174* 0.174* 0.173* 0.203** 0.203** (0.101) (0.102) (0.101) (0.0932) (0.0940) capital -0.115 -0.121 -0.114 -0.187 -0.196
(0.126) (0.127) (0.126) (0.118) (0.119) selic -0.0289*** -0.0200* -0.0271*** -0.0246*** -0.0136 (0.00930) (0.0119) (0.0101) (0.00936) (0.0144)
gdp 0.728 0.336
(0.664) (1.179)
indprod -0.0140 0.221
(0.508) (0.794)
unemp -3.170 -5.405
(3.649) (5.198)
minwage 0.0681 -0.602
(0.212) (0.476)
ipca 0.0633 0.00493
(0.0522) (0.0937)
rer 0.613* 0.247
(0.330) (0.582)
libor 0.0582 -0.0224
(0.123) (0.135)
fedfunds -0.108 -0.0216
(0.116) (0.121)
npl -0.00299 -0.00298
(0.00618) (0.00614)
provisions 0.126** 0.128**
(0.0498) (0.0496)
leverage 0.0473* 0.0469*
(0.0248) (0.0248)
Table 4: Sources of Funding: Time Deposits
deposittime M1 M2 M3 M4 M5
size 0.507*** 0.506*** 0.505*** 0.544*** 0.542*** (0.103) (0.104) (0.103) (0.107) (0.108) liquid 0.302*** 0.302*** 0.303*** 0.317*** 0.318***
(0.0795) (0.0794) (0.0792) (0.0780) (0.0781) capital -0.236** -0.232** -0.233** -0.318*** -0.315***
(0.105) (0.106) (0.106) (0.116) (0.117) selic -0.00912 -0.00370 -0.00310 -0.00887 0.00327 (0.00588) (0.00645) (0.00606) (0.00623) (0.00889)
gdp 0.731 1.857*
(0.534) (0.963)
indprod 0.487* 0.485
(0.250) (0.534)
unemp 1.853 1.860
(2.343) (3.241)
minwage 0.390** 0.315
(0.151) (0.329)
ipca -0.0296 -0.106
(0.0287) (0.0824)
rer 0.337* -0.400
(0.201) (0.432)
libor -0.0110 0.0596
(0.0733) (0.0859)
fedfunds 0.0543 0.00535
(0.0633) (0.0702)
npl -0.00198 -0.00202
(0.00513) (0.00516)
provisions 0.0506 0.0526
(0.0347) (0.0349)
leverage 0.0577** 0.0571**
(0.0228) (0.0229)
Table 5: Sources of Funding: Interbank Funding
interbank M1 M2 M3 M4 M5
size 0.574*** 0.578*** 0.571*** 0.543*** 0.550*** (0.143) (0.144) (0.143) (0.149) (0.150) liquid 0.0984 0.0951 0.0966 0.130 0.128
(0.0943) (0.0950) (0.0944) (0.0934) (0.0946) capital 0.0137 0.0367 0.0183 -0.0835 -0.0589
(0.145) (0.145) (0.145) (0.151) (0.150) selic 0.0304** 0.0376** 0.0496*** 0.0343*** 0.0421**
(0.0133) (0.0157) (0.0143) (0.0132) (0.0175)
gdp -3.246*** -2.981*
(1.006) (1.724)
indprod 2.938*** 2.817***
(0.715) (1.036)
unemp -5.725 -3.072
(5.961) (8.495)
ipca -0.199** 0.0282
(0.0896) (0.132)
rer 0.636 0.750
(0.477) (0.772)
libor 0.374** 0.309
(0.173) (0.246)
fedfunds -0.121 -0.295
(0.156) (0.207)
npl -0.00388 -0.00394
(0.00500) (0.00506)
provisions 0.0795 0.0801
(0.0662) (0.0669)
leverage 0.0652*** 0.0643***
(0.0217) (0.0217)
Table 6: Brazilian Banks External Financing
2004 2005 2006 2007 2008 2009 2010 2011
Bond Issuance 9,716 17,769 12,304 9,917 6,485 9,797 31,605 21,996 58.29% 64.65% 39.41% 13.45% 23.11% 24.73% 47.48% 58.16%
Equity Issuance 1,831 3,783 11,177 39,243 10,435 12,963 24,633 8,834 10.98% 13.76% 35.80% 53.22% 37.19% 32.72% 37.01% 23.36%
Loan Syndication 5,123 5,934 7,738 24,578 11,140 16,857 10,327 6,991 30.73% 21.59% 24.79% 33.33% 39.70% 42.55% 15.51% 18.48%
Total 16,670 27,486 31,219 73,737 28,060 39,617 66,565 37,820
100.00% 100.00% 100.00% 100.00% 100.00% 100.00% 100.00% 100.00%
IMF Global Financial Stability Report 2009, 2012 (In millions of U.S. dollars)
Table 7: Sources of Funding: Foreign Funding
foreign M1 M2 M3 M4 M5
size 0.470*** 0.469*** 0.470*** 0.734*** 0.739*** (0.102) (0.102) (0.102) (0.103) (0.104) liquid 0.201*** 0.198*** 0.197*** 0.173*** 0.169***
(0.0683) (0.0688) (0.0687) (0.0625) (0.0632) capital 0.500*** 0.494*** 0.496*** 0.300** 0.299** (0.145) (0.147) (0.146) (0.138) (0.140) selic 0.00677 -0.00599 0.00245 0.0116 -0.00959
(0.0103) (0.0119) (0.0105) (0.0101) (0.0162)
gdp -0.914 -0.734
(0.975) (1.647)
indprod -0.917** -1.945*
(0.421) (0.986)
unemp 0.447 6.856
(4.152) (5.216)
ipca -0.0504 0.0698
(0.0429) (0.135)
rer -0.480 0.0940
(0.354) (0.692)
libor 0.148 0.0105
(0.138) (0.124)
fedfunds -0.122 0.0772
(0.111) (0.0992)
npl 0.0116** 0.0117**
(0.00500) (0.00506)
provisions -0.0664** -0.0704**
(0.0300) (0.0299)
leverage 0.138*** 0.139***
(0.0246) (0.0247)
Table 8: Banks Net Funding
netfunds M1 M2 M3 M4
size 0.195*** 0.177*** 0.172*** 0.147*** (0.0464) (0.0432) (0.0428) (0.0407) liquid 0.234*** 0.218*** 0.210*** 0.193*** (0.0468) (0.0510) (0.0492) (0.0453) capital 0.334*** 0.336*** 0.331*** 0.299*** (0.0446) (0.0444) (0.0450) (0.0434) selic -0.00234 -0.00117 -0.00162 -0.00130 (0.00420) (0.00403) (0.00387) (0.00383) depositcash 0.0488*** 0.0452*** 0.0401*** 0.0376*** (0.0140) (0.0132) (0.0129) (0.0118) deposittime 0.0512 0.0492 0.0525* (0.0336) (0.0336) (0.0315)
interbank 0.0206** 0.0209**
(0.00956) (0.00899)
foreign 0.0606***
(0.0141) lehman 0.0138 0.0108 0.0263 0.00415 (0.0285) (0.0281) (0.0308) (0.0302) lula 0.0390 0.0285 0.0203 0.0114
(0.0482) (0.0454) (0.0455) (0.0436) payroll 0.0256 0.0261 0.0323 0.0544
(0.0529) (0.0521) (0.0530) (0.0498) investgrade 0.239*** 0.219*** 0.217*** 0.231*** (0.0630) (0.0665) (0.0655) (0.0650)
Observations 1,394 1,394 1,394 1,394 R-squared 0.749 0.757 0.760 0.779 Number of bank 126 126 126 126
Table 9: Loans (Levels)
loanstock M1 M2 M3 M4 M5
size 0.373*** 0.798*** 0.798*** 0.367*** 0.166** (0.115) (0.102) (0.102) (0.0790) (0.0715) liquid -0.247*** -0.0814* -0.0815* -0.0120 -0.114***
(0.0434) (0.0488) (0.0488) (0.0300) (0.0323) capital -0.144 0.183** 0.184** 0.0690 -0.107*
(0.0907) (0.0854) (0.0857) (0.0631) (0.0611) selic -0.000696 -0.00119 0.00126 -0.00209 0.00521 (0.00580) (0.00590) (0.00628) (0.00309) (0.00394)
gdp -0.160 0.237
(0.240) (0.264)
indprod 0.298 0.479***
(0.181) (0.181)
unemp -1.983 -1.132
(1.404) (1.513)
netfunds 1.108*** 0.639***
(0.149) (0.0820)
rer 0.146 -0.0241
(0.125) (0.142)
npl -0.0322*** -0.0291***
(0.00337) (0.00336)
provisions 0.495*** 0.444***
(0.0624) (0.0604)
Table 10: Loans (First Differences)
D.loanstock M1 M2 M3 M4 M5
D.size 0.236*** 0.354*** 0.349*** 0.239*** 0.152*** (0.0655) (0.0693) (0.0702) (0.0418) (0.0387) D.liquid -0.0831*** -0.0287** -0.0293** -0.0102 -0.0521***
(0.0204) (0.0144) (0.0143) (0.0117) (0.0163) D.capital -0.0337 0.0949 0.0777 0.0665 -0.0454
(0.0768) (0.0662) (0.0667) (0.0491) (0.0560) D.selic -0.00393 -0.00553 -7.44e-05 -0.00353 0.00875**
(0.00363) (0.00353) (0.00389) (0.00273) (0.00355)
D.gdp 0.512** 0.719***
(0.209) (0.201)
D.indprod 0.139 0.432***
(0.110) (0.128)
D.unemp -1.466 -1.582*
(1.257) (0.949)
D.netfunds 0.546*** 0.413***
(0.0769) (0.0586)
D.rer 0.00356 -0.277**
(0.0865) (0.109)
D.npl -0.0187*** -0.0181***
(0.00275) (0.00281)
D.provisions 0.283*** 0.270***
(0.0429) (0.0424)
Observations 3,251 3,251 3,251 3,231 3,231 R-squared 0.177 0.102 0.108 0.371 0.426 Number of bank 222 222 222 221 221 Robust standard errors in parentheses: *** p <0.01, **p < 0.05, *p < 0.1
Table 11: Brazilian Banking System Health Indicators
2003 2004 2005 2006 2007 2008 2009 Bank Regulatory Capital to RWA 18.8 18.6 17.9 18.9 18.7 18.4 18.5 Bank Capital to Assets 9.6 10.1 9.8 9.9 9.8 9.1 9.2 Bank Nonperforming Loans to Total Loans 4.1 2.9 3.5 3.5 3 3.1 4.3 Bank Provisions to NPL (*) 171.8 214.5 179.8 179.9 181.9 189.8 157.3 Bank Return on Assets 2 2.2 2.9 2.7 2.9 1.5 1.1 Bank Return on Equity 21.1 22.1 29.5 27.3 28.9 15.6 11.6
IMF Global Financial Stability Report 2009 (*) In millions of U.S. dollars
Table 12: Two stage regressions for Loans
M1 M2 M3 M4 M5
FE FE IV IV IV
all banks all banks all banks private public Dependent variable loanstock netfunds loanstock loanstock loanstock
size 0.366*** 0.334*** 0.323*** -0.00758
(0.0793) (0.0313) (0.0328) (0.0573) liquid -0.0116 0.319***
(0.0300) (0.0345) capital 0.0685 0.573***
(0.0633) (0.0561)
selic 0.00583 -0.00352 0.00348 0.00149 0.0148 (0.00396) (0.00217) (0.00627) (0.00656) (0.0135) unemp -2.537 -1.369*
(1.565) (0.701)
rer -0.0344 0.0933 -0.0514 -0.00680 -0.585 (0.150) (0.0676) (0.253) (0.264) (0.543)
gdp 0.143 0.275 0.512 0.425 2.105**
(0.276) (0.254) (0.361) (0.375) (0.835)
indprod 0.536*** 0.387 0.301 0.302
(0.190) (0.262) (0.274) (0.584)
npl -0.0322*** -0.0318*** -0.0322*** -0.0255***
(0.00337) (0.00100) (0.00105) (0.00255) provisions 0.496*** 0.491*** 0.466*** 0.750***
(0.0624) (0.00996) (0.0103) (0.0277)
netfunds 0.0861 0.168*** -0.713***
(0.0565) (0.0579) (0.220)
Observations 3,488 4,139 3,488 3,193 295
Number of banks 232 260 232 215 17
Sargan statistic 17.649 12.98
Robust standard errors in parentheses: *** p <0.01, **p < 0.05, * p < 0.1