Does Expert Advice Improve Educational
Choice?
Lex Borghans1☯, Bart H. H. Golsteyn1,2☯*, Anders Stenberg2☯
1Department of Economics and Research Centre for Education and the Labour Market (ROA), Maastricht University, Maastricht, the Netherlands,2Swedish Institute for Social Research (SOFI), Stockholm University, Stockholm, Sweden
☯These authors contributed equally to this work. *[email protected]
Abstract
This paper reports evidence that an individual meeting with a study counselor at high school significantly improves the quality of choice of tertiary educational field, as self-assessed 18 months after graduation from college. To address endogeneity, we explore the variation in study counseling practices between schools as an instrumental variable (IV). Following careful scrutiny of the validity of the IV, our results indicate a significant and positive influ-ence of study counseling on the quality of educational choice, foremost among males and those with low educated parents. The overall result is stable across a number of robustness checks.
Introduction
The choice of a field of study at college is typically surrounded with uncertainty about the returns to education, the characteristics of occupations one can work in after graduating and the match between the individual preferences and job characteristics. A reduction in this uncertainty may provide substantial efficiency gains as an improved educational choice could enhance individuals’job satisfaction, overall productivity and decrease study time devoted to correct initial choices. In this perspective, interesting empirical questions are if and how policy can reduce uncertainty and improve the quality of educational choices. In most OECD coun-tries, schools employ study counselors to address this task. However, while a number of recent articles have reported that information influences educational choice, little is known if, how, and to what extent study counseling may affect educational choices. To the best of our knowl-edge, this study is the first to link study counseling to the quality of educational choice assessed after education has been completed and individuals have entered the labor market.
The aim of this paper is to analyze if study counseling at secondary school influences the quality of tertiary level educational choice. We use rich survey data of Dutch tertiary education graduates which include retrospective information on the use of counseling at secondary school, the name of the secondary school they graduated from, their family background, per-sonality traits—risk-preferences, cognitive abilities, locus of control, anxiety, self-perception and self-confidence—and an assessment of the quality of their educational choice. Our main OPEN ACCESS
Citation:Borghans L, Golsteyn BHH, Stenberg A (2015) Does Expert Advice Improve Educational Choice? PLoS ONE 10(12): e0145378. doi:10.1371/ journal.pone.0145378
Editor:Jacobus van Wouwe, TNO, NETHERLANDS
Received:June 17, 2015
Accepted:December 1, 2015
Published:December 21, 2015
Copyright:© 2015 Borghans et al. This is an open access article distributed under the terms of the
Creative Commons Attribution License, which permits unrestricted use, distribution, and reproduction in any medium, provided the original author and source are credited.
Data Availability Statement:The data were offered to us by a third party: the Research Centre for Education and the Labour Market (ROA) at Maastricht University. In order to get access to the data, readers may contact the secretary of ROA. The email address is
Funding:These authors have no support or funding to report.
sample consists of 4,191 graduates from tertiary school. The educational system in the Nether-lands is such that most individuals complete a tertiary education. According to Statistics Neth-erlands, around 15% end up with a diploma lower than tertiary level (http://statline.cbs.nl/ statweb/). As a comparison, this exceeds the high school completion rate in the US, which peaked at around 80% in the 1970s ([1], p382). Around 18 months after tertiary school comple-tion, the graduates in our sample are asked whether they would choose the same educational field if they had a chance to choose again. Approximately 22% of the graduates state they would have rather studied a different field of education. Table A inS2 Filereveals—using a dif-ferent data set—that the percentage preferring a different field in the Netherlands is relatively low compared with other countries. The relevance of this indicator is supported by its link with a higher probability of re-enrollment in education, which in turn leads to substantial efficiency losses [2].
Theoretically, we view students’predictions of their future utility of an educational choice as noisy, such that their expected utilities partly deviate from the true future utilities associated with different educational paths. The uncertainty may regard the conditions on the labor mar-ket, the job-specific environments and the individual’s own utility function, e.g. an imprecise knowledge about own competences, motivations and/or preferences. Study counseling may reduce uncertainty in one or several respects, and thereby reduce the noise around the true val-ues. The empirical question we raise is whether data support that an individual meeting with a counselor improves the self-assessed quality of educational choice.
A methodological challenge of our analyses is that the decision to seek help from a coun-selor is endogenous. Individuals who, for instance, are more uncertain (or intelligent) may seek more help from counselors and make poorer (better) choices so that conventional OLS esti-mates of the effect of study counseling on quality of educational choice are underestimated (overestimated). To circumvent this endogeneity problem, we explore the variation in counsel-ing practices between schools in an instrumental variable (IV) settcounsel-ing. Specifically, we define our IV as the fraction of students from the same secondary school (excluding the individual him/herself) who state that they had a personal meeting with a study counselor. The variation in this variable is partly exogenous as it reflects individual counselors’heterogeneous behaviors. Counselors typically have an independent working situation with little formal incentives to stage individual meetings with students. Our large battery of control variables can only mod-estly explain the incidence of seeing a counselor. This is consistent with the assumption that their behavior to a large extent is unrelated to individual or school level characteristics.
biased both by individual and school endogeneity, controlling for school specific factors by adding school fixed effects has little influence on the parameter estimate. Overall, detailed checks yield results which are consistent with the key assumptions of our model with respect to school endogeneity, individual endogeneity, peer-effects and data measurement errors. Two features which should decrease the risk that the IV reflects peer effects are that our data are based on Internet surveys and include relatively few pupils per school. Also, as a robustness check, we redefine our IV, excluding students from the same school who graduated in the same year as the respondent. This does not affect our results.
Uncertainty is a classical topic in economics (e.g. [3–6]) which has developed into several branches. We wish to highlight four categories of empirical findings which are related to our study, supporting that counseling may play an important role. The first group of studies seeks to map the determinants and the extent of uncertainty about educational choice [7–10], finding that students’knowledge about the labor market is associated with family background factors and that senior students have more accurate knowledge, implying a learning process during college years. (As sources of information, [8] reported that students primarily used newspapers and magazines (60–70%), whereas career service centers were less common (30–40%) except in the final year of college.) The second, third and fourth category of studies have focused on different parts of“the anatomy”of the uncertainty. The second group consists of a large num-ber of studies, mainly recent, which have reported that educational choices (the choice of col-lege major or colcol-lege enrollment), educational aspirations and/or attendance rates are affected by information on objective measures, such as the expected returns to education, about own ability, about the availability of financial aid, or assistance in filling out paper work [11–21]. The third group reports that highly subjective factors may also generate uncertainty if students need to disentangle their own preferences/utility from the expectations of parents, peers, gen-der roles and/or other ideas about own identity [22–25]. The fourth group of studies is devel-oped by psychologists independently of the economics literature, and shows that study counseling affects“self-efficacy”, which measures short term change in certainty about own ability and future preferences regarding individual career choice (e.g. [26–29]). In relation to these branches of the literature on educational choice, we see the incidence of counseling as a generic measure which may encompass information on objective measures (e.g. earnings) and/ or address subjective issues related to uncertainty about own utility function (identity/self-effi-cacy). Our main analyses are agnostic with respect to the exact mechanisms, or the anatomy of the uncertainty which counselors are concerned with, but we appraise this issue via additional survey data of Dutch counselors which cover 112 of the 567 schools included in our sample.
We are aware of three articles which have evaluated study counseling practices. As out-comes, they all consider transitions from high school to college, but results have been mixed. [30] exploit the staggered roll-out of the Texas GO Center Project which targeted academically prepared students with counseling and guidance by student peers. They find college attendance rates to increase among Hispanic and low income students. [31] analyzes the impact of ten hours of individualized meetings with a professional college counselor, randomly assigned to high achieving students from relatively poor families, finding no effect on college applications but a small (statistically insignificant) effect on the quality of college chosen. [32] randomly assign college mentoring services and fee waivers for college applications to high school senior students, finding a significant impact on women’s decisions to enroll in college, but they find no significant effects for males and no effects when cash bonuses were offered without mentoring.
educational choice? (Using Dutch data, there is limited scope to analyze the choice to attend college as students almost always enter tertiary education.) The assessments of educational choice are made 18 months after graduation, and thereby include individuals’full experience of their educational choice, and their initial experience of actual (rather than expected) labor market careers. The assessment also takes into account that individuals may attach different weights to a wide array of outcomes, including non-monetary aspects, wages and job-opportu-nities [11]. The main finding is that counseling has a statistically significant impact on the qual-ity of educational choice.
In terms of magnitude, one standard deviation more counseling at a school is associated with a 9 percent decrease in the probability of students preferring a different field of education in retrospect. Tentatively, based on the survey data of Dutch study counselors, we also find indications that counseling addresses uncertainty about own preferences at least as much as information about objective measures such as employment prospects. The positive effects of study counseling are strongest for males and for those whose parents have low levels of educa-tion. Overall, we consider the estimates to be large, especially since counseling is relatively inex-pensive and because a low quality educational choice may be associated with substantial costs for the individual and from society’s point of view.
The plan of the paper is as follows. The next Section describes the Dutch schooling system, the data set and our key variables: counseling and the quality of the educational choice. Then, the empirical strategy is presented. After that, we show the main results, the robustness analy-ses, and the mechanisms. The last Section concludes.
Dutch Schooling System, Data and Sample
In this section, we give an account of the Dutch schooling system, the sources of our data and define the sample of interest. We then present some descriptive statistics and discuss in detail the definitions and the properties of our key measures: study counseling and the quality of edu-cational choice.
The Dutch schooling system
Data sources
We use data from a sample of Dutch graduates. Each year, the Research Centre for Education and the Labour Market (ROA) gathers information from Dutch graduates (the data are referred to as theSchoolverlater Informatie Systeem, abbreviated to SIS). The primary purpose of the survey is to give representative overviews of the graduates’position on the labor market and their assessments of the quality of the education they completed.
We use information from the 2004 wave of the data. In this wave, all graduates from all lev-els in the Dutch educational system received a questionnaire 1.5 years after graduation. The response rate was 45 percent. Half a year after the survey took place, the respondents were approached with an additional Internet questionnaire which contains important variables for our analyses. In order to stimulate participation and deliberate answers, they were offered, upon completion of the questionnaire, a personal profile about their style to deal with choices. The survey included detailed questions on individual personality traits, such as indicators of individual discount rates, risk-preferences, cognitive ability, locus of control, anxiety, self-per-ception and self-confidence.
An important feature of the data set is that respondents are also asked in which secondary school they studied and in which year they graduated from this school. We use this informa-tion to construct an instrument for school counseling and measures of school averages of vari-ous characteristics. Personality traits are measured after counseling took place. If personality traits are unstable, the relationships with counseling may therefore be subject to reverse causal-ity. [33] review the evidence on the stability of IQ and personality traits. [34] show that the rank-order trait consistency in the age group 18–22 is around 50%. The full list of the questions we used to measure personality is provided inS3 File.
Our sample of interest consists of individuals aged 20 to 30. In total, 4,191 graduates from 567 secondary schools participated. It is difficult to establish with certainty how data attrition affects estimates since, with an IV strategy, it is never possible to pin-down in detail the validity of a Local Average Treatment Effect. Nevertheless, the main impression from the attrition (see Table B inS2 File) is that the remaining observations in the second wave are similar to the first wave respondents in terms of their quality of educational choice, but constitute lower fractions of men and low level (MBO) graduates. In general, attrition implies that we overestimate the impact of counseling if students who are unaffected by counseling are underrepresented. One might suspect individuals from higher socioeconomic background to be better informed [8,9] and have lower marginal gains from additional information. The attrition, if anything, indi-cates that these groups are overrepresented. The final sample contains observations from all important subgroups, but estimated results are also reported for these groups separately in the results Section.
Measuring study counseling
high level a level higher than the median level of education.) In contrast, those in the lowest secondary track are more likely to reply that they never had a personal meeting with a study counselor.
We construct a dummy variable which has the value 0 if a student never was in personal contact with a study counselor and 1 otherwise. Thus, we pool the answer categories“ some-times,” “regularly,” “often,”and“very often”as there may be variation in how respondents perceive these categories. Table C inS2 Fileshows descriptive average characteristics of indi-viduals separated by gender and the incidence of seeing a counselor. Counseling is only associ-ated with minor systematic differences in these variables, except that females with a higher IQ and students at the middle or high level tracks of secondary school are more likely to meet the counselor. It may be that students in these tracks better understand the importance of gather-ing information, and/or that counselgather-ing is offered more often as the studies are less specific and the connection to occupations is less obvious. This could make it more difficult for the students to understand the consequences of choosing a discipline.
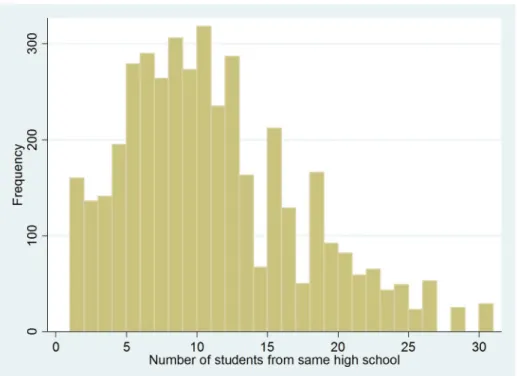
The indicator variable of individual counseling is the basis for the construction of our instrumental variable. For each individual, the IV is defined as the average counseling among students from the same secondary school, excluding the individual him/herself. (With our strategy we also avoid potential problems related to the possibility that the answers of students on questions about the quality of educational choice are correlated with the questions about counseling earlier on in the survey due to mood or personality of that student.) We assume that this variable reflects study counseling practices at secondary schools and that the variation contains an exogenous element. The credibility of this assumption is discussed in the empirical method Section and in the Section where we provide various robustness checks. The IV thus requires that each school in the sample should be represented by at least 2 respondents.Fig 1 shows the distribution of the number of students in our sample who graduated from the same school. The median is 10, the first quartile is 5 and the third quartile is 15.Fig 2shows the aver-age counseling frequency across the schools. Around 11% of the respondents were in a school in which every student in our sample met a counselor, while 2% of the respondents were in a school in which no respondent in our sample met a counselor. The other respondents were in schools with an average counseling between these extremes. Of the overall variance in this vari-able, approximately three fourths stem from between school variation and one fourth from within school variation. The within school variation may be seen as measurement error in school counseling policies, which is correlated with the number of observations we have per
Table 1. Frequency of contact with study counselor.
Never Sometimes Regularly Often Very often Total
Women 30.3 46.6 15.6 6.3 1.1 100
Men 30.0 46.6 15.8 6.8 0.8 100
Low level secondary (VMBO) 38.4 38.3 15.2 7.0 1.1 100
Middle level secondary (HAVO) 27.8 48.0 15.5 7.6 1.1 100
High level secondary (VWO) 28.2 49.5 16.1 5.4 0.9 100
Natives 30.0 46.8 15.9 6.5 1.0 100
Immigrants 32.2 45.3 13.8 7.0 1.7 100
Parents low education 30.7 45.6 16.5 6.3 0.9 100
Parents high education 30.7 45.9 16.5 5.7 1.2 100
Total 30.2 46.6 15.7 6.5 1.0 100
Data source: Supplement survey of the 2004 SIS wave.
Fig 1. Number of students in the data set from the same secondary school.Data source: Supplement survey of the 2004 SIS wave.
doi:10.1371/journal.pone.0145378.g001
Fig 2. Histogram of school average amount of counseling.Data source: Supplement survey of the 2004 SIS wave. This distribution is based on school level data (so not on individual level data).
school. This generates heteroscedasticity in our first stage predictions which we address by allowing for a more flexible functional form (see the Section containing the robustness analy-ses). The observed variation inFig 2may not only show that individual counselors behave differently, but may also reflect a combination of school factors, students sorting into schools and randomness. The major part of this article will seek to identify and isolate the variation which is unrelated to school and student characteristics to test the hypothesis that counseling improves the quality of educational choice.
Measuring quality of educational choice
The quality of the educational choice may be defined using a large number of criteria, to which different individuals attach different weights, e.g. the amount of leisure or commuting time, the provision of child care facilities by the employer, etc. This makes it appropriate to let the indi-viduals themselves assess the quality of the educational choice. Our measure is an assessment 18 months after graduation, so individuals have by then attended and completed the particular educational track they chose and have had an additional 18 months to learn more about the consequences of their choice.
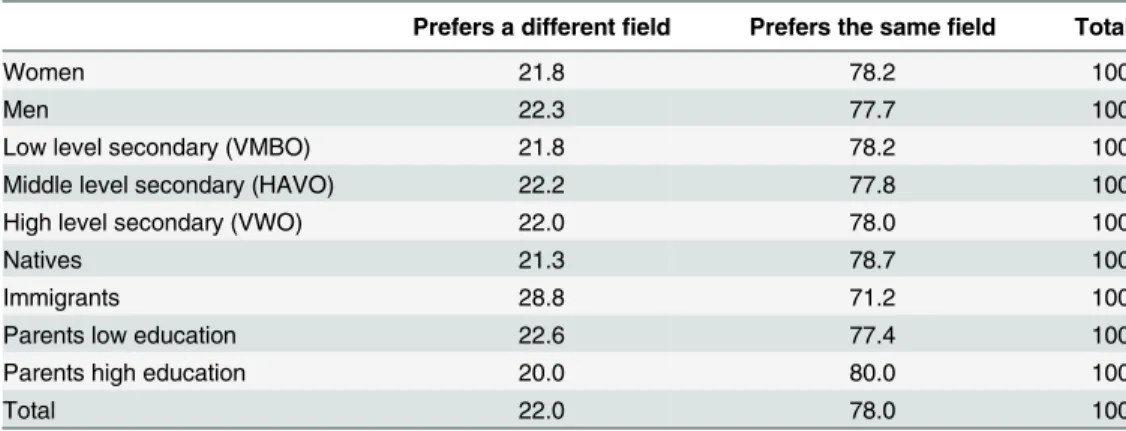
The question we use to assess the quality of educational choice reads“Would you in retro-spect choose the same education as the one you followed again?”Answer categories are 1.“yes, same education at same college,”2.“yes, same education but at a different school,”3.“no, a dif-ferent education,”4.“no, I would not go and study.”We construct a dummy variable which has the value 0 if the answer was 1 or 2, and 1 if the answer was 3 or 4 (the number of graduates answering they would not go and study is negligible). The idea behind our indicator is that a person made an adequate choice if the decision based on limited information at secondary school is the same as the one stated 18 months after graduation, when consequences of the decision are known. Therefore, our outcome variable of interest can be seen as an indicator var-iable of low quality of the educational choice.Table 2reveals that approximately 22% of the graduates would have chosen a different field of education, and that this is roughly equal between men and women and among people from different secondary educational tracks. Immigrants’choices appear more often to be of low quality than natives’choices, as is the case
Table 2. Quality of educational choice.
Prefers a differentfield Prefers the samefield Total
Women 21.8 78.2 100
Men 22.3 77.7 100
Low level secondary (VMBO) 21.8 78.2 100
Middle level secondary (HAVO) 22.2 77.8 100
High level secondary (VWO) 22.0 78.0 100
Natives 21.3 78.7 100
Immigrants 28.8 71.2 100
Parents low education 22.6 77.4 100
Parents high education 20.0 80.0 100
Total 22.0 78.0 100
Data source: Supplement survey of the 2004 SIS wave. The separation between low and high education of the parents is based on the distribution of the level of education among parents. Low level indicates a level lower than the median and high level a level higher than the median level of education. Additional information using regressions is given in Table D inS2 File.
for students whose parents have low education compared to those with highly educated parents.
Empirical Strategy
Empirical model
To empirically investigate whether the quality of educational choice (Qit+1) may be explained by, an indicator variable for receiving counseling (Cit), we need to take into consideration that counseling is a non-random event which potentially depends on the characteristics of the indi-vidual as well as of the school. In an OLS regression framework, this is addressed by controlling for individual characteristicsXiwhich include gender, age, secondary educational track attended, parental education, immigrant background, economic preference parameters (time and risk preference) and indicators of personality traits (locus of control, anxiety, self-percep-tion, self-confidence, and cognitive ability), and a vector of school characteristicsXj, containing “school pupil averages”of the same variables, wherejdenotes all individualsj6¼iwho attended the same secondary school as individualiexcept for individualihim/herself. (Timetshould not be read as calendar year; it is merely to indicate the period prior to the assessment of educa-tional choice.)
Qitþ1 ¼b0þb1Xiþb2Xjþb3Citþei ð1Þ
Now, as the incidence of seeing a counselor is likely to be endogenous, the error term may con-sist of unobserved individual characteristicsZiand school specific factorsfs:ei=b4Zi+b5fs+εi. If fsorZiare correlated withCit, the parameterb3will be a biased estimator of the impact of counsel-ing on the quality of educational choice.
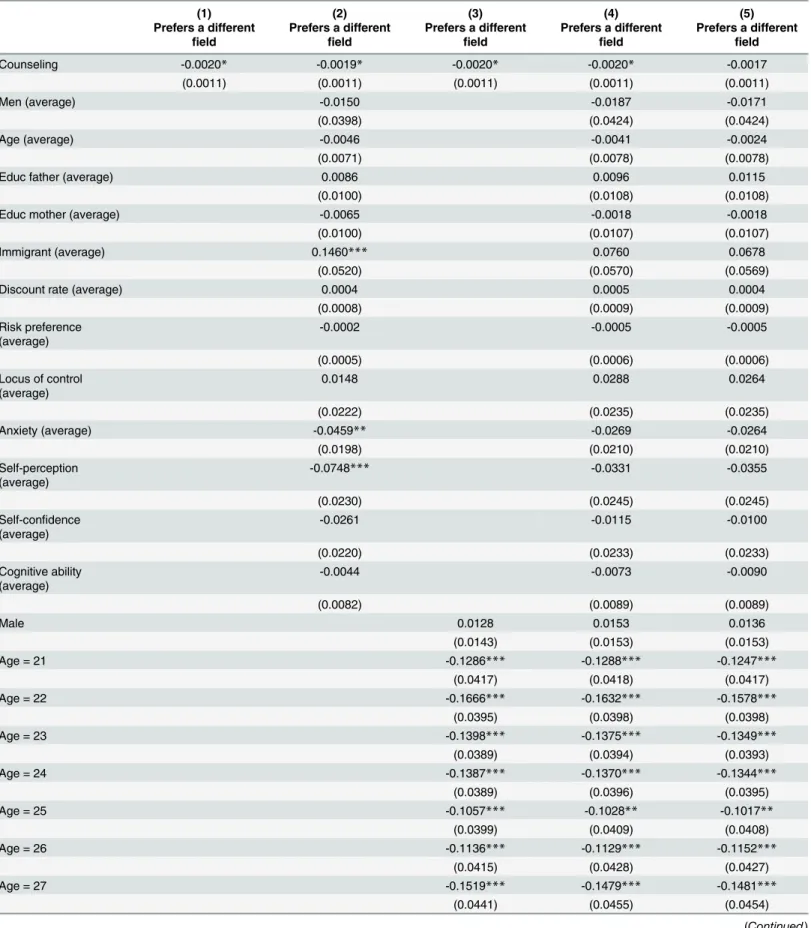
Table 3shows results from the baseline OLS regression, indicating a beneficial but small association of study counseling with the quality of the educational choice. The coefficient shows that attending a counselor is negatively associated with the probability to make a low quality educational choice. This estimate is potentially biased due to individual characteristics Zi, school specific factorsfs, or both. The school endogeneity implies that schools’provision of counseling is correlated with their pupils’abilities to gather information. Thus, even if counsel-ing has no effect on individuals’choices, there may be a spurious correlation between counsel-ing and quality of educational choice.
The individual endogeneity (Zi) may be thought of in terms of uncertainty about future career choice. Students who are more uncertain may be more likely to seek counseling, but may also be more likely to end up with a low quality educational choice (cf. seeing a medical doctor increases the probability of being sick). This would make the OLS coefficient underesti-mate the impact of counseling. Of course, it may also be that students who are better at gather-ing information are more likely to see a counselor, leadgather-ing to a reverse bias.
Table 3. OLS estimates of the relationship between study counseling and quality of the educational choice.
(1) (2) (3) (4) (5)
Prefers a different
field
Prefers a different
field
Prefers a different
field
Prefers a different
field
Prefers a different
field
Counseling -0.0020* -0.0019* -0.0020* -0.0020* -0.0017
(0.0011) (0.0011) (0.0011) (0.0011) (0.0011)
Men (average) -0.0150 -0.0187 -0.0171
(0.0398) (0.0424) (0.0424)
Age (average) -0.0046 -0.0041 -0.0024
(0.0071) (0.0078) (0.0078)
Educ father (average) 0.0086 0.0096 0.0115
(0.0100) (0.0108) (0.0108)
Educ mother (average) -0.0065 -0.0018 -0.0018
(0.0100) (0.0107) (0.0107)
Immigrant (average) 0.1460*** 0.0760 0.0678
(0.0520) (0.0570) (0.0569)
Discount rate (average) 0.0004 0.0005 0.0004
(0.0008) (0.0009) (0.0009)
Risk preference (average)
-0.0002 -0.0005 -0.0005
(0.0005) (0.0006) (0.0006)
Locus of control (average)
0.0148 0.0288 0.0264
(0.0222) (0.0235) (0.0235)
Anxiety (average) -0.0459** -0.0269 -0.0264
(0.0198) (0.0210) (0.0210)
Self-perception (average)
-0.0748*** -0.0331 -0.0355
(0.0230) (0.0245) (0.0245)
Self-confidence (average)
-0.0261 -0.0115 -0.0100
(0.0220) (0.0233) (0.0233)
Cognitive ability (average)
-0.0044 -0.0073 -0.0090
(0.0082) (0.0089) (0.0089)
Male 0.0128 0.0153 0.0136
(0.0143) (0.0153) (0.0153)
Age = 21 -0.1286*** -0.1288*** -0.1247***
(0.0417) (0.0418) (0.0417)
Age = 22 -0.1666*** -0.1632*** -0.1578***
(0.0395) (0.0398) (0.0398)
Age = 23 -0.1398*** -0.1375*** -0.1349***
(0.0389) (0.0394) (0.0393)
Age = 24 -0.1387*** -0.1370*** -0.1344***
(0.0389) (0.0396) (0.0395)
Age = 25 -0.1057*** -0.1028** -0.1017**
(0.0399) (0.0409) (0.0408)
Age = 26 -0.1136*** -0.1129*** -0.1152***
(0.0415) (0.0428) (0.0427)
Age = 27 -0.1519*** -0.1479*** -0.1481***
(0.0441) (0.0455) (0.0454)
Table 3. (Continued)
(1) (2) (3) (4) (5)
Prefers a different
field
Prefers a different
field
Prefers a different
field
Prefers a different
field
Prefers a different
field
Age = 28 -0.1454*** -0.1403*** -0.1351***
(0.0492) (0.0509) (0.0508)
Age = 29 -0.1277** -0.1250** -0.1255**
(0.0576) (0.0595) (0.0594)
Age = 30 -0.2700*** -0.2668*** -0.2669***
(0.0664) (0.0680) (0.0678)
Educ father -0.0005 -0.0017 -0.0026
(0.0038) (0.0041) (0.0041)
Educ mother -0.0049 -0.0048 -0.0043
(0.0037) (0.0040) (0.0040)
Middle level sec. school 0.0428** 0.0436** 0.0372**
(0.0177) (0.0178) (0.0178)
High level sec. school 0.0338* 0.0371* 0.0331*
(0.0196) (0.0199) (0.0198)
Immigrant 0.0746*** 0.0586** 0.0582**
(0.0215) (0.0238) (0.0238)
Discount rate -0.0000 -0.0001 -0.0001
(0.0003) (0.0003) (0.0011)
Risk preference 0.0002 0.0003 0.0013**
(0.0002) (0.0002) (0.0006)
Locus of control -0.0090 -0.0128 -0.0421**
(0.0078) (0.0083) (0.0190)
Anxiety -0.0203*** -0.0170** -0.0192
(0.0069) (0.0074) (0.0362)
Self-perception -0.0459*** -0.0413*** -0.0285**
(0.0082) (0.0088) (0.0119)
Self-confidence -0.0149* -0.0141* 0.0036
(0.0077) (0.0082) (0.0111)
Cognitive ability -0.0016 -0.0004 0.0129
(0.0033) (0.0035) (0.0097)
Discount rate squared -0.0000
(0.0000)
Risk preference squared -0.0000*
(0.0000)
Locus of control squared 0.0101*
(0.0060)
Anxiety squared 0.0004
(0.0044)
Self-perception squared 0.0093*
(0.0051)
Self-confidence squared 0.0109**
(0.0044)
Cognitive ability squared -0.0019
(0.0013)
Constant 0.2205*** 0.4264** 0.3785*** 0.5192** 0.4622**
probability of receiving counseling. In a second stage regression, the predicted value (C^it) is
used as an explanatory variable forQit+1. Formally, the following model is estimated:
Cit¼a0þa1Xiþa2Xjþa3Sjtþεi ð2Þ
Qitþ1¼b0þb1Xiþb2Xjþb3
^
Citþui; ð3Þ
in whichεiandυiare error terms in the respective regressions and theαandβparameters are
to be estimated. The second stage estimate of3is the parameter of main interest. It reflects the Local Average Treatment Effect (LATE) and is only valid for those who are affected by an increase in study counseling activity [35]. To obtain the average treatment effect of the whole population, one would require that our IV affects the behavior of all individuals in the same way. In an effort tofind out which individual characteristics are associated with our LATE esti-mates, we estimatedCit=λ0+λ1Sjt+λ2Xit+λ3(Sjt)Xit. The coefficients of the interaction vari-ablesλ3could then be informative, but none of them are significant. For the subsample of natives, the interaction between our IV and the discount rate is positive and significant, sug-gesting that sensitivity to counselor’s behavior depends on the discount rate. The result holds for the subsample of males but not for females. For immigrants, wefind that those with an internal locus of control are affected significantly more than immigrants with an external locus of control. Complete results are available on request.
In theory, one may expect that the individuals most affected by the counseling activity at the school would be those who tend to have less accurate information at the outset, e.g. with immi-grant backgrounds or with parents who have low educational attainments. Uncertainty about the own utility function may strengthen or weaken this tendency, depending on how expecta-tions of parents, peers, gender roles and/or own identity vary across socioeconomic groups and whether they generate certainty (e.g.“I want to do what my mother/father does”) or uncertainty (e.g. a conflict between complying with others’expectations and pursuing a different educational path). Counselors could make a difference either by encouraging individ-uals to challenge these expectations or by strengthening the preferences generated by these expectations.
Table 3. (Continued)
(1) (2) (3) (4) (5)
Prefers a different
field
Prefers a different
field
Prefers a different
field
Prefers a different
field
Prefers a different
field
(0.0064) (0.1988) (0.0518) (0.2107) (0.2235)
Observations 4,191 4,191 4,191 4,191 4,191
R-squared 0.001 0.009 0.029 0.032 0.038
Notes: Standard errors in parentheses, ***p<0.01,
**p<0.05,
*p<0.1.
Data source: Supplement survey of the 2004 SIS wave. The dependent variable is a dummy variable (0 = does not prefer a differentfield of education in retrospect, 1 = prefers a differentfield of education in retrospect). Counseling is standardized at the school level as described in the data section. Educ Father and Mother represent the highest level of education that the father or mother graduated from.“average”indicates that school averages have been calculated.
Validity of our instrumental variable
The validity of our empirical strategy hinges on that (1) the IV is able to predict that individuals seek help from a counselor but (2) is uncorrelated, or unconfounded, with potential unobserv-able variunobserv-ables which simultaneously influence the probability of seeing a counselor and the out-come variableQit+1. We exploit that advisors work independently, without strong incentives to improve the student’s educational choice. This may generate a random element to the counse-lor's activity at a given school. The underlying assumptions of the unconfoundedness condition are not directly testable, but below we address their credibility by discussing measurement issues, school specific confounders, and individual confounders. [36] emphasize the impor-tance of a well-developed theoretical“story.”[37] (p6) makes the following remark:
“. . .minimal identifying assumptions must be justified or rationalized on the basis of a priori
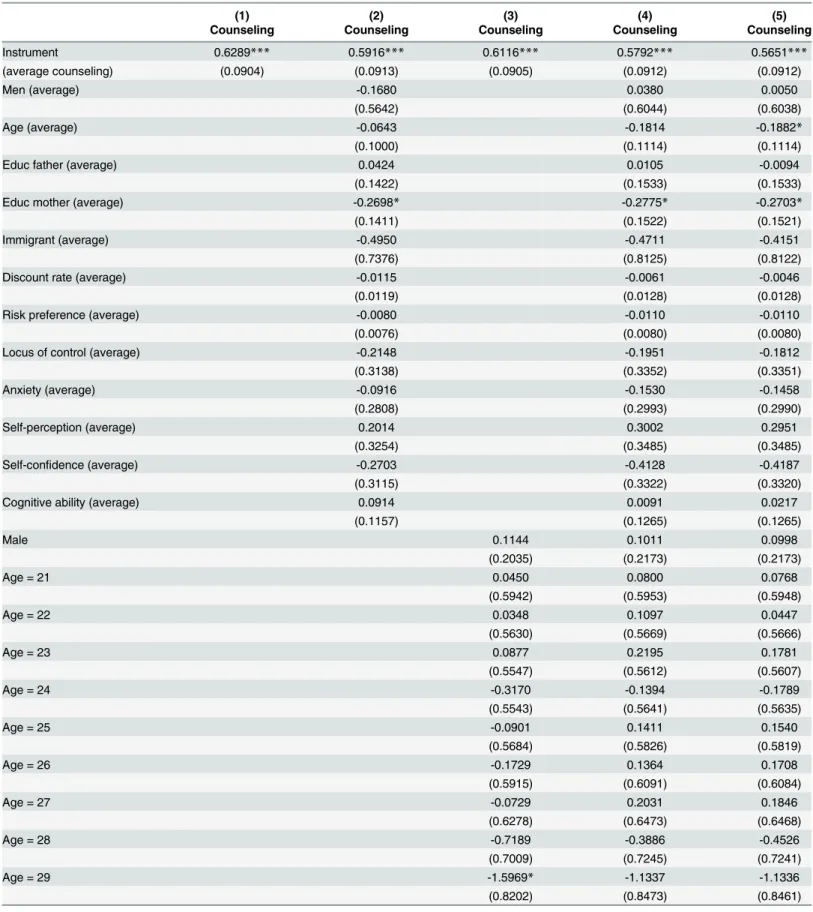
argument, outside evidence, intuition, theory, or some other means outside the model. While the necessity to make these types of arguments may at first seem dismaying, it can also be argued that they are what social science is all about, which is using one’s comprehensive knowl-edge of society to formulate theories of how social forces work, to make informed judgments about those theories, and debating with other social scientists what the most supportable assumptions are.”First stage regressions, presented inTable 4, indicate that students are much more likely to see a study counselor if they attended schools where counseling of other individ-uals was more frequent. Thus, the first condition of our IV strategy appears to hold (F-statistic of 40.3), even after including a large number of control variables.
Measurement issues. In this subsection, we consider the accuracy of the collected data on personality traits and whether our IV really captures the counseling activity at the schools. We also give an account of a correction in the standardization of the counseling variable.
Looking at our first stage regression results, a reservation one might have is that except for the IV, the level of educational track and the individual level of anxiety, the covariates generally do not significantly explain the occurrence of counseling. This may indicate that the personal-ity traits are poorly measured. We therefore ran a regression with the level of tracking as the dependent variable, which we would expect to be highly endogenous and correlated with these variables. We find that the covariates are significant and in the expected direction (e.g. the IQ variable is associated with at-value of 23.7). Another interpretation of the covariates’lack of explanatory power is that counseling incidence may have a large random component. If counseling would be truly random, the OLS estimate would have a causal interpretation. How-ever, since unobserved confounders may not have been included as covariates, we cannot be certain it is truly random. Therefore, it is important to explore the relationship using an IV technique.
Table 4. First stage results: the effect of average amount of counseling by students of the same secondary school on individual’s counseling.
(1) (2) (3) (4) (5)
Counseling Counseling Counseling Counseling Counseling
Instrument 0.6289*** 0.5916*** 0.6116*** 0.5792*** 0.5651***
(average counseling) (0.0904) (0.0913) (0.0905) (0.0912) (0.0912)
Men (average) -0.1680 0.0380 0.0050
(0.5642) (0.6044) (0.6038)
Age (average) -0.0643 -0.1814 -0.1882*
(0.1000) (0.1114) (0.1114)
Educ father (average) 0.0424 0.0105 -0.0094
(0.1422) (0.1533) (0.1533)
Educ mother (average) -0.2698* -0.2775* -0.2703*
(0.1411) (0.1522) (0.1521)
Immigrant (average) -0.4950 -0.4711 -0.4151
(0.7376) (0.8125) (0.8122)
Discount rate (average) -0.0115 -0.0061 -0.0046
(0.0119) (0.0128) (0.0128)
Risk preference (average) -0.0080 -0.0110 -0.0110
(0.0076) (0.0080) (0.0080)
Locus of control (average) -0.2148 -0.1951 -0.1812
(0.3138) (0.3352) (0.3351)
Anxiety (average) -0.0916 -0.1530 -0.1458
(0.2808) (0.2993) (0.2990)
Self-perception (average) 0.2014 0.3002 0.2951
(0.3254) (0.3485) (0.3485)
Self-confidence (average) -0.2703 -0.4128 -0.4187
(0.3115) (0.3322) (0.3320)
Cognitive ability (average) 0.0914 0.0091 0.0217
(0.1157) (0.1265) (0.1265)
Male 0.1144 0.1011 0.0998
(0.2035) (0.2173) (0.2173)
Age = 21 0.0450 0.0800 0.0768
(0.5942) (0.5953) (0.5948)
Age = 22 0.0348 0.1097 0.0447
(0.5630) (0.5669) (0.5666)
Age = 23 0.0877 0.2195 0.1781
(0.5547) (0.5612) (0.5607)
Age = 24 -0.3170 -0.1394 -0.1789
(0.5543) (0.5641) (0.5635)
Age = 25 -0.0901 0.1411 0.1540
(0.5684) (0.5826) (0.5819)
Age = 26 -0.1729 0.1364 0.1708
(0.5915) (0.6091) (0.6084)
Age = 27 -0.0729 0.2031 0.1846
(0.6278) (0.6473) (0.6468)
Age = 28 -0.7189 -0.3886 -0.4526
(0.7009) (0.7245) (0.7241)
Age = 29 -1.5969* -1.1337 -1.1336
(0.8202) (0.8473) (0.8461)
Table 4. (Continued)
(1) (2) (3) (4) (5)
Counseling Counseling Counseling Counseling Counseling
Age = 30 0.1753 0.6233 0.6340
(0.9450) (0.9679) (0.9668)
Educ father -0.0089 -0.0019 0.0074
(0.0536) (0.0579) (0.0579)
Educ mother -0.0123 0.0360 0.0294
(0.0531) (0.0575) (0.0575)
Middle level sec. school 1.2358*** 1.2573*** 1.2883***
(0.2511) (0.2521) (0.2530)
High level sec. school 1.3081*** 1.3855*** 1.3970***
(0.2778) (0.2820) (0.2820)
Immigrant -0.1604 -0.0270 -0.0219
(0.3061) (0.3391) (0.3390)
Discount rate -0.0035 -0.0027 -0.0170
(0.0044) (0.0047) (0.0157)
Risk preference 0.0006 0.0020 0.0005
(0.0026) (0.0027) (0.0084)
Locus of control -0.0296 0.0067 0.0439
(0.1105) (0.1184) (0.2712)
Anxiety 0.0764 0.0937 1.3762***
(0.0988) (0.1055) (0.5149)
Self-perception -0.0486 -0.0936 -0.2611
(0.1172) (0.1257) (0.1698)
Self-confidence 0.0670 0.1179 -0.0288
(0.1092) (0.1167) (0.1577)
Cognitive ability -0.0216 -0.0242 -0.0324
(0.0467) (0.0500) (0.1376)
Discount rate squared 0.0002
(0.0002)
Risk preference squared 0.0000
(0.0001)
Locus of control squared -0.0066
(0.0861)
Anxiety squared -0.1590**
(0.0621)
Self-perception squared -0.1164
(0.0726)
Self-confidence squared -0.0840
(0.0632)
Cognitive ability squared 0.0007
(0.0181)
Constant 0.1198 3.8569 -0.8636 5.6306* 3.6021
(0.0903) (2.8154) (0.7373) (3.0001) (3.1859)
Observations 4,191 4,191 4,191 4,191 4,191
Given that our IV captures the behavior of the individual counselors at schools, a high fre-quency of visits may indicate that they are very active, or that they provide counseling of high quality which attracts students to come and visit them. This implies that the frequency and the quality of counseling plausibly correlate, and it would make us at least partly evaluate the effects of high quality counseling rather than just the average quality of counseling.
A final measurement issue is that we standardize the counseling variable using the distribu-tion of average counseling at the level of the secondary school. This requires a consistent measure of the variance, but our average counseling at the school level is likely to contain
Table 4. (Continued)
(1) (2) (3) (4) (5)
Counseling Counseling Counseling Counseling Counseling
R-squared 0.011 0.014 0.022 0.025 0.030
Notes: Standard errors in parentheses, ***p<0.01,
**p<0.05, *p<0.1.
Data source: Supplement survey of the 2004 SIS wave. The dependent variable“Counseling”is standardized at the school level as described in the data section. Educ Father and Mother represent the highest level of education that the father or mother graduated from.“average”indicates that school averages have been calculated“Average counseling in same secondary school”is the average amount of counseling by students of the same secondary school as the respondent, standardized to mean zero and standard deviation 1. Educ Father and Mother represent the highest level of education that the father or mother graduated from.“average”indicates that school averages have been calculated.
doi:10.1371/journal.pone.0145378.t004
Table 5. Information from additional survey among study counselors in 2008.
Group with IV below median
Group with IV above median
Mean number of counselors at middle level secondary school 0.663 0.850
(0.037) (0.039)
Mean number of counselors at high level secondary school 0.551 0.817
(0.028) (0.039)
Percentage middle level secondary school students who attends a counseling session once
38.95 47.03
(1.64) (1.62)
Percentage middle level secondary school students who attends a counseling session more than once
7.87 14.33
(0.55) (1.00)
Percentage high level secondary school students who attends a counseling session once
61.51 66.93
(1.58) (1.41)
Percentage high level secondary school students who attends a counseling session more than once
22.98 27.74
(1.21) (1.34)
Mean answer to“does school have enough information to guide students”
0.780 0.825
(0.018) (0.016)
Notes: standard errors are reported in parentheses.
measurement error which is inversely related to the number of observed students per school. We then risk overestimating the variance and thereby also the potential impact of a standard deviation change in the intensity of study counseling. We correct for this by running a regression of the measured variance at the school level on a constant and the inverse of the number of stu-dents per school. The constant of this regression gives a consistent measure of the variance cor-rected for measurement error. Formally, we assume our approximate school specific probability of seeing a counselor in a schoolðs
jtÞis equal to the true school averageðsschÞplus measurement
error (esch), with the error inversely related to the observed number of students per school (Nsch). Then,Varðs
jtÞ ¼VarðsschÞ þVarðeschÞ, whereVarðeschÞ ¼
sschð1 sschÞ
Nsch . The variance corrected for measurement error is the constant (γ0) in the regression:VarðsjtÞ ¼g0þg1ð1=NschÞ þεsch.
School specific confounders. The main threat to our identification strategy is arguably that unobserved school specific characteristics are related to study counseling practices. For instance, schools from relatively rich areas may tend to provide better or more counseling, but their students may be good at gathering information in the first place. To address this,XjinEq (3)includes a large set of school average characteristics: parental education, immigrant status, time preference, risk aversion, cognitive ability, anxiety, self-perception, self-confidence and locus of control. The robustness of our results to the inclusion of these control variables serves as a first indication that school specific factors do not undermine our IV estimates.
In addition, one may note that if our IV reflects some unobserved school quality variable, one would also expect the other school specific average characteristics to explain counseling incidence. However, none of 12 parameters pertaining to the school averages of parents’social background and/or pupils’personality traits is significant at a five percent level. In contrast, our IV which is also constructed as the average of studentsj6¼ifrom the same school as the respondent, is highly significant withp-values below .001. The results are thus consistent with the idea that the probability of seeing a counselor contains a non-trivial element of random variation across schools.
However, since it is a key factor of this study, let us for the sake of argument assume that school endogeneity tends to exaggerate the impact of counseling. The baseline OLS estimates inTable 3, which are close to zero, would then make sense only if some other unobservable also generates bias towards zero (e.g. uncertain individuals tend to see counselors). If we add school fixed effects, school endogeneity is taken into account (while individual endogeneity within school remains). This specification yields ab3coefficient of -.0011 (p-value .374), which is similar toTable 3. Thus, when controlling for unobserved school level factors, there is only a small impact on the estimate, suggesting that potential bias originating from school endogene-ity is modest (see the robustness analysis Section for fixed effects in the IV framework). The coefficient could be driven towards zero by measurement error bias, which is exacerbated when one uses fixed effects. However, with the stated assumptions, one would have expected bias from individual endogeneity to generate a positive coefficient (underestimating the effect of counseling) inTable 3.
Outside of school hours, one might also suspect that families’support differs systematically between schools. In our data, individuals were asked whether they formed an image of their education or profession via family members’education or profession. About 30% of the pupils stated that they formed the image using such information, but the school average of this vari-able is unrelated to the individual’s use of this information (i.e. the first stage is insignificant). Support from the family can therefore not account for school specific variation in the amount of help students receive when making their choice.
control variables, we also ran IV regressions using other school specific measures of actions to guide students in their educational choices. These measures include“lessons about educational choice were provided”(82 percent stated there were), whether“people came to talk about their professions”(52 percent) and“how often did you go to an information day?”(5 percent reported zero, 10 percent five times or more, the mode is two). These are all positively corre-lated with the counseling indicator (significant at a .01 level) but yield no statistically significant IV estimates. Thus, potential school specific confounders must, in addition to the conditions above, be uncorrelated with these other school specific guidance policies (further discussed in the Section which shows the robustness analyses).
Individual confounders. Concerning unobserved individual traits, the IV is not based on any direct information on individuali. Potential bias may then only arise indirectly, through correlations between individual traits and school quality (which we just discussed) or peer-effects, which might be considered a hybrid between individual and school specific traits. Peer effects originate from the social environments generated among members of a group of friends or of a classroom. This is a problem if peersjaffect individualibut also if studentiaffects peers (and who potentially in turn will influence him/her and so on, the so called reflection problem [38]).
The main concern here is that individuals from the same school in our survey met the same classroom/teacher, or were in the same circle of friends. Our IV could then pick up e.g. that for-ward looking peers affect both the probability of seeking counseling and the quality of educa-tional choice, which would bias our estimates.
Our sample consists of relatively few respondents from each school, who each completed an Internet survey. For peers to have a major influence on both the probability of seeing a coun-selor and the quality of educational choice, one needs to assume (1) that the relatively few respondents from each school were part of the same circle of friends/classrooms or other par-tial environments when in high school; (2) that they influence one another to complete the Internet survey; (3) that our respondents still were in contact with their high-school peers 18 months after graduation from tertiary education; (4) that few others from the same school, out-side the peer group, completed the survey (as they would dilute the peer effect on our IV); and (5) that assumptions 1–4 would have to hold across a non-trivial proportion of our 567 schools represented. To us, the chance that these requirements are all fulfilled appears too improbable to be of major importance, especially given the fact that peer-effects are partly included in our average school characteristics, which we found to have modest influence in our regressions. To decrease the risk of peer effects even further, we redefined the IV in robustness checks to reflect the average incidence of counseling for students from the same school but who did not gradu-ate in the same year as the respondent. We report results from these IV regressions in the robustness analyses Section.
Results
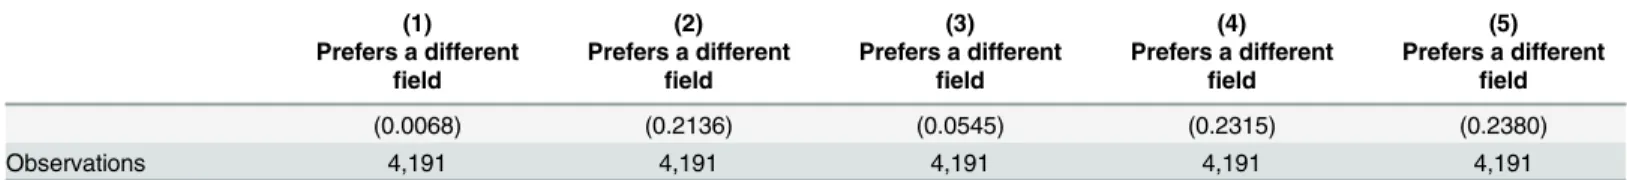
Our main results—presented inTable 6—indicate that in a school which offers one standard deviation more counseling, the probability to prefer a different field of education is reduced by approximately 2 percentage points. The estimate remains robust as we gradually include back-ground characteristics and personality traits of individuals and same school pupils’averages. The statistical power drops slightly between columns (4) and (5) from ap-value of .049 to .063 when we add the squares of the personality traits.
Table 6. The effect of counseling on the quality of educational choice.
(1) (2) (3) (4) (5)
Prefers a different
field
Prefers a different
field
Prefers a different
field
Prefers a different
field
Prefers a different
field
Counseling -0.0226** -0.0227** -0.0225** -0.0228** -0.0219*
(0.0106) (0.0114) (0.0108) (0.0115) (0.0118)
Men (average) -0.0198 -0.0189 -0.0179
(0.0416) (0.0443) (0.0441)
Age (average) -0.0060 -0.0080 -0.0062
(0.0074) (0.0084) (0.0084)
Educ father (average) 0.0094 0.0098 0.0112
(0.0105) (0.0112) (0.0112)
Educ mother (average) -0.0133 -0.0086 -0.0083
(0.0110) (0.0118) (0.0117)
Immigrant (average) 0.1285** 0.0593 0.0529
(0.0550) (0.0601) (0.0598)
Discount rate (average) 0.0001 0.0003 0.0003
(0.0009) (0.0009) (0.0009)
Risk preference (average)
-0.0004 -0.0008 -0.0008
(0.0006) (0.0006) (0.0006)
Locus of control (average)
0.0091 0.0234 0.0215
(0.0233) (0.0247) (0.0246)
Anxiety (average) -0.0478** -0.0300 -0.0292
(0.0207) (0.0220) (0.0219)
Self-perception (average)
-0.0702*** -0.0265 -0.0292
(0.0241) (0.0258) (0.0257)
Self-confidence (average)
-0.0333 -0.0214 -0.0197
(0.0233) (0.0249) (0.0249)
Cognitive ability (average)
-0.0023 -0.0069 -0.0082
(0.0086) (0.0093) (0.0092)
Male 0.0148 0.0172 0.0155
(0.0149) (0.0160) (0.0159)
Age = 21 -0.1284*** -0.1279*** -0.1238***
(0.0435) (0.0436) (0.0434)
Age = 22 -0.1668*** -0.1620*** -0.1581***
(0.0412) (0.0415) (0.0414)
Age = 23 -0.1387*** -0.1337*** -0.1320***
(0.0406) (0.0412) (0.0410)
Age = 24 -0.1456*** -0.1403*** -0.1385***
(0.0407) (0.0414) (0.0412)
Age = 25 -0.1088*** -0.1010** -0.0996**
(0.0416) (0.0427) (0.0425)
Age = 26 -0.1181*** -0.1106** -0.1122**
(0.0434) (0.0446) (0.0445)
Age = 27 -0.1539*** -0.1441*** -0.1449***
(0.0460) (0.0475) (0.0473)
Table 6. (Continued)
(1) (2) (3) (4) (5)
Prefers a different
field
Prefers a different
field
Prefers a different
field
Prefers a different
field
Prefers a different
field
Age = 28 -0.1626*** -0.1505*** -0.1464***
(0.0521) (0.0534) (0.0533)
Age = 29 -0.1641*** -0.1515** -0.1512**
(0.0630) (0.0638) (0.0636)
Age = 30 -0.2640*** -0.2508*** -0.2512***
(0.0692) (0.0715) (0.0712)
Educ father -0.0007 -0.0018 -0.0024
(0.0039) (0.0042) (0.0042)
Educ mother -0.0054 -0.0041 -0.0038
(0.0039) (0.0042) (0.0042)
Middle level sec. school 0.0687*** 0.0702*** 0.0637***
(0.0229) (0.0237) (0.0241)
High level sec. school 0.0609** 0.0662** 0.0616**
(0.0249) (0.0262) (0.0265)
Immigrant 0.0696*** 0.0577** 0.0575**
(0.0225) (0.0249) (0.0248)
Discount rate -0.0001 -0.0002 -0.0005
(0.0003) (0.0003) (0.0012)
Risk preference 0.0002 0.0003 0.0014**
(0.0002) (0.0002) (0.0006)
Locus of control -0.0096 -0.0125 -0.0405**
(0.0081) (0.0087) (0.0198)
Anxiety -0.0188*** -0.0151* 0.0085
(0.0073) (0.0078) (0.0410)
Self-perception -0.0467*** -0.0432*** -0.0338***
(0.0086) (0.0093) (0.0128)
Self-confidence -0.0140* -0.0119 0.0025
(0.0080) (0.0086) (0.0115)
Cognitive ability -0.0020 -0.0010 0.0125
(0.0034) (0.0037) (0.0101)
Discount rate squared 0.0000
(0.0000)
Risk preference squared -0.0000*
(0.0000)
Locus of control squared 0.0098
(0.0063)
Anxiety squared -0.0028
(0.0049)
Self-perception squared 0.0068
(0.0055)
Self-confidence squared 0.0090*
(0.0047)
Cognitive ability squared -0.0019
(0.0013)
Constant 0.2229*** 0.5209** 0.3637*** 0.6506*** 0.5488**
Comparing the OLS and the IV estimate with the variance of counseling (5.8825.882) and the variance of the prediction of counseling in the first stage (1.021.02), gives information about the nature of the bias in the OLS. To this extent, one could compare the ratio of the coef-ficients of the OLS and the IV to the ratio of the variances. If the IV would only correct for measurement error, the ratio of these two variances would equal the ratio of the IV estimate and the OLS estimate. In our case these ratios are not equal, which suggests that counseling is endogenous.
We consider these estimates to be large, especially since counseling is relatively inexpensive. The survey which was held among the counselors indicates that the average time of a counsel-ing session is about 25 minutes per student and per meetcounsel-ing. In comparison, the costs which might be avoided are potentially large for the individual and from society’s point of view since some students who in retrospect would choose a different education may seek employment in a different line of work, others may continue working in the field they chose at the cost of a lower level of utility and/or productivity and others may re-enroll in a different education to correct their choice. In our sample, a low quality choice is correlated with continuing schooling (p-value 0.003). This is in line with results in [2] who, using a different sample, found the indi-cator of low quality of educational choice to be linked with a higher probability of re-enroll-ment in a different field of education at an adult age. For a year of adult education, calculations in [39] indicate a cost of at least€10,000 in individual foregone earnings. However, the need for re-schooling can only partly be addressed by counseling as it may be related to events which are impossible to foresee.
Table 7separates the results for different subgroups. The point estimates of the effect of counseling are much larger for men (-0.048) than for women (-0.010), with the latter also insig-nificantly different from zero. Table E inS2 Fileshows the OLS regressions for the subgroups, overall indicating coefficient values which are insignificant and (or) very close to zero. This dif-fers from earlier evidence, notably from [32] who find counseling to affect females, but not males, in the probability of attending college. A plausible explanation is that, as in many coun-tries, there are strong gender patterns in career choices of low skilled people in the Netherlands, with males choosing between more heterogeneous career alternatives. This could explain the gender difference in estimates. There are many potential reasons for the different gender pat-tern reported in [32]. Their treatment includes mentoring and a cash grant, using observed col-lege enrolments as outcome. As mentioned earlier, the individuals’own assessment of their
Table 6. (Continued)
(1) (2) (3) (4) (5)
Prefers a different
field
Prefers a different
field
Prefers a different
field
Prefers a different
field
Prefers a different
field
(0.0068) (0.2136) (0.0545) (0.2315) (0.2380)
Observations 4,191 4,191 4,191 4,191 4,191
Notes: Standard errors in parentheses, ***p<0.01,
**p<0.05, *p<0.1.
Data source: Supplement survey of the 2004 SIS wave. The dependent variable is a dummy variable (0 = does not prefer a differentfield of education in retrospect, 1 = prefers a differentfield of education in retrospect). Counseling is standardized at the school level as described in the data section. This variable is instrumented with the average amount of counseling by students of the same secondary school. Educ Father and Mother represent the highest level of education that the father or mother graduated from.“average”indicates that school averages have been calculated.
educational choice in our study is a different concept and the time-frame is 6–7 years. [32] sug-gest various mechanisms to explain the gender dissimilarity, and these may differ between our studies. Separate regression estimates for groups with different educational tracks at secondary level display large point estimates for individuals who attended the lowest secondary tracks (-0.042), while the effects for higher educational tracks are smaller and insignificant. The lowest track has the strongest focus on vocational education and students are traditionally recruited from relatively less affluent families. Restricting our sample to individuals with parents who have lower educational attainment than the median yields a significant effect of counseling (-0.038), whereas those whose parents have higher educational attainments than the median are associated with a modest estimate (-0.007, insignificant). The point estimate for individuals with immigrant background is high in absolute terms (-0.051) but there is a lack of precision in the estimates, as well as an insignificant first stage estimate (see Table F inS2 File), presumably due to the smaller sample (N = 413). Analyzing the effects for the separate subgroups simulta-neously using interaction variables, yields significant differences between gender and between the low and the high secondary school tracks (see Table G inS2 File). When excluding immi-grants, our results are similar to those reported inTable 6. In sum, a possible interpretation is that males from relatively low socioeconomic groups drive our overall significant results. This in line with the findings in [30].
Robustness Analyses
In this section, we present results from robustness checks to further check the validity of our IV strategy, complementing our discussions with respect to school endogeneity, and individual endogeneity or peer effects (see the empirical strategy Section above).
First, to assess if some unobserved school specific confounder(s) lead to an overestimation of the effects of counseling in our IV regressions, one may note that if school level factors tend to simultaneously influence counseling and quality of educational choice, one would also expect our observable school characteristics related to family background and pupil personality traits to have some impact on our IV estimates. However, the estimates inTable 6remain remarkably stable as we add explanatory variables, providing little indication that school fac-tors are driving the results.
Table 7. The effect of counseling on the quality of the educational choice by subgroups.
(1) (2) (3) (4) (5) (6) (7) (8) (9)
Women Men Low sec
educ
Middle sec educ
High sec educ
Parents low
Parents high
Immigrants Natives
Counseling -0.0092 -0.0472** -0.0404** -0.0165 -0.0024 -0.0375** -0.0083 -0.0605 -0.0197* (0.0132) (0.0240) (0.0194) (0.0230) (0.0176) (0.0147) (0.0248) (0.1060) (0.0117) Full set of
controls
Incl Incl Incl Incl Incl Incl Incl Incl Incl
Observations 2,650 1,541 1,080 1,653 1,813 1,277 1,492 413 3,778
Notes: Standard errors in parentheses, **p<0.05,
*p<0.1.
Data source: Supplement survey of the 2004 SIS wave. The dependent variable is a dummy variable (0 = does not prefer a differentfield of education in retrospect, 1 = prefers a differentfield of education in retrospect). Counseling is standardized at the school level as described in the data section. This variable is instrumented with the average amount of counseling by students of the same secondary school. A full set of controls (seeTable 6) is included in all regressions.
Second, we have in total information on twelve guidance measures, of which three are strongly and positively correlated with the counseling indicator (significant at a .01 level; these were mentioned in the empirical strategy Section above). Results from IV regressions using other measures of guidance yield no statistically significant estimate on the quality of educa-tional choice. See Table H inS2 Filefor the results. These results are also insignificant for our subgroups. Exceptions are that“people came to talk about their professions”is significant at the 10% level for those with higher educated parents. And“how often did you go to an infor-mation day”is significant at the 5% level for those from the higher track and at the 10% level for immigrants. The other measures of guidance are“Been to educational choice meeting in Utrecht,” “School has subscription to magazine about educational choice,” “Test for educa-tional or professional choice,” “Extended documentation about educations and professions at school,” “I have had personal conversations with a mentor,” “I have spoken with friends about the educational choice,” “I have spoken with my parents about the educational choice,” “I made contact with people working or studying in the fields I thought were interesting,”and“I or my parents contacted a professional educational choice agency”.
Thus, a potential confounding factor must not only correlate with school counseling prac-tices and students’quality of educational choice, but alsonotcorrelate with any of the eleven other measures of guidance at the school level. This is in addition to not correlating with the observable school averages of parents’social background, education and immigrant status, with school averages of pupils’IQ, levels of anxiety and confidence as well as our four other personality traits.
Third, it might appear reasonable to include school fixed effects in our IV framework, either as explanatory variables (included in both the first and the second stage) or as an additional set of (567) instrumental variables (only included in the first stage), as it would explicitly control for school endogeneity. Note however that the first stage predictive power is then enhanced by the counseling incidence of the individuals themselves. This implies an obvious risk of over-identification which leads us back to the original endogeneity problem. As expected, running this estimation produces a coefficient estimate close to the OLS parameter (-.0025,p-value .078). Includingfsas additional covariate, i.e. also included in the second stage regression, yields similar results. Overall, our analyses indicate that unobserved factors at the school level can only account for modest bias, demonstrating support for our key assumption; that the vari-ation in our original IV (Sjt) comes from the counselor and not from the school. When exclud-ing the school fixed effects,Sjtprovides a continuous measure of the probability of seeing a counselor which is not flawed by the endogeneity of the individuals’own decisions.
Another concern may be that, because of the varying size of the samples per school, mea-surement errors make the first stage heteroscedastic with respect to the number of students per school. This is foremost a problem in case the number of students per school responding to our survey is systematically related to the school counseling policy. We address this by interacting our IV with the number of people per school (in line with [40], employing three different speci-fications where we (1) interact the IV with the number of observations from the school (Nsch), (2) interact the IV with above and below median ofNsch(10), and (3) interact the IV with quar-tiles ofNsch(5, 10 and 15).Table 8shows that the effects remain similar.
for the subgroups. There is only a minor change in the first stage coefficient of our IV (from .5651 to .5162), further supporting the hypothesis that peer effects do not drive the estimates.
Mechanisms
Given that counselors affect the quality of educational choice, we next consider if data may assist us to disentangle some of the underlying mechanisms. In the additional survey of the
Table 8. The effect of counseling on the quality of the educational choice taking into account potential heterogeneity with respect to the size of the school.
(1) (2) (3) (4) (5) (6)
Linear Linear Median Median Quartiles Quartiles
Incl same cohort Not incl samecohort Incl same cohort Not incl same cohort Incl same cohort Not incl same cohort
Counseling -0.0190* -0.0222* -0.0228* -0.0253** -0.0177* -0.0212*
(0.0107) (0.0122) (0.0117) (0.0127) (0.0105) (0.0114)
Full set of controls Incl Incl Incl Incl Incl Incl
Observations 4,191 4,165 4,191 4,165 4,191 4,165
Notes: Standard errors in parentheses, **p<0.05,
*p<0.1.
Data source: Supplement survey of the 2004 SIS wave. The dependent variable is a dummy variable (0 = does not prefer a differentfield of education in retrospect, 1 = prefers a differentfield of education in retrospect). Counseling is standardized at the school level as described in the data section. The table presents 3 variants of 2 specifications of the instrument. In the specification“Incl same cohort”the counseling variable is instrumented with the average amount of counseling by students from the same secondary school. In the specification“Not incl same cohort”the variable is instrumented with the average amount of counseling by students from the same secondary school who did not graduate in the same year as the individual. In the Linear variant the instrument is replaced by the instrument, a variable indicating the number of people in a school, and the interaction between these two variables. In the Median variant, the instrument is replaced by the instrument, a dummy variable which has the value 1 if the number of individuals in the school is larger than 10 (the median), and the interaction between these two variables. In the Quartiles variant, the instrument is replaced by the instrument, 3 dummy variables of which thefirst has value 1 if the number of students in the school was between 5 (thefirst quartile) and 10, the second has a value 1 if the number was between 10 and 15 (the third quartile) and the third has value 1 if the number was more than 15, and interactions between the instrument and these dummy variables. A full set of controls (seeTable 6) is included in all regressions.
doi:10.1371/journal.pone.0145378.t008
Table 9. The effect of counseling on the quality of the educational choice using the instrument which excludes students from the same cohort.
(1) (2) (3) (4) (5) (6) (7) (8) (9) (10)
Full sample
Women Men Low sec
educ
Middle sec educ
High sec educ
Parents low
Parents high
Immigrants Natives
Counseling -0.0244* -0.0142 -0.0413* -0.0343 -0.0157 -0.0120 -0.0401** -0.0105 -0.0366 -0.0228* (0.0130) (0.0158) (0.0223) (0.0231) (0.0233) (0.0196) (0.0175) (0.0252) (0.1246) (0.0130) Full set of
controls
Incl Incl Incl Incl Incl Incl Incl Incl Incl Incl
Observations 4,165 2,635 1,530 1,072 1,649 1,798 1,272 1,478 408 3,757
Notes: Standard errors in parentheses, **p<0.05,
*p<0.1.
Data source: Supplement survey of the 2004 SIS wave. The dependent variable is a dummy variable (0 = does not prefer a differentfield of education in retrospect, 1 = prefers a differentfield of education in retrospect). Counseling is standardized at the school level as described in the data section. This variable is instrumented with the average amount of counseling by students from the same secondary school who did not graduate in the same year as the individual. A full set of controls (seeTable 6) is included in all regressions.