Lattice Boltzmann Method of Different BGA
Orientations on I-Type Dispensing Method
Aizat Abas1*, Z. L. Gan1, M. H. H. Ishak1, M. Z. Abdullah2, Soon Fuat Khor1
1School of Mechanical Engineering, Universiti Sains Malaysia, Engineering Campus, 14300 Nibong Tebal, Penang, Malaysia,2School of Aerospace Engineering, Universiti Sains Malaysia, Engineering Campus, 14300 Nibong Tebal, Penang, Malaysia
Abstract
This paper studies the three dimensional (3D) simulation of fluid flows through the ball grid array (BGA) to replicate the real underfill encapsulation process. The effect of different sol-der bump arrangements of BGA on the flow front, pressure and velocity of the fluid is investi-gated. The flow front, pressure and velocity for different time intervals are determined and analyzed for potential problems relating to solder bump damage. The simulation results from Lattice Boltzmann Method (LBM) code will be validated with experimental findings as well as the conventional Finite Volume Method (FVM) code to ensure highly accurate simu-lation setup. Based on the findings, good agreement can be seen between LBM and FVM simulations as well as the experimental observations. It was shown that only LBM is capa-ble of capturing the micro-voids formation. This study also shows an increasing trend in fluid filling time for BGA with perimeter, middle empty and full orientations. The perimeter orienta-tion has a higher pressure fluid at the middle region of BGA surface compared to middle empty and full orientation. This research would shed new light for a highly accurate simula-tion of encapsulasimula-tion process using LBM and help to further increase the reliability of the package produced.
Introduction
The earliest integrated circuits were packaged in ceramic flat packs that is then converted into dual in-line package (DIP). Due to limitations of DIP packaging for use on very-large-scale integration (VLSI) pin counts number, pin grid array (PGA) and leadless chip carrier (LCC) packages are introduced [1]. Historically, ball grid array (BGA) is introduced to overcome the limitations of the PGA technology. The conventional flat packages consist of very thin and closely spaced pins that are easily damaged and require close control of the soldering process.
BGA packages offer more advantages over PGA such as more interconnection pins rather than just perimeter, shorter lead that results in better performance at higher speeds and lower thermal resistance within silicon chip which allows more heat conducted out of the device faster [1]. BGA is attached to the printed circuit board (PCB) through a process called under-filling process [2,3]. Underfill process involves dispensing a controlled amount of material into
a11111
OPEN ACCESS
Citation:Abas A, Gan ZL, Ishak MHH, Abdullah MZ, Khor SF (2016) Lattice Boltzmann Method of Different BGA Orientations on I-Type Dispensing Method. PLoS ONE 11(7): e0159357. doi:10.1371/ journal.pone.0159357
Editor:Marzio Alfio Pennisi, University of Catania, ITALY
Received:September 4, 2015
Accepted:July 1, 2016
Published:July 25, 2016
Copyright:© 2016 Abas et al. This is an open access article distributed under the terms of the
Creative Commons Attribution License, which permits unrestricted use, distribution, and reproduction in any medium, provided the original author and source are credited.
Data Availability Statement:All relevant data are within the paper.
Funding:This work was partly supported by the FRGS grant FRGS/1/2015/TK03/USM/03/2 and Short Term Grant 60313020 from the Division of Research and Innovation, Universiti Sains Malaysia.
a gap between chip and substrate and is found important in protecting and increasing reliabil-ity of the electronic packaging (EP). It can reduce the global thermal expansion, stresses and strain between the silicon chip and substrate. The gap between the chip and silicon has to be completely filled with underfilling mold in order to protect life of the chip assembly [4]. The interaction between underfill mold and solder bumps may induce possible void or air pocket formation and solder bump damaged due to improper selection of underfill material and pro-cessing parameter [2–5]. Therefore, a better understanding on the underfilling process is important and can be achieved through the virtual modeling technique [6,7].
Two main approaches can be considered in simulating the underfill flow propagation; either microscale or macroscale formulation. For the macroscale formulation, for instance finite vol-ume method (FVM) or finite element method (FEM), the domain is discretized into volvol-ume or element that contains a collection of particles (macro scale) in which the physical properties (velocity, pressure and temperature) are represented by the nodal values [8–11]. Whereas in the microscale approach, the medium is assumed to be made up of particles that is continu-ously colliding with each other. Given that the microscale approach can be rather time con-suming since each particle is tracked, a mesoscale method, namely lattice Boltzmann method (LBM), is introduced that considers a collection of particles as a unit [12–14]. The property of the particles collection in LBM is represented by a distribution function. Lattice Boltzmann Method (LBM) approach is actually developed from lattice gases or Bhatnagar-Gross-Krook (BGK) equation [12,15]. LBM considers a volume element of fluid that consist of collection of particles represented by particle velocity distribution function at each grid point. It considers particle distribution at lattice nodes rather than an individual particle. The fluid particles can collide with each other when moving and the moments of the particles population is calculated [16]. To recover the Navier-Stokes formulation from LBM formulation, Chapman-Enskog for-mulation is introduced to formulate LBM population equations in terms of its macro-scale counterpart. LBM describes the space dynamics by probability distributions that are 6-dimen-sional in phase space and this description of molecular level is larger than hydrodynamic level of Navier Stokes. This is because it is not subject to separation of time scale and is able to describe fluid with larger mean free paths. LBM can be used for solving incompressible, time-dependent Navier-Stokes equations and can be represented by complex physical phenomenon such as multiphase flow and chemical interactions between fluid and surrounding [8]. The best feature of LBM compared to other method is its ability to take into account the particle-particle interaction forces via the use of San-Chen interaction strength function, G at microscopic level for multi-phase simulation [17,18]. In addition, the volume of fluid (VOF) multiphase method can be used since it can accurately track flow front due to its ability to directly incorporate sur-face tension in its formulation [19].
that is subsequently lead to unstable flow and incomplete filling in the encapsulation process. Therefore, they suggested that the inlet pressure should be controlled below 0.175 MPa to pre-vent possible occurring of fluctuation phenomena during the encapsulation process. C.Y Khor et al. continued their research by considering the influence of silicon chip thickness on FSI of BGA package encapsulation [22]. The same MpCCI method with FLUENT and ABAQUS is used and they discover that the thickness of the chip has an exponential trend to the maximum deformation and stress. The thin chip will produce the greatest deformation and stress concen-tration on the silicon chip and solder bump. The downward deformation of the middle chip region will decrease the gap height and increase the resistance to the flow. This space will then be filled with voids beneath the deformed chip leading to issues with“pop corning”effect. C.Y Khor et al. also conducted a study regarding the influence of solder bump arrangements on FSI of BGA package encapsulation [21]. They concluded that the full array solder bump array package encounters lower stress and deformation during encapsulation. The deformation was found around the region without the solder bump which is located closer to the inlet gate (C1, C2, C4 and C5) and at the center of the chip (C3). The deformation and stress of silicon chip in C3 for the perimeter arrangement is the highest among all arrangements during the encapsula-tion process. However, highest percentage of void was found in C2 for the perimeter arrange-ment due to deformation at the center region and the crowding of solder bumps [4,23]. To the best knowledge of the authors, limited publications have been found utilizing Lattice Boltz-mann method to simulate problem relating to BGA encapsulation process. However, studies on flow over obstacles relating to the current encapsulation problem have been conducted by various researches.
LBM has been successfully implemented in the simulation of immiscible binary mixture, as shown in the paper by E Orlandini et al. and MR Swift et al. Using collision rules based on the Cahn-Hillard approach which leads to a thermodynamically consistent equilibrium state, three distinct dynamical regimes are observed by E Orlandini, namely above, at and below the critical temperature. The study shows good agreement between simulation results and theoretical pre-dictions for a wide range of parameters [24]. MR Swift et al. describe a lattice Boltzmann scheme which is capable of obtaining an isothermal model of phase separation that can cor-rectly formulate the bulk and the interfacial dynamics at low temperatures [25]. MR Swift et al. later extended his study on the lattice Boltzmann scheme and successfully describe a lattice Boltzmann scheme for the simulation of phase separation in one- and two- dimensional flow. The results are shown to in good agreement with the analytical calculations.
For multiphase flow with large density ratios, HW Zheng et al. constructed a lattice Boltz-mann model that gave better calculation efficiency compared with the previous schemes. The model itself shows good agreement with several numerical results [26]. Bo Yan and Guangwu Yan then proposed a steady-state lattice Boltzmann equation that is independent of time for steady incompressible flow by modifying the traditional LBE. The equation was found appro-priate for simulating steady state Navier-Stokes equation [27].
With the growing trend that the electronic industry moving towards smaller sized package of up to nanoscale, the interparticle interaction became dominant and cannot be overlooked. To complicate matter, the fluid flow will interact directly with the solder balls resulting solder breakage and voids formation. In light of this problem, an accurate simulation that is able pre-dict the sources of error relating to interaction between mold and BGA up to microscale level is required. Using LBM would help to uplift this issue given its ability to recover both formulation in macro- and micro-scale level (meso-scale). This would allow BGA developer to properly place the BGA with appropriate dimension; i.e. pitch and diameter of BGA.
In this paper, the bounce-back formulation is used during the mold flow formulation to account for the one way fluid-structure interaction. The free surface formulation will be used to track the movement of the mold during the encapsulation process. Volume of fluid (VOF) forced flow formulation is then applied to formulate the multi-phase flow regime of the mold and air regions. The free surface region will be tracked as the movement of the flow front comes into contact with the solder balls.
Materials and Methods
Problem description
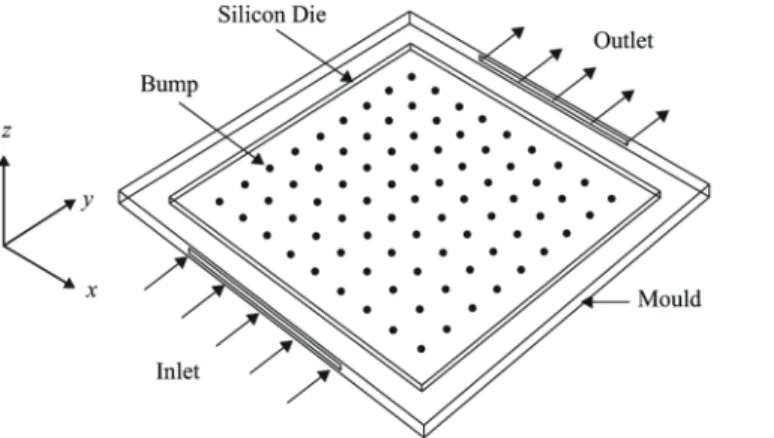
Electronic packaging (EP) is an enclosure and protective features for the electronic products. The process of fabrication, assembly and testing of EP may involve a lot of complex interac-tions with physical phenomena such as temperature, fluid flow, electromagnetic and stress. This project is related to 3D fluid flow simulation through a ball grid array (BGA).Fig 1depicts the schematic diagram of the underfilling process for the flow. The BGA consists of square array of spherical balls across the surface attached to another piece of printed circuit board (PCB). The underfilling process will be simulated using Palabos software that is based on LBM formulation.
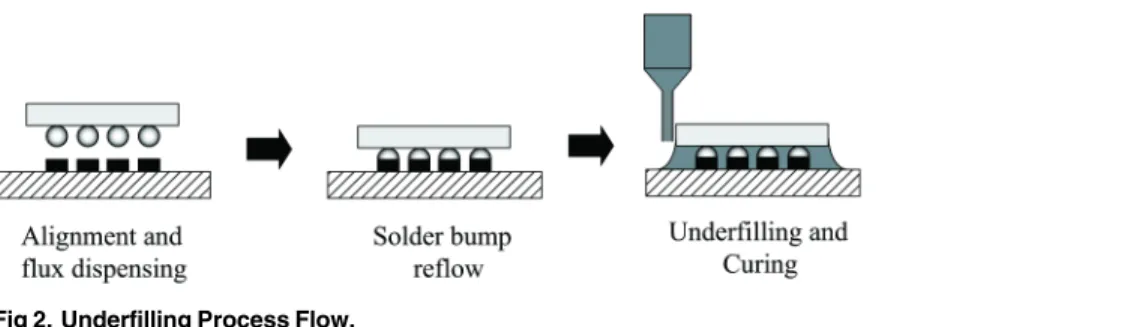
Fig 2shows the capillary underfill process involving the dispensing process of controlling the amount of material into the gap between the chip and substrate. The underfill encapsula-tion of BGA will provide protecencapsula-tion to increase reliability of the electronic package as it can reduce the global thermal expansion, stresses and strains between the silicon chip and sub-strate. The gap between the chip and silicon has to be completely filled with underfill material (underfill material flow correctly) in order to protect the life of the chip assembly [16]. Com-mon issue relating incomplete filling may lead to voids formation.
Fig 1. Schematic diagram of flip-chip boundary conditions.
Experimental setup
Scaled-up experiment is carried out by using plastic beads and transparent Perspex that is 4 times larger than the real ball grid array (BGA) size as it is highly complicated to conduct an experiment on a small scale setup. A test fluid with constant viscosity is also used as the EMC. The purpose of the scaled-up experiment is to validate the simulation result and the conformity of LBM based software, Palabos, in simulating the fluid flows. The experiment is conducted based on the following steps:
1. First, cut the Perspex according to the scaled-up dimension and the plastic beads are stick on the Perspex surface with 3 different types of orientation (perimeter, middle empty and full). The experimental setup of BGA is illustrated inFig 3.
2. As shown inFig 3, two cameras are set up on two different positions where the main camera captures the fluid flow from the top view while the secondary camera captures the fluid flow from the side view. The fluid flows for the experiment is in I-type flow in which the fluid flow enters at one end and exits from the opposite end with the other two sides closed.
3. Both cameras will capture the fluid flow slightly before the start of the injection of fluid into the space of BGA model in order to ensure the video is recorded completely during the whole process.
4. The fluid is constantly injected through the I-line gap on the perimeter BGA model from the inlet until fluid flow completely covers the whole surface of the underfill. The setup is then cleaned and dried to ensure same conditions are applied on all repeated experiments.
5. The experiment is repeated for different orientation of BGA (middle empty and full array). The same fluid injection and video recording step are carried out for the subsequent experiments.
Fig 2. Underfilling Process Flow.
doi:10.1371/journal.pone.0159357.g002
Fig 3. Experimental setup of BGA.
Governing equations
The results shown in this section are formulated using D3Q19 lattice model. The LBM equa-tion can be summarized inEq (1):
fðrþcdt;cþFdt; tþdtÞ fðr;c;tÞ ¼Ω½fðr;c;tÞ ð1Þ
in which the left hand side represents the streaming step. The right hand term denotes the colli-sion term that can be represented using the well-known Bhatnagar-Groos-Krook (BGK) model as given inEq (2).
Ω¼oðfeq fÞ ¼1
tðf
eq fÞ ð2Þ
ωandτdenote the relaxation frequency and time.feqrepresents the equilibrium function that
relates to the lattice arrangement.
The equilibrium function,feq, can be described as:
feqðr;uÞ ¼rw 1þ1 c2 s
ðc:uÞ þ 1
2c4 s
ðc:uÞ2 1
2c2 s
ðu:uÞ
ð3Þ
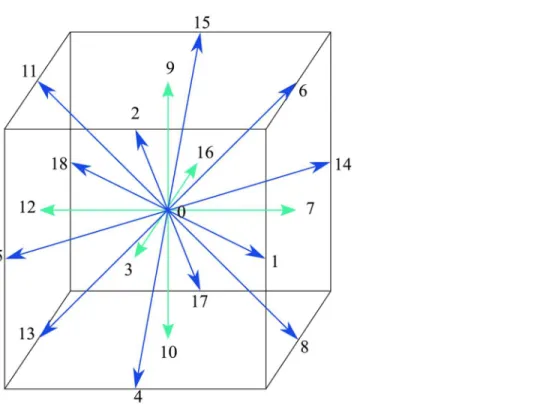
in whichwrepresents weighting function across different lattice links. For the case of D3Q19 lattice model as depicted inFig 4, the weighting functions can be described inTable 1as:
Microscopic velocities for a D3Q19 lattice model is given as:
e0 ¼ ð0;0;0Þ e1;2¼ ð1;0;0Þ e3;4¼ ð0;1;0Þ e5;6¼ ð0;0;1Þ e7 10¼ ð1;1;0Þ e11 14¼ ð1;0;1Þ e15 18¼ ð1;0;1Þ
ð4Þ
Conventional BGK collision model. The underlying theory of LBM is based on the dis-crete Boltzmann equation. Due to the complicated collision term that exist in the right hand side of the Boltzmann equation, it is difficult and burdensome to solve. To ease the computa-tion effort, Bhatnagar, Gross and Krook (BGK) proposed a simplified version of the collision operator [31]. The collision operator can be replaced as
O¼oðfeq fÞ ¼1
tðf
eq fÞ ð5Þ
whereo ¼ 1
t:The coefficientωdenotes the collision frequency andτis the relaxation factor.
feqis the Maxwell Boltzmann equilibrium distribution function. By substituting the approxi-mate collision operator, the discrete Boltzmann equation can be shown as
fið~xþ~ei; tþ1Þ ¼fið~x;tÞ þO ð6Þ
whereiis the index selected between the possible discrete velocity directions andeiis the
The fluid density and macroscopic velocity can be found from the moment of the distribu-tion funcdistribu-tion as below
r¼X
ifi ð7Þ
~u¼1
r
X
ifi~ei ð8Þ
Subsequently, the equilibrium distribution,feq, can be arranged according to the Maxwell-Boltzmann distribution form as
fieqð~x;tÞ ¼wir 1þ3ð~ei~uÞ þ 9
2ð~ei~uÞ 2 3
2~u 2
ð9Þ
Eq 5will replace the commonly used Navier-Stokes equation in CFD simulations. It is also possible to derive N-S equation from Boltzmann equation using the Chapman-Enskog model.
LBM Free-surface multiphase formulation. The volume of fractionbased on the vol-ume-of-fluid (VOF) formulation is introduced to the current LBM setup to distinguish the fluid (mold) and gas domain regions [19]. The VOF value offor each of the fluid and gas Fig 4. 3D Lattice arrangements for D3Q19.
doi:10.1371/journal.pone.0159357.g004
Table 1. Weighting functions for D3Q19.
Model c2s Node no. Weight
D3Q19 1/3 f0 1/3
f1−f6 1/18
f7−f18 1/36
domain can be specified in the range between value of 0 and 1. The fluid mass content in a domain is calculated according to the volume of fractionand the densityρas
M¼r ð10Þ
As the fluid flow during the advection (stream step), dynamic mass tracking technique is implemented to track the gas, fluid and interface and is given by
DmiðxÞ ¼
0; if gas at rþc dt
fiðrþc dtÞ fiðrÞ; if liquid at rþc dt 1
2½φðrÞ þφðrþc dtÞ½fiðrþc dtÞ fiðrÞ; if interface at rþc dt
ð11Þ
8 > > > < > > > :
At the interface, the distribution function must take in to account the neighbouring gas cells as
fiðr c dtÞ ¼feq;iðrg;uðrÞÞ fiðrÞ ð12Þ
in whichρGis related to the gas pressure and the lattice speed of soundcsby
rG¼1
c2 s
PG ð13Þ
To take into account the effect of surface tension during the mold flow propagation, the value ofρGis modified as
rG¼1
c2 s
ðPGþ2skðr;tÞÞ ð14Þ
in whichσis the surface tension of the liquid, andκ(r,t) is the local curvature of the free
sur-face. The surface tension is then calculated according to the following formulation
s¼rgL
2
Bo ð15Þ
withBorepresenting the Bond number,gthe gravity andLis the lattice size. The local
curva-ture points are the calculated using the marching cure algorithm to reconstruct the mold front free-surface [32].
Numerical simulation
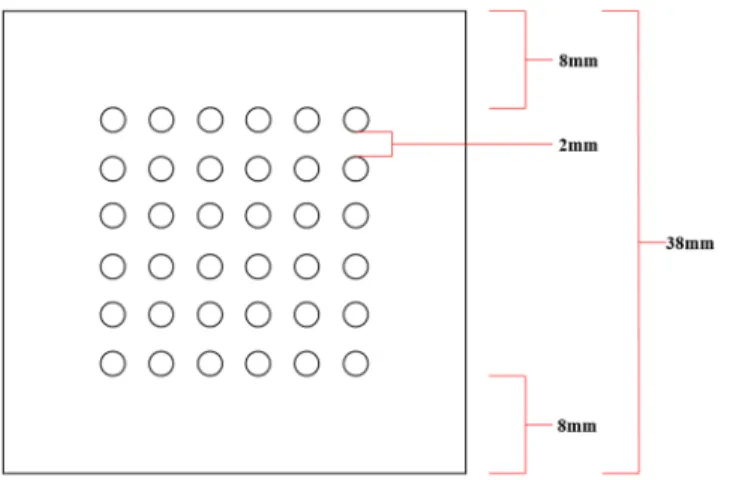
A 3D ball grid array (BGA) package model was created with a scaled-up dimension of four times the real industrial BGA dimensions. Solder bump of diameter of 2mm is placed on top of the surface of BGA with 3 different types of solder bump orientations namely perimeter, mid-dle empty and full orientations. The solder bump counts for these three orientations is as stated inTable 2. The inlet gate has a dimension of 38mm × 2mm whereas the outlet gate has the same dimension but located at the opposite side. The dimension of solder bump arrangement is illustrated in theFig 5. The space between each of the solder bump is 2mm and the distance of solder bump from the edge of BGA is 8mm. In this simulation, the fluid flows via capillary
Table 2. Solder bump counts in different solder bump arrangements/ orientations.
Orientation Perimeter Middle Empty Full
Solder bump number 20 32 36
action without the initial velocities specified. Capillary action is the ability of fluid flow through narrow spaces without the aid of external force, i.e. pressurized flow. The parameters used to model capillary action utilizes the combination of surface tension and adhesive forces between the fluid and container surface.
The boundary conditions of the numerical model is defined as shown inFig 6. Periodic boundary conditions are imposed in the right half of the channel at top and bottom surfaces in order to mimic an“infinite reservoir”. Periodic boundary conditions are also imposed at the two lateral sides such to ensure total mass conservation inside the system. At the solid surface, bounce back boundary conditions for the particle distributions are applied.
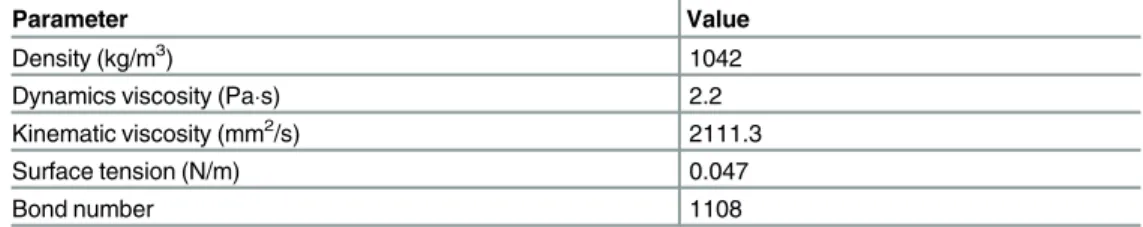
The encapsulant material used is the epoxy-molded compound (EMC) with properties sum-marized inTable 3.
The density of the underfill fluid that is used in this simulation is 1042 kg/m3with dynamic viscosity,μof 2.2Pas as used previously in the underfill encapsulation process [33,34]. The bond number used is 1108 and is calculated using the following formulation:
Bo¼rgL
2
s ¼
1024ð9:81Þð0:072Þ2
0:047 ¼
1108 Fig 5. Solder bump arrangement dimension on simulation model (Full orientation).
doi:10.1371/journal.pone.0159357.g005
Fig 6. LBM boundary conditions setup for periodic and bounce back conditions (①—Periodic
boundary conditions,②—Wall boundary conditions).
The contact angle used to measure contact between wetting (mold epoxy) and non-wetting fluid (air) is set at 80°. The number of D3Q19 lattices on the z-direction of this simulation model is 60 and the time difference,ΔT, of each simulation interval is set at 0.001 s.
Capillary underfill formulation. In capillary underfill (CUF) encapsulation process, interaction occurs between two different fluids, the encapsulant and air, with the BGA surface. The capillary force is formulated to estimate the capillary flow advancements between two par-allel plates as shown inFig 7(a).
Fig 7(b)shows the free body diagram of the CUF flow. The computation of capillary force is derived according to the capillary rise formulation in Eqs(14)and(15).
gfhc
pb2
2 ¼sðpbÞcosy ð16Þ
hc ¼ 2s
bgf ð17Þ
The capillary pressure is defined by the pressure difference between the wetting and non-wettingfluids. The pressure of the non-wettingfluid, air in this case is equivalent to atmo-spheric pressure. It can be expressed as:
DPc¼Pnw Pw ð18Þ
DPc¼gfhc ð19Þ
DPc¼ 2s
b ð20Þ
Table 3. EMC encapsulant material properties.
Parameter Value
Density (kg/m3) 1042
Dynamics viscosity (Pas) 2.2
Kinematic viscosity (mm2/s) 2111.3
Surface tension (N/m) 0.047
Bond number 1108
doi:10.1371/journal.pone.0159357.t003
Fig 7. Capillary between two parallel plates: (a) The schematic diagram and (b) free body diagram.
whereγfis the unit weight offluid, hcis the capillary height,σis the surface tension coefficient
and b is the distance between two parallel plates.
Significant deduction can be made from the formulation, in which the capillary pressure is proportional to surface tension and inversely proportional to the gap height. This indicates that for two parallel plate with smaller gap height, larger capillary pressure would be required to drive the flow. Pressure is reduced by loss due to the existence of solder bumps.
DPt¼DPc DPb ð21Þ
The effect of solder bump should not be neglected, particularly when a high density of solder bumps are present. Infinding the suitable BGA size, the gap height needs to be monitored since no generation of encapsulant can occur if the gap is small.
Results and Discussion
The simulation model in full orientation of this study consists of 36 of solder bumps in square array (6x6) that duplicates the model of 36 bump wafer level chip scale package (WLCSP), MXO3L-1300E-UWG36 and ICE5LP4K-SWG36 [28], as shown inFig 8. Real industry test case is chosen to validate the capability of LBM in the simulation of the encapsulation process.
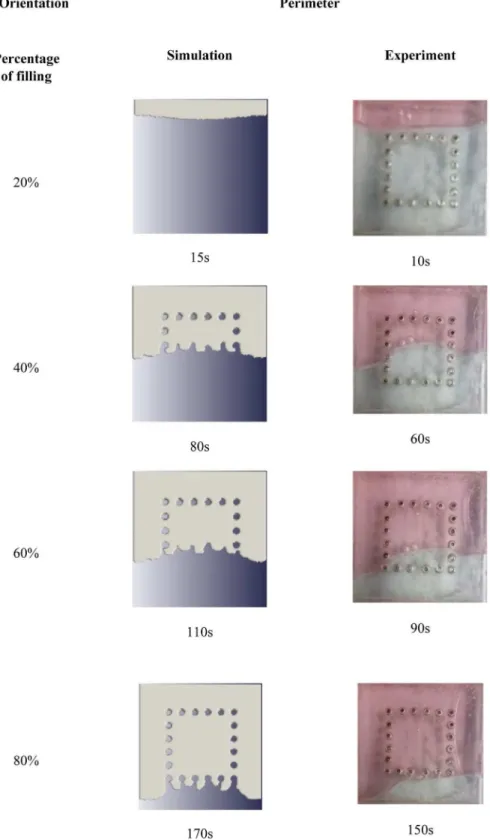
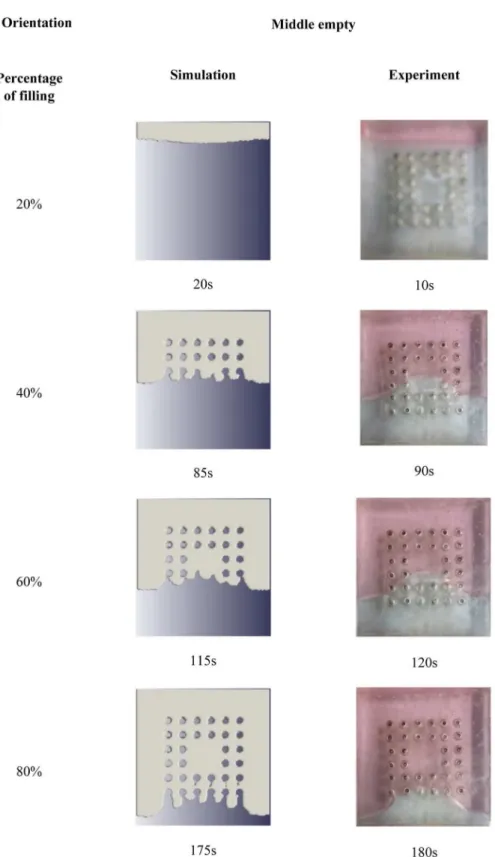
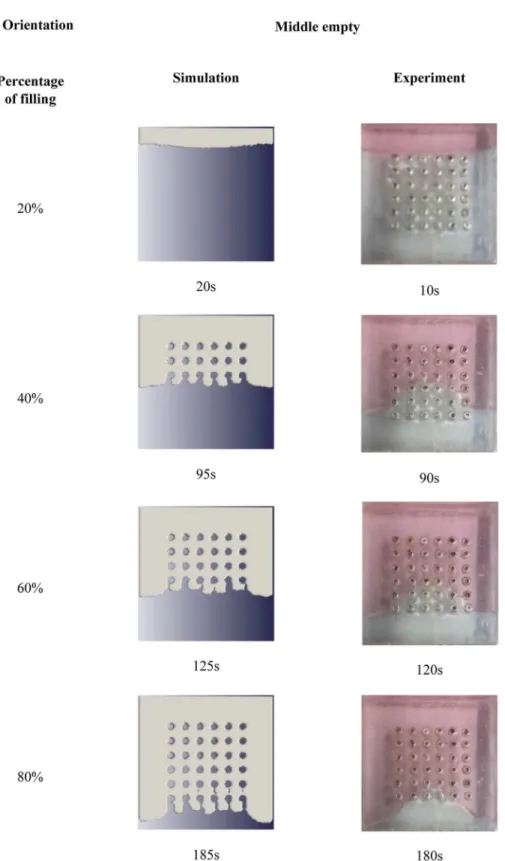
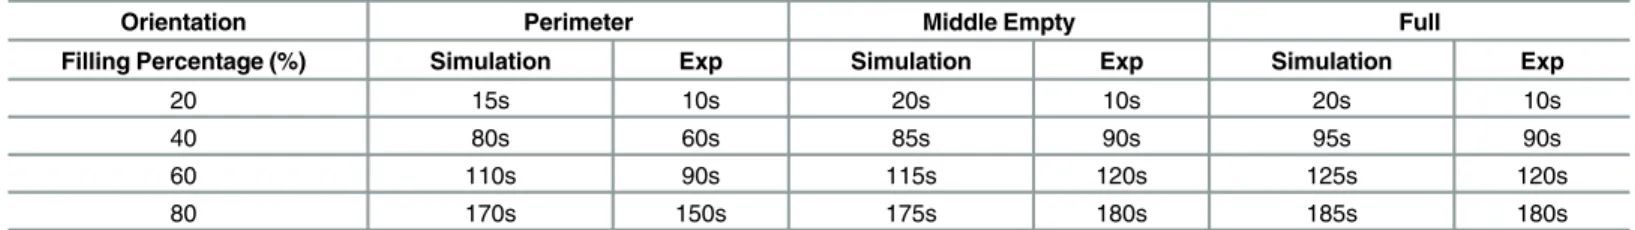
The simulation and experimental data are compared according to their filling percentage and filling time. Figs9,10and11show the comparison between the simulation and experiment result based on filling percentage of 20%, 40%, 60% and 80%. The wettability obtained using LBM simulation might differ slightly since the formulation is based on micro-scale calculation which produces very high detail of the mold flow front propagation. As FVM is a macro-scale method, exact detail of the flow front might not be captured effectively as compared to LBM. The high level of detail produced in LBM simulation is the main reason why micro-defects can be detected with relative ease. Using conventional macro-scale formulation, for instance FVM and FEM, might produce similar wettability however the micro-sized defects might not be cap-tured during the mold flow simulation. The wettability of the flow front can be describe accord-ing to the surface tension value. Higher surface tension corresponds to higher value of Bond number leading to an increase in the voids formation [35].Table 4consists of the times for spe-cific filling percentage for all orientations. Based on the data fromTable 4, a graph is con-structed to compare between simulation and experimental observations for all orientations as shown inFig 12.
Fig 8. Real world WLCSP package [28] and its simulation model.
Fig 9. Comparison between simulation and experiment (Orientation—perimeter).
Fig 10. Comparison between simulation and experiment (Orientation—middle empty).
Fig 11. Comparison between simulation and experiment (Orientation—full).
From Figs9,10and11, the result of simulation and experiment for middle empty and full orientation show good conformity in the flow front displacement whereas for perimeter orien-tation show slight discrepancy in terms of the simulated filling time lag. The conformance with experimental findings are shown by perimeter orientation with exact flow front shape observed compared to the experiment result. In comparison, the graph plotted inFig 12shows that the fluid filling time for the perimeter orientation is much faster compared to the middle empty and full orientations as the number of the solder bumps of perimeter orientation is the least. Do note that the curves for middle empty-experiment and full-experiment coincide each other as they exhibit similar results. The solder bumps surface act as an obstacle to hinder the flow. Therefore, the less number of the solder bumps indicates the faster the fluid flow across the BGA surface (faster underfilling process). In actual implementation, the use of perimeter orien-tation would involve faster package production, however, with relatively less solder ball con-nections, the use of middle empty and full orientations are still important.
The flow front displacement in form these portions are determined for the filling time of 10s, 20s, 30s, 60s, 90s, 120s, 150s, 180s, 210s, 240s, 270s, 300s, 330s and 360s. The data of the flow front fraction displacement for each filling time interval is recorded inTable 5and as depicted inFig 13respectively. For ease of comparison, Figs14,15and16are plotted based on the data recorded inTable 5for comparison of flow front fraction between simulation and Table 4. Data from comparison between simulation and experiment (perimeter, middle empty and full).
Orientation Perimeter Middle Empty Full
Filling Percentage (%) Simulation Exp Simulation Exp Simulation Exp
20 15s 10s 20s 10s 20s 10s
40 80s 60s 85s 90s 95s 90s
60 110s 90s 115s 120s 125s 120s
80 170s 150s 175s 180s 185s 180s
doi:10.1371/journal.pone.0159357.t004
Fig 12. Graph of comparison of simulation and experiment for all orientations.
experimental findings. It was found that the perimeter orientation has the fastest fluid filling time follower by middle empty and full orientations. The flow fronts for perimeter, middle empty and full orientations shows good side by side comparison between simulation and experimental data with slight discrepancy at the initial stage of the flow. The flow front how-ever, tend to conform as the flow progresses. This discrepancy might be attributed to the slight human error in the application of the injected fluid at the beginning of the experiment which could have led to minimal increase of the flow rate at the early stage of the experiment. The Table 5. Flow front fraction comparison between simulation and experiment at different filling time.
Time (s) Perimeter Middle empty Full
Simulation Experiment Simulation Experiment Simulation Experiment
10 1/19 3/19 1/19 2/19 2/19 4/19
20 3/19 4/19 3/19 4/19 4/19 5/19
30 4/19 5/19 4/19 5/19 5/19 6/19
60 7/19 8/19 7/19 8/19 7/19 8/19
90 10/19 11/19 10/19 10/19 9/19 9/19
120 12/19 12/19 12/19 12/19 11/19 11/19
150 14/19 15/19 14/19 14/19 13/19 12/19
180 16/19 16/19 16/19 16/19 15/19 14/19
210 17/19 17/19 17/19 17/19 17/19 15/19
240 18/19 18/19 18/19 18/19 18/19 16/19
270 1 1 1 18/19 1 17/19
300 1 1 1 1 1 18/19
330 1 1 1 1 1 1
360 1 1 1 1 1 1
doi:10.1371/journal.pone.0159357.t005
Fig 13. Width of ball grid array (BGA) surface (19 portions).
overall flow fronts comparison between simulation and experiment have shown high confor-mity thereby proving the capability of LBM in simulating real world encapsulation problems.
Pressure distribution of fluid flow
The pressure distribution is observed in filling percentage of 40%, 60% and 80% for all orienta-tions are depicted in Figs17,18and19respectively. Figs17,18and19show the non-uniform pressure distribution throughout the surface of ball grid array (BGA) due to unbalance fluid flow. The flow front of fluid flow has a curved shape due to obstruction of solder bumps at the Fig 14. Comparison between simulation and experiment by filling time (perimeter).
doi:10.1371/journal.pone.0159357.g014
Fig 15. Comparison between simulation and experiment by filling time (middle empty).
middle of BGA surface which result in the slower fluid flow in the middle than the edge of BGA. The unbalance fluid flow causes the uneven pressure distribution throughout the BGA surface. From the Figs17,18and19, perimeter orientation shows higher pressure at middle portion of BGA compared to the middle empty and full orientation due to the least number of solder bumps support at the middle portion of BGA with perimeter orientation. Less solder bumps in the middle portion of perimeter orientation causes the surface of the BGA to curve downward and reduce the gap fluid flows. Subsequently, this induces high pressure spot at the middle portion. The high pressure fluid flow may lead to unintended defects such as nearby solder bumps damaged and chip deformation. Incidentally, increasing the number of solder bumps reduce the high pressure spot of the fluid flow. The inlet region of the fluid flow also shows high pressure distribution for all 3 different orientations. This is partly due to reverse flow occurring at the contact surface of the front face of the solder bumps.Fig 17shows the example of large pressure fluctuation during the encapsulation process. At 40% filling percent-age, huge pressure variations are shown at the region near the second row. Similarly, these huge pressure variations are mainly caused by reverse flow issue due to continuous injection of the mold causing reduction in velocity of the flow front. This reduction in velocity leads to Fig 16. Comparison between simulation and experiment by filling time (full).
doi:10.1371/journal.pone.0159357.g016
Fig 17. Pressure distribution of fluid flow (Orientation-perimeter).
increase in pressure, resulting high pressure fluctuation at 40% filling. The pressure fluctua-tions however tend to depreciate as the filling percentage increases from 40% to 60%. For 80% filling percentage, similar pressure fluctuation is observed due to the flow front interaction with the final row of the solder bumps. For perimeter orientation as depicted inFig 17, the region of high pressure still exists typically at the solder ball free region. This region could lead to package deformation due to pressure differential.
Pressure distribution of fluid flow
Given that pressure could have detrimental effect in the deformation of the flip chip and solder balls, a probe is placed at the start of the inlet to monitor the fluid flow advancement at the onset of collision with solder bumps. The effect of reverse flow on the pressure distribution is also of interest. Using simulation, a probe is placed at approximately 10% filling percentage as illustrated inFig 20. The same probe is place at the same location for all 3 types of orientation. The plot of pressure variation at the specified probe location over time are depicted in Figs21,
22and23. All three orientations have same graph trend where the pressure is fluctuated at beginning of the fluid flow before 40 seconds and then reaches the steady state around 80 sec-onds. The continuous collisions between the particles in the fluid and the reverse flow lead to the creation of high and low pressures spots. Comparatively, BGA with perimeter and middle empty orientation reaches the steady state around 180 Pa whereas BGA with full orientation reaches the steady state around 190 Pa. It can be say that as the number of solder balls are increased with more reverse flow occurring at each ball, the pressure of the flow also increases steadily.
Fig 18. Pressure distribution of fluid flow (Orientation-middle empty).
doi:10.1371/journal.pone.0159357.g018
Fig 19. Pressure distribution of fluid flow (Orientation-full).
Velocity distribution of fluid flow
The velocity distribution is observed in filling percentage of 40%, 60% and 80% for all orienta-tion (perimeter, middle empty and full) which shown in Figs24,25and26. The flow front of fluid flow has the highest velocity as indicated by red color for all 3 different orientations as illustrated in Figs24,25and26. This is due to the velocity of fluid before the flow front has reached its equilibrium with slight bounce back between fluid molecules. The high velocity fluid has high potential in damaging the solder bumps. Closer look at the vicinity of solder bump, it was clear that the velocity around the solder bumps retain its high velocity value. The phenomena is caused by consistent collision between the incoming fluid and the reflected fluid from near the solder bumps. This occurrence may force the solder balls sideways and in time lead to solder bump breakage. In addition, the non-uniform fluid velocity distribution through-out BGA surface is due to unbalance fluid flow as a result of slightly slower fluid flow in the middle compared to fluid flow rate at the edge.
Fig 20. Position of Probe location in the simulation.
doi:10.1371/journal.pone.0159357.g020
Fig 21. Graph of pressure over time (full) from simulation data.
LBM and FVM comparison
Current, most of the analysis relating to encapsulation process are conducted using FVM based software. Though FVM provide an accurate and reliable simulation in comparison to experi-mental findings [36] detection of micro-defect, i.e. void formation is still relatively difficult to be visualized during the encapsulation process. This voids if not detected earlier could lead to Fig 22. Graph of pressure versus time (middle empty) from simulation data.
doi:10.1371/journal.pone.0159357.g022
Fig 23. Graph of pressure versus time (perimeter) from simulation data.
oxygen to be trapped in the voids. Subsequently, if the package is heated up to certain tempera-ture, the oxygen could ignite leading to“pop corning”effect and package cracking [2].Fig 27
compares the simulation results obtained using FVM compared to LBM based formulation for different filling percentage. In terms of the mold flow propagation, both LBM and FVM formu-lation gave good side by side free surface movement. This agreement shows good potential of LBM in modelling free surface movement compared to the conventional FVM formulation. The detection of void formation however, is not visible in FVM based software. As depicted in
Fig 27, LBM formulation managed to capture the formation of void during the encapsulation process. At 40% and 60% filling percentage, the formation of voids are mostly located at the vicinity of the solder ball due to reverse flow phenomena [35,37]. At 80% filling percentage, the problem of voids formation is more severe and is concentrated at final two rows of the solder balls. In the study by C. S. Lau, the voids formation can be detected by FVM based formulation however, it was seen located only at regions near solder balls. The ability of LBM to simulate the voids formation is attributed to its ability to effectively model and capture multiphase free-surface flow. The voids formation typically occur as a results of interaction between air particles and mold particles. These interactions typically occur at micro-scale level is accounted accu-rately in the LBM formulation. For this reason the voids can be captured and visualized clearly.
It should be noted that FVM seems to capture the retention of the flow front surface much better with relatively less viscous fingering compared to the LBM formulation. FromFig 27, it can be seen that the formation of viscous fingering is apparent in the LBM simulation result as opposed to the FVM simulation result. Viscous fingering is the uneven, finger-like profile formed at the interface of two different fluids due to the difference in viscosity of the fluids. The reason viscous fingering is apparent in LBM simulation but not in FVM simulation is Fig 24. Velocity distribution of fluid flow (Orientation-perimeter).
doi:10.1371/journal.pone.0159357.g024
Fig 25. Velocity distribution of fluid flow (Orientation-middle empty).
Fig 26. Velocity distribution of fluid flow (Orientation-full).
doi:10.1371/journal.pone.0159357.g026
Fig 27. Percentage of volume of fraction (VOF) contour at different filling time for full orientation [37].
partly due to the input parameters used in the FVM simulation, specifically the wall adhesion angle. The pre-set wall adhesion angle is dependent on both the encapsulant material and also the PCB itself and such, further experiments are required to accurately determine this contact angle value. This contact angle value however is not set in the LBM formulation and the viscous fingering is only dependent on the surface tension value as well as the bounce back boundary condition that occurs during fluid to wall contact. In addition, the relatively finer detail due to the particle nature of the LBM formulation, could have contributed to this viscous fingering of the flow front profile. The same argument can used to explain the detection of voids formation that are only visible in the LBM based solver [35]. This viscous fingering however, has minor effect on the filling time, pressure and velocity profile of the flow front.
Conclusion
This study discloses the importance of the solder bump arrangement in fluid flow filling time, pressure distribution and velocity distribution on the ball grid array (BGA). A 3-dimensional simulation model with the dimension of 72mm × 38mm × 15mm is generated using volume of fluid (VOF) method in order to duplicate the fluid flow phenomenon in capillary underfill-ing process. The fluid flow simulation is validated by the experiment and it was proven that LBM is capable of predicting the fluid flow motion during the encapsulation process. Both simulation and experimental findings show that perimeter orientation has fastest flow fol-lowed by BGA with middle empty and full orientations. This is due to relatively less number of solder bumps in BGA with perimeter orientation which hinders the fluid flow. The study also shows non-uniform pressure distribution throughout the encapsulation domain with lower flow rate at middle portion as a results of obstruction by the solder bumps. BGA with perimeter orientation has a higher pressure fluid at the middle of BGA surface compared to the middle empty and full orientations because of less solder bumps support. Less solder bumps support in the middle of BGA surface can cause downward deformation of BGA and reduce gap of fluid flow which induce high pressure at the middle portion. In addition, fluid inlet has high pressure distribution for all 3 different orientations as result of impact created by the incoming fluid from the inlet and reflected fluid from the solder bump. There are high velocity distribution around the solder bump also due to collision between the incoming fluid and reflected fluid from the solder bump. High pressure and velocity of fluid flow will causes unintended defects such as solder bump damage and chip deformation. This paper reveals the significance of solder bumps arrangement in affecting the pressure and velocity distribution which lead to the packaging reliability problems. It was shown that the increase in number of solder bump count reduces the pressure and velocity of the fluid flow. In terms of comparison between FVM and LBM formulation, good agreement can be formed for the mold flow propa-gation. However, only LBM formulation managed to capture the formation of voids. Conse-quently, this yields an increase in reliability of the electronic package. This study also shows the capability of Palabos software in generating fluid flow simulation models. High amount of detail offered by LBM allows accurate prediction of fluid flow problems. Moving forwards, LBM can be seen as a viable alternative to other conventional software to solve microscale electronic packaging problems.
Supplementary Data
Author Contributions
Conceived and designed the experiments: AA ZLG SFK. Performed the experiments: AA ZLG. Analyzed the data: AA ZLG SFK MZA MHHI. Contributed reagents/materials/analysis tools: AA MZA. Wrote the paper: AA ZLG SFK MZA MHHI.
References
1. Ardebili H, Pecht MG. Chapter 3—Encapsulation Process Technology. In: Encapsulation Technologies
for Electronic Applications. Elsevier; 2009. p. 129–79.
2. Gannamani R, Pecht M. An experimental study of popcorning in plastic encapsulated microcircuits. IEEE Trans Components Packag Manuf Technol Part A. 1996; 19(2):194–201.
3. Ardebili H, Pecht MG. Encapsulation Technologies for Electronic Applications. Encapsulation Technol-ogies for Electronic Applications. Elsevier; 2009. 129–179 p.
4. Khor CY, Abdullah MZ, Lau CS, Leong WC, Abdul Aziz MS. Influence of solder bump arrangements on molded IC encapsulation. Microelectron Reliab. Elsevier Ltd; 2014; 54(4):796–807.
5. Ong EES, Abdullah MZ, Khor CY, Leong WC, Loh WK, Ooi CK, et al. Numerical Modeling and Analysis of Microbump Pitch Effect in 3D Ic Package With Tsv During Molded Underfill (Muf). Eng Appl Comput Fluid Mech. 2013; 7(2):210–22.
6. Wang J. The effects of rheological and wetting properties on underfill filler settling and flow voids in flip chip packages. Microelectron Reliab. 2007 Dec; 47(12):1958–66.
7. Wan JW, Zhang WJ, Bergstrom DJ. Recent advances in modeling the underfill process in flip-chip packaging. Microelectronics J. 2007; 38(1):67–75.
8. Zienkiewicz OC, Taylor RL, Zhu JZ. The Finite Element Method: its Basis and Fundamentals. Finite Elem Method its Basis Fundam. 2013;493–543.
9. LeVeque RJ. Finite Volume Methods for Hyperbolic Problems. publisherName Cambridge University Press; 2002.
10. Morgan MA. 1—PRINCIPLES OF FINITE METHODS IN ELECTROMAGNETIC SCATTERING. In:
Morgan MABT-FE and FDM in ES, editor. Oxford: Elsevier; 1990. p. 1–68.
11. Abas A, Abdul-Rahman R. Adaptive FEM with Domain Decomposition Method for Partitioned-Based Fluid–Structure Interaction. Arab J Sci Eng. Springer Berlin Heidelberg; 2015;1–12.
12. Sukop MC, Thorne DT. Lattice boltzmann modeling: An introduction for geoscientists and engineers. Lattice Boltzmann Modeling: An Introduction for Geoscientists and Engineers. 2006. p. 1–174.
13. Luo L-S. Theory of the Lattice Boltzmann Method: Lattice Boltzmann Models for Non-ideal Gases. 2001; 62(4):4982–96.
14. Frisch U, Pazzis D. Lattice as Automata for the Navier-Stokes Equation. Phys Rev Lett. 1986;1505–8.
PMID:10032689
15. Mohammed A. A.. Lattice Boltzmann Method: Fundamentals and Engineering Applications with Com-puter Codes. AIAA Journal. New York: Springer; 2012. 238 p.
16. Bailey C. Numerical modelling for electronic packaging—future requirements. 2005 6th Int Conf
Elec-tron Packag Technol. 2005;5–6.
17. Chen S, Doolen GD. lattice Boltzmann method for fluid flows. Annual Review of Fluid Mechanics. 1998. p. 329–64.
18. He X, Doolen GD. Thermodynamic foundations of kinetic theory and Lattice Boltzmann models for mul-tiphase flows. J Stat Phys. 2002; 107(1–2):309–28.
19. Deepak M. VOF based Multiphase Lattice Boltzmann Method using Explicit Kinematic Boundary Con-ditions at the interface. Georgia Institute of Technology; 2007.
20. Khor CY, Abdullah MZ, Abdullah MK, Mujeebu M a., Ramdan D, Majid MFM a, et al. Numerical analysis on the effects of different inlet gates and gap heights in TQFP encapsulation process. Int J Heat Mass Transf. Elsevier Ltd; 2011 Apr; 54(9–10):1861–70.
21. Khor CY, Abdullah MZ. Analysis of fluid/structure interaction: Influence of silicon chip thickness in moulded packaging. Microelectron Reliab. Elsevier Ltd; 2013 Feb; 53(2):334–47.
22. Khor CY, Abdullah MZ, Che Ani F. Study on the fluid/structure interaction at different inlet pressures in molded packaging. Microelectron Eng. Elsevier B.V.; 2011; 88(10):3182–94.
24. Orlandini E, Swift MR, Yeomans J. A Lattice Boltzmann Model of Binary-Fluid Mixtures. Europhys Lett. 1995; 463.
25. Swift M, Orlandini E, Osborn W, Yeomans J. Lattice Boltzmann simulations of liquid-gas and binary fluid systems. Phys Rev E. 1996; 54(5):5041–52.
26. Zheng HW, Shu C, Chew YT. A lattice Boltzmann model for multiphase flows with large density ratio. J Comput Phys. 2006; 218(1):353–71.
27. Yan B, Yan G. A steady-state lattice Boltzmann model for incompressible flows✩. Comput Math with
Appl. Elsevier Ltd; 2011; 61(5):1348–54.
28. Schmieschek S, Harting J. Contact angle determination in multicomponent lattice Boltzmann simula-tions. Commun Comput Phys. 2001; 9:1165.
29. Gunstensen AK, Rothman DH, Zaleski S, Zanetti G. Lattice Boltzmann model of immiscible fluids. Phys Rev A. 1991; 43(8):4320–7. PMID:9905534
30. Lishchuk S V, Care CM, Halliday I. Lattice Boltzmann algorithm for surface tension with greatly reduced microcurrents. Phys Rev E Stat Nonlin Soft Matter Phys. 2003; 67:036701. PMID:12689196
31. Bhatnagar PL, Gross EP, Krook M. A Model for Collision Processes in Gases. I. Small Amplitude Pro-cesses in Charged and Neutral One-Component Systems. Phys Rev. American Physical Society; 1954 May; 94(3):511–25.
32. Lorensen WE, Cline HE. Marching cubes: A high resolution 3D surface construction algorithm. ACM SIGGRAPH Comput Graph. 1987; 21(4):163–9.
33. Ong EES, Abdullah MZ, Khor CY, Loh WK, Ooi CK, Chan R. Analysis of encapsulation process in 3D stacked chips with different microbump array. Int Commun Heat Mass Transf. Elsevier Ltd; 2012 Dec; 39(10):1616–23.
34. Ong EES, Abdullah MZ, Khor CY, Loh WK, Ooi CK, Chan R. Fluid–structure interaction analysis on the
effect of chip stacking in a 3D integrated circuit package with through-silicon vias during plastic encap-sulation. Microelectron Eng. Elsevier B.V.; 2014 Jan; 113:40–9.
35. Abas A, Ishak MHH, Abdullah MZ, Che Ani F, Khor SF. Lattice Boltzmann method study of bga bump arrangements on void formation. Microelectronics Reliability. Elsevier Ltd; 2015;
36. Khor CY, Abdullah MZ, Lau C-S, Azid I a. Recent fluid–structure interaction modeling challenges in IC
encapsulation–A review. Microelectron Reliab. Elsevier Ltd; 2014 Aug; 54(8):1511–26.
37. Abas A, Abdullah MZ, Ishak MHH, As N, Khor SF. Lattice Boltzmann and Finite Volume Simulations of Multiphase Flow in Bga Encapsulation Process. J Eng Appl Sci. 2015; 10(17):7354–60.
![Fig 8. Real world WLCSP package [28] and its simulation model.](https://thumb-eu.123doks.com/thumbv2/123dok_br/16378004.191664/11.918.300.854.794.1025/fig-real-world-wlcsp-package-simulation-model.webp)