A Domain-Specific Risk-Taking (DOSPERT) scale for adult
populations
Ann-Renée Blais
∗Defence Research and Development Canada Toronto
Toronto, Ontario, Canada
Elke U. Weber
Center for the Decision Sciences
Columbia University
Abstract
This paper proposes a revised version of the original Domain-Specific Risk-Taking (DOSPERT) scale developed by Weber, Blais, and Betz (2002) that is shorter and applicable to a broader range of ages, cultures, and educational levels. It also provides a French translation of the revised scale. Using multilevel modeling, we investigated the risk-return relationship between apparent risk taking and risk perception in 5 risk domains. The results replicate previously noted differences in reported degree of risk taking and risk perception at the mean level of analysis. The multilevel modeling shows, more interestingly, that within-participants variation in risk taking across the 5 content domains of the scale was about 7 times as large as between-participants variation. We discuss the implications of our findings in terms of the person-situation debate related to risk attitude as a stable trait.
Keywords: risk attitude, risk perception, risk taking, personality, psychometric scale.
1
Introduction
People differ in the way they resolve decisions involv-ing risk and uncertainty, and these differences are often described as differences in risk attitude. In the expected utility framework and its variants, including prospect the-ory (Kahneman & Tversky, 1979; Tversky & Kahneman, 1992), such apparent differences in risk attitude are mod-eled by utility functions that differ in shape, with different degrees of concavity (convexity) to explain risk aversion (seeking). Risk attitude is the parameter that differenti-ates between the utility functions of different individuals (e.g., Pratt, 1964) and is intended as nothing more than a descriptive label for the concavity or convexity of the utility function. Popular interpretations of risk attitude, however, often consider it to be a personality trait (We-ber, 1998).
The consideration of risk attitude as a personality trait has undergone a similar development as that of person-ality traits in general. While traits were initially defined as stable (i.e., situation-invariant) personality
characteris-∗These data were collected as part of research contract W7711–03– 7868 for Defence Research and Development Canada Toronto. Por-tions of this work were presented at the Annual Meeting of the Society for Judgment and Decision Making in Vancouver, British Columbia, Canada (November, 2003) and at the Annual International Meeting of the Economic Science Association in Montreal, Québec, Canada (June 2005). Correspondence concerning this article should be addressed to Dr. Ann-Renée Blais, Defence Research and Development Canada Toronto, 1133 Sheppard Ave. West, P.O. Box 2000, Toronto, Ontario, Canada M3M 3B9, Tel: 416–635–2000 ext. 3082, Fax: 416–635–2013, E-mail:[email protected].
tics (Allport & Allport, 1921) that were assumed to be the result of biological differences or early childhood expe-riences (Eysenck & Eysenck, 1985), the empirical obser-vation of low correlations between trait-related behavior in different situations has given rise to more complex def-initions that acknowledge the situational determinants of behavior while preserving generality in the way person-ality traits shape the pattern of behavior across situations (Mischel & Shoda, 1995).
The following two observations have been problematic for the simple expected-utility definition of risk attitude as a personality trait. First, different methods of mea-suring people’s utility functions (and thus risk attitudes) have been shown to result in different classifications of individuals (Slovic, 1964). More importantly, even when using the same assessment method, individuals have not shown themselves to be consistently risk seeking (averse) across different domains and situations, both in labo-ratory studies (Schoemaker, 1990) and managerial con-texts. MacCrimmon and Wehrung (1986, 1990) showed, for example, that managers have different risk attitudes when making decisions involving personal versus com-pany money or when evaluating financial versus recre-ational risks. These problems limit the predictive validity of expected-utility based assessments of risk attitude.
Given the lability of expected-utility based assess-ments of risk attitude, it should not be surprising that measurement scales based upon them have not had much success in predicting people’s choices or behaviors across a range of situations (Bromiley & Curley, 1992). The
served content-specificity of responses suggests that they should not be combined across content domains. Nev-ertheless, the Choice Dilemma Questionnaire (Kogan & Wallach, 1964), a commonly used scale, asks people for probability equivalents in twelve choice dilemmas from different domains of life, which are then combined into a single score that purportedly represents a person’s risk attitude. Despite its obvious deficiencies the scale is still in use, primarily for lack of better alternatives.
Some researchers have recently argued that risk atti-tude may be more usefully conceptualized in the risk-return framework of risky choice imported from fi-nance, for example, the Capital Asset Pricing Model (Markowitz, 1959) and its variants and generalizations (see Bell, 1995; Jia & Dyer, 1997; Sarin & M. Weber, 1993). Psychological risk-return models treat perceived riskiness as a variable that can differ between individuals and as a function of content and context (Weber, 1998). They decompose observed behavior (i.e., apparent risk taking) into an evaluation of benefits and risks as well as a trade-off between perceived benefits and perceived risks, with a person-specific willingness to trade off units of returns for units of risk (i.e., attitude towards perceived risk) that is assumed to be relatively stable across situa-tions and domains (Weber & Hsee, 1998; Weber & Mil-liman, 1997). This provides for multiple ways in which characteristics of the decision maker and/of the situation can affect choices under risk. Apparent risk taking by the same person in two situations might differ, for example, because the decision maker perceives the risks and ben-efits to differ in magnitude in the two domains (e.g., in a recreational vs. a financial decision), while his or her attitude towards perceived risk is basically the same for both domains (Weber & Hsee, 1998; Weber & Milliman, 1997).
Empirical investigations have shown systematic indi-vidual, group, and cultural differences in perceptions of the riskiness of risky choice options (Bontempo, Bottom, & Weber, 1997; Slovic, 1998; Weber, 1988). A smaller number of studies have also documented group differ-ences in the perception of perceived benefits (e.g., John-son, Wilke, & Weber, 2004). After accounting for dif-ferences in the perception of the risk or returns of choice alternatives, however, people’s perceived-risk attitude — defined as their willingness to trade off units of perceived risk for units of perceived return — has shown consider-able cross-group and cross-situational consistency (We-ber, 1998, 2001). The domain-specificity of risk taking thus seems to arise primarily from differences in the per-ception of the risks (and possibly benefits) of choice al-ternatives in different content domains, while the trait (or true attitude towards risk) that shows consistency across situations lies in the evaluation of risk (as it is perceived) as something that is either desirable (i.e., worth giving
up units of return for) or undesirable (i.e., something that needs to be compensated by units of return) (Weber, 2001).
Decision domains in which respondents have shown different degrees of risk taking and different perceptions of risks and benefits include gambling, financial invest-ing, business decisions, and personal decisions (Mac-Crimmon & Wehrung, 1986, 1990). Personal decisions can be broken down into smaller categories that dif-fer in associated goals and concerns (Weber, Ames, & Blais, 2005; Weber & Lindemann, in press), such as health/safety (e.g., seatbelt usage, smoking), social (e.g., confronting one’s coworkers or family members), and ethical decisions (e.g., cheating on an exam, terminating a comatose family member’s life support). One can expect to find differences in the perception of risks and benefits in these different domains of decisions because decisions in these domains score differently on the psychological risk dimensions (e.g., dread, familiarity, controllability) identified by Slovic, Fischhoff, and Lichtenstein (1986) that are known to affect risk perception. Affective reac-tions to risk in these different domains differ as the result of factors such as differential familiarity and controlla-bility. Given recent evidence about the prominence of affective reactions in perceptions of risk (e.g., Slovicet al.’s affect heuristic, 2002; Loewensteinet al.’s risk-as-feelings framework, 2001), individual and domain dif-ferences in subjective perceptions of riskiness should not come as a surprise.
Based on these insights about the diverse set of de-terminants of decisions under risk, Weber, Blais, and Betz (2002) developed a risk-taking scale, the Domain-Specific Risk-Taking (DOSPERT) Scale, that allows re-searchers and practitioners to assess both conventional risk attitudes (defined as the reported level of risk tak-ing) and perceived-risk attitudes (defined as the willing-ness to engage in a risky activity as a function of its perceived riskiness) in five commonly encountered con-tent domains, i.e., ethical, financial (further decomposed into gambling and investment), health/safety, social, and recreational decisions.
Further evidence for the DOSPERT Scale’s construct validity was provided by Zuniga and Bouzas (2005), who found that scores on the health/safety and recre-ational risk-taking subscales significantly predicted es-timated blood alcohol concentrations in Mexican high-school students. Also, Hanoch, Johnson, and Wilke (2006) used the DOSPERT Scale to show that individuals selected to exhibit high levels of risk taking in one content area (e.g., bungee jumpers taking recreational risks) can be quite risk averse in other risky domains (e.g., financial decisions).
A recent review of a large number of instruments that measure risk propensity in healthcare decisions (Harri-son, Young, Butow, Salkeld, & Solomon, 2005) describes the DOSPERT Scale as one of three that are “relevant to a clinical environment as they directly measure risk propensity across a number of everyday situations, in-cluding the propensity to take health-related risks” (p. 10). The DOSPERT Scale is additionally commended for its simultaneous measurement of multiple risk constructs such as risk taking, risk perception, and perceived-risk attitude.
Weberet al.(2002) also used the DOSPERT Scale to provide evidence for the psychological risk-return model of risky choice. They found that, for a given participant, the level of apparent risk taking varied across risk do-mains, yet his (her) domain-specific levels of perceived risk and benefits together explained a significant propor-tion of this variability, and for the great majority of re-spondents, the relationship between apparent risk tak-ing and risk perception across domains was negative or neutral, suggesting perceived-risk aversion. Johnson et al.(2004) obtained similar findings at the aggregate, or mean, level across respondents with a sample of young German adults.
To facilitate the use of the DOSPERT Scale in a broader range of applied settings, the current paper pro-vides a revision of the original scale by Weber et al. (2002) that had been developed and validated for Amer-ican college undergraduates. The revised scale is both shorter (i.e., 30 vs. 40 items) and applicable to respon-dents from a broader set of age groups, cultures, and ed-ucational levels. The revised DOSPERT Scale was ad-ministered to groups of English- and French-speaking North Americans and by doing do, we also contributed a French translation of the scale to the literature. Although the DOSPERT Scale has been translated into several lan-guages (German, Italian, Dutch, and Spanish) and vali-dated in cultures speaking these languages (e.g., Johnson et al., 2004; Zuniga & Bouzas, 2005), a French version was not available yet.
As explained above, to endorse a risk-return approach in assessing apparent risk taking presupposes the involve-ment of various determinants, that is, perceptions of
ben-efits and risk, as well as a more stable component that represents a person’s propensity to favor (or shy away from) an option that he (she) perceives as being risky, which is referred to as a person’s perceived-risk attitude (Weberet al., 2002; Johnsonet al., 2004). Unfortunately, in the present study, perceptions of benefits could not be collected due to time constraints, so the focus here is exclusively on apparent risk taking, perceived risk, and perceived-risk attitude.
More specifically, we hypothesize the following, de-rived primarily from the risk-return model of risky choice, including cross-cultural comparisons (Weber & Hsee, 1998) and the work of Weber et al. (2002): (1) there exists considerable variability in apparent risk tak-ing within and between individuals; (2) more importantly, controlling for perceived risk at the within-individuals (i.e., domain) level results in a significant reduction in this variability and allows for within-individuals consistency in risk attitude; (3) individuals are perceived-risk averse or neutral across both cultures, even though risk perception and risk taking and possibly degree of perceived-risk aversion may differ between cultures.
While our goal is to replicate and extend the findings reported by Weberet al. (2002), we are taking a very different analytic approach by using multilevel model-ing to investigate the relationship between apparent risk taking and perception. To our knowledge, it is the first time this technique is used in the context of psycholog-ical risk-return models of risky choice and in the study of the domain-specificity of apparent risk taking in gen-eral. One of the compelling reasons for using multilevel modeling is that it allows for the decomposition of the to-tal variance in risk taking into various components, and for the quantification and explanation of both within- and between-individuals variation in apparent risk taking.
2
Method
2.1
Materials
The items of the original DOSPERT Scale had been se-lected based on a careful examination of the literature on risk-taking behaviors (e.g., Byrnes, Miller, & Schafer, 1999), including a review of existing risk-taking mea-sures, in an attempt to cover a broad range of risks of different sorts that might be encountered by young adults in Western cultures or people around them (see Weberet al., 2002, for more detail regarding the development of the scale).
new items were added. For example, “Disagreeing with an authority figure on a major issue,” now replaces “Dis-agreeing with your father on a major issue.” Similarly, “Passing off somebody else’s work as your own,” be-comes a more general version of “Plagiarizing a term paper.” The response scale was modified slightly by in-creasing the number of scale points from 5 to 7 and by labeling all of them instead of just the two endpoints in an effort to increase its psychometric quality (Visser, Kros-nick, & Lavrakas, 2000).
Most respondent will not have found themselves in ev-ery one of the situations described by items of the scale or even have the training or background to find themselves in all situations. Nevertheless, they seem to interpret our instructions to “indicate the likelihood that you would en-gage in the described activity or behavior if you were to find yourself in that situation” as implying (in either a real or counterfactual fashion) that they should think of themselves as being in the situation in a way in which engaging or not engaging in the described behavior were both possible or feasible.
The new set of 48 items was administered to 372 English- and 394 French-speaking respondents. Each of the two groups was randomly split into two sub-groups. Data from one of the sub-groups in each culture were an-alyzed in an exploratory manner and resulted in a reduced number of items (Blais & Weber, 2003; Blais, Montmar-quette, & Weber, 2003). Confirmatory factor analyses were conducted on the remainder of the data to inves-tigate the psychometric properties of the revised scale in North American English- and French-speaking adult pop-ulations and to establish whether the hypothesized mea-surement models fit the data within and across groups. Interested readers are referred to Blais and Weber (2006) for more detail.
The risk-taking scale of the 30-item version of the re-vised DOSPERT Scale evaluates behavioral intentions, that is, the likelihood with which respondents might en-gage in risky behaviors originating from five domains of life (ethical, financial, health/safety, social, and recre-ational risks) using a 7-point rating scale ranging from 1 (Extremely Unlikely) to 7 (Extremely Likely).1
Sam-ple items include “Having an affair with a married man/woman” (Ethical), “Investing 10% of your annual income in a new business venture” (Financial), “En-gaging in unprotected sex” (Health/Safety), “Disagree-ing with an authority figure on a major issue” (Social), and “Taking a weekend sky-diving class” (Recreational). Item ratings are added across all items of a given subscale to obtain subscale scores. Higher scores indicate greater risk taking in the domain of the subscale.
For simplicity sake, we refer to the respondents’
self-1The six financial items can be split into three gambling and three
investment items, resulting in narrower constructs.
reported likelihood of engaging in risky behaviors as “risk taking.” Similarly, their gut level assessment of the riskiness of these behaviors is alluded to as “risk per-ception.” Finally, we refer to the language in which the participants completed the DOSPERT by using the la-bel “group” (i.e., the English vs. the French DOSPERT group).
The risk-perception scale evaluates the respondents’ gut level assessment of how risky each behavior is on a 7-point rating scale ranging from 1 (Not at all) to 7 (Ex-tremely Risky). Ratings are again added across all items of a given subscale to obtain subscale scores, with higher scores suggesting perceptions of greater risk in the do-main of the subscale.
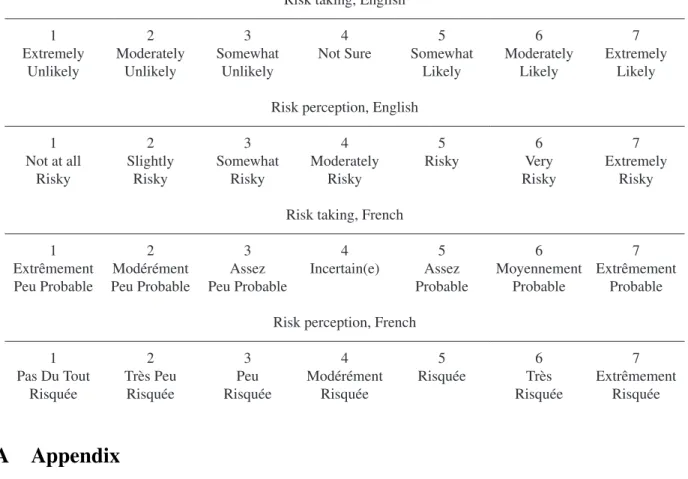
The French version of the DOSPERT Scale was devel-oped for this study using the method of back-translation, where an instrument is translated from the source to the target language, is then independently translated back into the source language, and finally the two versions of the instrument are compared until all discrepancies in meaning are resolved (Brislin, 1970). Both the English and French versions of the complete risk-taking scale and the instructions and rating scale associated with the risk-perception scale are shown in the Appendix.
2.2
Participants and procedure
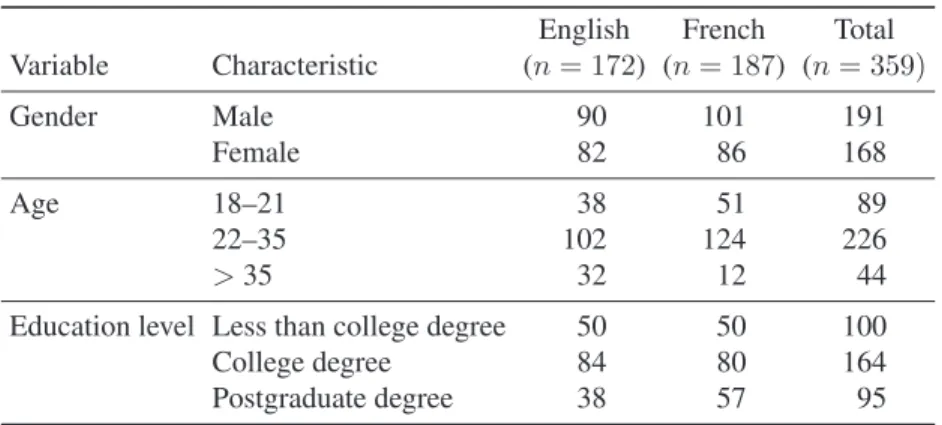
The group completing the DOSPERT Scale in English (i.e., the “English” group) consisted of 172 respondents; most of these participants were aged 22-35 and had com-pleted a college degree. Sharing similar demographic characteristics, the group completing the DOSPERT Scale in French (i.e., the “French” group) consisted of 187 respondents residing in Quebec. A frequency distri-bution of ages and educational levels is provided in Table 1. Chi-square tests showed that the two groups did not differ significantly in gender, age, or educational levels.
The participants in the English group were contacted by advertisements on web bulletin boards and list servers; they completed the web-based survey for 8 USD. The participants in the French group were recruited via e-mail; they filled-out the computer-based survey in a lab-oratory, in groups of about 10-12, for 10 CAD. All of the participants provided demographic background infor-mation first and subsequently completed the scales; they performed the task in about 60-90 minutes.2
2In each group, half of the participants completed the risk-taking
Table 1: Demographic characteristics
English French Total Variable Characteristic (n= 172) (n= 187) (n= 359)
Gender Male 90 101 191
Female 82 86 168
Age 18–21 38 51 89
22–35 102 124 226
>35 32 12 44
Education level Less than college degree 50 50 100
College degree 84 80 164
Postgraduate degree 38 57 95
3
Results
3.1
Overview of the data analytic technique
Given the nature of the data, that is, repeated measure-ments on individuals, multilevel modeling (Goldstein, 1995) was utilized to distinguish within- from between-individuals variability in apparent risk taking. Multi-level models contain variables measured at different lev-els of a hierarchy that consist of lower-level observations nested within higher level(s). Examples include indi-viduals nested within groups, employees within organi-zations, students within schools, or, like in the present study, repeated measurements within individuals. Kreft and De Leeuw (1998) provide an excellent introduction to multilevel modeling that includes a comparison with traditional regression models.
Multilevel modeling is a type of regression model par-ticularly suitable for hierarchical data. In contrast to con-ventional OLS regression models, the equation defining the multilevel model contains more than one error term: one for each level of the hierarchy (e.g., within and be-tween schools). The basic notion in multilevel modeling is that the outcome variable — located at the lowest, most detailed, level — has an individual as well as a group component, as do(es) the predictor variable(s).
In the current study, the first level of analysis is at the repeated-measures level, that is, respondents’ reported apparent risk taking, with five such measures per partic-ipant for a total of 1795 data points; the second level of analysis is at the level of the individual respondent (N = 359). In the models reported below, apparent risk taking is the outcome variable, risk perception is a first-level, within-individuals, predictor, and group member-ship is a second-level, or between-individuals, predictor.
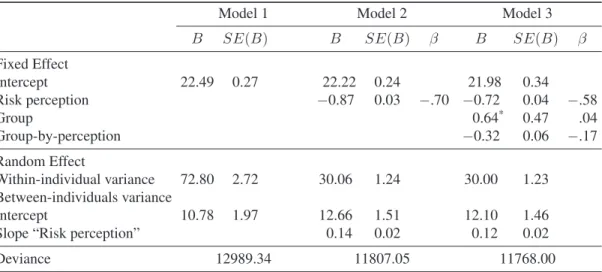
Three nested models are presented here and in Ta-ble 3 that specifically address the three hypotheses out-lined previously. Model 1 is the baseline model and
pro-vides an estimate for the grand risk-taking mean across domains and individuals, as well as a baseline for the estimation of the variance components in comparisons with more complex models. In this model, risk taking at the individual level is expressed by the sum of the (a) grand risk-taking mean (called “Intercept” in Table 3), (b) within-individuals variation around the individual’s mean (“Within-individuals variance”), and (c) between-individuals variation around the grand mean (“Between-individuals variance/Intercept”).
In Model 2, the first-level variable risk-perception is added to Model 1 as a predictor of risk taking.3 The
gression slope coefficient is specified as random to re-flect between-individual differences in the relationship between risk taking and perception. Thus Model 2 also provides estimates of the mean regression slope across individuals (named “Risk perception” in Table 3) and of the between-individuals variation around it (“Between-individuals variance/Slope ‘Risk perception’ ”).
Lastly, Model 3 adds the dichotomous group (called “Group” in Table 3) and group-by-perception (“Group-by-perception”) variables for an explanation of the vari-ability in the intercept and in the risk-perception slope among individuals.
The multilevel models were fit to the data using ML-wiN 1.10.0007 (Rasbash, Browne, Ealy, Cameron, & Charlton, 2001). The likelihood-ratio (named “De-viance” in Table 3) test is used to evaluate the improve-ment in fit between the nested models (Snijders & Bosker, 1999). Each multilevel parameter estimate is divided by its standard error (reported in parenthesis in the results; SE in Table 3) to assess its significance; the resulting value approximates az-distribution (Snijders & Bosker,
1999).
3The risk-perception variable was centered around its grand mean
3.2
Descriptive statistics and group
differ-ences
The items were summed across their respective scales to obtain the scale scores and to compute the descriptive statistics shown in Table 2.4 The internal consistency
es-timates (i.e., Cronbach’s alphas) associated with the 30-item English risk-taking scores ranged from .71 to .86, and those associated with the risk-perception scores, from .74 to .83. The scale intercorrelations varied from .08 to .60 and .19 to .66, for the risk-taking and risk-perception scores, respectively. Weberet al.(2002) reported compa-rable reliability estimates and scale intercorrelations with a sample of undergraduate students suggesting that the scores associated with the revised, shorter scale were, in this sample at least, as internally consistent as those of the original, longer scale.5
A 2 X (5) (Group X Domain) mixed within-subjects factorial analysis of variance showed that the mean (i.e., across individuals) risk-perception level varied significantly between domains, F(3.66, 1307.73) = 360.53, η2
p = .50. The greatest mean level was found
in the health/safety area (M = 28.15, SD = 5.94; or a value of 4.02 on the 7-point scale), whereas the low-est was found in the social domain (M = 17.01, SD= 5.93; or 2.43). Across domains, the participants in the French group reported a greater mean level of perceived risk than did their English counterparts, F(1, 357) = 17.06, η2
p =.05. Post-hoc tests revealed this difference
to be significant in the financial domain (t(306.60) = 3.38, with an effect size ofd = .36), health/safety do-main (t(318.57) = 3.42, d =.36), and recreational do-main (t(320.51) = 3.87, d=.41).6
As shown by a similar analysis of variance, the mean risk-taking level also varied significantly between do-mains, F(3.63,1295.21) = 352.70, η2
p = .50, with
the greatest mean level being in the social area (M =
4Univariate outliers were defined asz-scores greater than 3.29 (p <
.001, two-tailed; Tabachnick & Fidell, 1996) and were replaced with the
next less extreme rating, as recommended by Kline (1998). For all of the scale items, skewness was smaller than 3.0 and kurtosis was smaller than 7.0, thus scores transformations were not required (Kline, 1998). Finally, in order to maximize sample size, sample mean values were inserted whenever individual data points were missing (i.e., < 1% of the individual data points; Cohen and C. Cohen, 1983). The significance level was set atp < .05(two-tailed), except when otherwise noted.
5The internal consistency estimates associated with the 30-item
French risk-taking scores, varied from .57 to .82 (see Table 2), while those associated with the risk-perception scores ranged from .62 to .68. Some of these values fall below the recommended .70 cut off point for research purposes which suggests that the scales may need addi-tional work (Nunally, & Bernstein, 1994). The subscale intercorrela-tions ranged from .05 to .53 and .14 to .50.
6The alpha level was set atp < .05/10 =.005(two-tailed) to
eval-uate the significance of the post-hoct-tests to correct for multiple tests. Cohen’sdis a measure of the effect size; values of 0.20, 0.50, and 0.80 tentatively define “small,” “medium,” and “large” effects, respectively (Cohen, 1988).
32.58, SD = 5.69; or 4.65/7) and the lowest, in the ethical domain, (M = 16.92, SD = 6.59; or 2.42). Across domains, the groups’ mean risk-taking levels were significantly different, F(1,357) = 7.16, η2
p = .02, yet a significant domain-by-group interaction effect,
F(3.63,1295.21) = 2.74,η2
p =.01, qualified this main
effect. Indeed, post-hoc tests revealed that, in the so-cial area, the respondents in the French group reported being more likely to engage in risky behaviors than did the English group respondents (note, however, the small magnitude of this difference). The converse was true in the other four domains, but this difference was signifi-cant only in the ethical, t(357) = 2.92, d = .31, and health/safety,t(357) = 2.88,d=.31, domains.
3.3
Multilevel analyses
The previous analyses of variance showed between-domains differences in mean risk taking and perception levels, yet, given that these analyses do not consider the between-domain differences at the individual level, we now turn to multilevel analyses to specifically address our hypotheses.
Test of the main hypothesis that there exists consid-erable variability in apparent risk taking within and be-tween individuals. Model 1 yielded an estimate of 22.49 (0.27) for the grand mean intercept, corresponding to a value of 3.75 on the 7-point scale (see Table 3). In other words, across both domains and individuals, risk taking was relatively low, that is, below the rating scale mid-point of 4. The baseline model revealed, as predicted, a significant between-individuals variation around this mean risk taking level, yet a substantial proportion (87%) of the total variation in the mean degree of risk taking was found at the within-individuals level.7 This
illus-trates that the respondents were more similar to others (i.e., the grand mean) than they were to themselves (i.e., their own individual mean) in their level of risk taking across domains.
We tested the hypothesis that controlling for perceived risk at the within-individuals (i.e., domain) level results in a significant reduction in this variability and allows for within-individuals consistency in perceived-risk attitude. As shown by a significant deviance test,∆χ2
3= 1182.29, model fit was much improved by adding the random “Risk perception” slope. Indeed, risk perception was, across domains and individuals, a significant predictor of
7The variance at this level includes measurement error. Although the
Table 2: Descriptive statistics.
DOSPERT score Overall (n= 359) English (n= 172) French (n= 187)
M SD α M SD α M SD α
Risk perception
1. Ethical 27.39 6.59 .67 26.70a 6.40 .74 28.03a 4.84 .62
2. Financial 26.53 7.73 .78 25.34a 7.36 .83 27.64b 5.24 .68
3. Health/Safety 28.15 7.43 .70 27.03a 6.62 .74 29.17b 5.04 .62
4. Recreational 27.17 9.14 .75 25.84a 6.94 .79 28.39b 5.34 .68
5. Social 17.01 5.69 .76 16.42a 6.70 .83 17.56a 5.07 .66
Risk taking
1. Ethical 16.92 6.59 .68 17.97a 7.16 .75 15.96b 5.87 .61
2. Financial 19.61 7.73 .80 20.67a 8.51 .83 18.64a 6.81 .77
3. Health/Safety 20.63 7.43 .66 21.80a 7.84 .71 19.56b 6.88 .61
4. Recreational 22.43 9.14 .84 23.01a 9.40 .86 21.90a 8.89 .82
5. Social 32.58 5.69 .70 32.42a 6.44 .79 32.72a 4.92 .57
Note: Minimum and maximum scores are 6 and 42, respectively. Means with differ-ent subscripts differ significantly atp < .005(two-tailed).
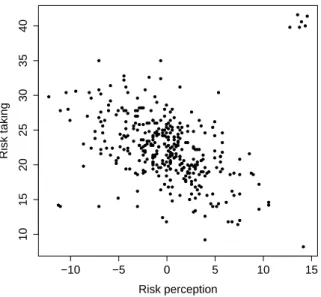
risk taking,B1 = −.87(0.03),β = −.70, and its addi-tion to the model resulted in a sizeable reducaddi-tion (59%) in the within-individuals variation in risk taking, as ex-pected.8 The slope variance, .14 (.02), suggested that the
individuals’ (i.e., across domains) slopes varied signifi-cantly about the mean (i.e., across domains and uals) slope (see Figure 1 for a scatterplot of the individ-uals’ risk taking and perception values across domains). In other words — and not surprisingly — the relationship between risk taking and perception (i.e., perceived-risk attitude) differed significantly among individuals. Ap-proximately 95% of the respondents had slopes between
−0.12 to−1.62, which suggest that most of them were
perceived-risk averse, albeit to various degrees.
In simple terms, at the individual level, the slope es-timate shows how much an individual’s judged level of perceived risk decreases his (her) likelihood of engaging in risky behaviors across domains, reflected by a negative value. Essentially, it represents, for this individual, the impact of perceived risk on risk taking and gets multi-plied with his (her) judged level of perceived risk associ-ated with the behaviors. This impact of perceived risk on risk taking is what we refer to as perceived-risk attitude, and according to the risk-return model of risky choice, it is a stable individual characteristic.
We now turn to the test of the hypothesis that indi-viduals are perceived-risk averse or neutral across both cultures (even though risk perception and risk taking
8For each predictor variable, we show its regression coefficient (B),
the standard error ofBin parentheses, and the standardized regression coefficient (β).
Figure 1: The relationship between risk taking and risk perception at the individual level.
−10 −5 0 5 10 15
10
15
20
25
30
35
40
Risk perception
Risk taking
and possibly degree of perceived-risk aversion may dif-fer between cultures). As shown by a significant de-viance test, ∆χ2
Table 3: Summary of multilevel analyses.
Model 1 Model 2 Model 3
B SE(B) B SE(B) β B SE(B) β
Fixed Effect
Intercept 22.49 0.27 22.22 0.24 21.98 0.34
Risk perception −0.87 0.03 −.70 −0.72 0.04 −.58
Group 0.64* 0.47 .04
Group-by-perception −0.32 0.06 −.17
Random Effect
Within-individual variance 72.80 2.72 30.06 1.24 30.00 1.23 Between-individuals variance
Intercept 10.78 1.97 12.66 1.51 12.10 1.46
Slope “Risk perception” 0.14 0.02 0.12 0.02
Deviance 12989.34 11807.05 11768.00
Note: The fixed effects represent the average intercept and slopes, as in conventional OLS regres-sion analysis. The random effects signify the within-individual, intercept, and slope variances. For each predictor variable, we show its regression coefficient (B), the standard error ofB, and the standardized regression coefficient (β).*p > .05.
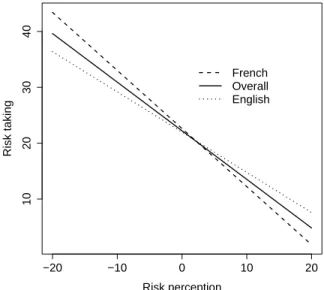
of risk perception on risk taking was stronger (i.e., had a larger negative slope) for the French group than the English group, as confirmed by post-hoc simple slope comparisons (Aiken & West, 1991) and shown in Fig-ure 2. In other words, completing the DOSPERT Scale in French, as opposed to English, was associated with a significantly stronger relationship between risk taking and perception, B = −1.04(0.14), β = −.83, versus B = −.72(0.04), β = −.58. The inclusion of these
two variables in the model resulted in small reductions in between-individuals variations around the grand risk-taking mean (about 4%) and mean risk-perception slope (13%), suggesting that they explained some of the varia-tion in risk taking among respondents.
Because we previously found a tendency for the French group to report, on average, a significantly greater level of risk perception for some risk domains, one might con-clude that the two groups differed in both the impact and perceived magnitude of risk at least in some domains. Post-hoc OLS multiple regression analyses were con-ducted that replicated Model 3 within each risk domain.9
The results of these five regression analyses showed that the group-by-perception interaction was consistently sig-nificant (see Table 4). It thus appears that, in three out
9The alpha level was set atp < .10/15= .0067 (two-tailed) to
evaluate the significance of the post-hoc multiple regression analyses to correct for multiple tests. The familywise significance level was set atp < .10, because the power required to detect interaction effects
in multiple regression analysis is generally low, due to reductions in parameter reliability (Aiken & West, 1991).
of the five risk domains, the French group perceived the magnitude of the risk involved to be significantly greater than did their English-speaking counterparts and gave it significantly greater weight as well. For the other behav-iors, they only showed a significantly stronger impact of perceived risk on risk taking (i.e., had a more risk-averse perceived-risk attitude) than did the respondents complet-ing the English DOSPERT Scale.
4
Summary and conclusions
The paper provides a revised version of the Weberet al. (2002) DOSPERT Scale that is 25% shorter while re-maining stable in terms of its psychometric properties. In addition, it consists of items that are applicable to re-spondents from a broader range of ages, cultures, and ed-ucational levels.
Table 4: Coefficients for the effect of (a) risk perception on risk taking for the French (left) and English (right) groups, and (b) the group-by-perception interaction variable. (*p > .05.)
Variable B SE(B) β B SE(B) β
(a) Risk perception
1. Ethical −0.71 0.09 −.61 −0.09* 0.09 −.08
2. Financial −0.66 0.10 −.55 −0.32 0.09 −.27
3. Health/Safety −0.92 0.09 −.74 −0.28 0.09 −.22
4. Recreational −1.17 0.10 −.80 −0.54 0.10 −.37
5. Social −0.49 0.08 −.51 −0.22 0.07 −.22
(b) Group-by-perception
1. Ethical 0.62 0.12 .42
2. Financial 0.34 0.12 .23 3. Health/Safety 0.64 0.12 .40 4. Recreational 0.63 0.13 .33
5. Social 0.27 0.10 .22
Figure 2: The relationship between risk taking and risk perception as a function of group membership.
−20 −10 0 10 20
10
20
30
40
Risk perception
Risk taking
French Overall English
possibly, perceived benefits) in five risk domains. Our results replicate past research by documenting sig-nificant between-domains differences in the degree of ap-parent risk taking and perceived risk at the mean level of analysis. The multilevel modeling shows, more in-terestingly, that within-participants (i.e., individual-level) variation in risk taking across the five content domains of the scale was about seven times as large as between-participants variation.
The relationship between apparent risk taking and per-ception explained a considerable portion of the
within-individuals variability in apparent risk taking. Across do-mains, respondents were, for the most part, perceived-risk averse or neutral, with some between-individuals variability in perceived-risk attitude. Finally, completing the DOSPERT Scale in French explained some of this variability among respondents, as it was associated with a significantly stronger (i.e., more negative) relationship between apparent risk taking and risk perception across domains.
In summary, we replicated and extended the findings reported by Weberet al.(2002), using a shorter and more broadly applicable scale and a more sophisticated anal-ysis and modeling approach: (1) the level of apparent risk taking varied for a given participant across the five risk domains; (2) this within-individuals variability was, to a great extent, explained by a corresponding within-individuals variability in the degree of perceived risk; (3) for the great majority of respondents, the relationship be-tween apparent risk taking and risk perception across do-mains was negative or neutral.
A potential concern with the results of this study is that they are inflated by the presence of common source vari-ance. Because both apparent risk taking and perception were self-reported (using rating scales), one may question whether the relationship between these variables is spu-riously inflated, yet this is a well-known limitation, com-mon to all survey research. Similarly, like all such corre-lational results, the associations should not be interpreted as causal effects, despite our use of causal language (e.g., “predictor”).
(which is a function of both uncertainty and aversive-ness of consequences) and perceived benefits, which can and do seem to vary between domains. With respect to the reasons for why perceptions of risk or benefit might differ between domains, we are agnostic and encourage additional work on that topic.10 Previous work suggests
that both differences in material and psychological con-sequences will be involved, leaving room for both conse-quentialist reasoning and affective reactions.
While self-reports of the likelihood of risk taking in hypothetical decision situations on subscales of the DOSPERT scale have been found to correlate with real-world risk taking in a variety of settings (Hanochet al., 2005; Zuniga & Bouzas, 2005), it will be interesting to see how such domain-specific self-reports of risk taking, risk and benefit perceptions, and inferred perceived-risk attitude compare to recent behavioral measures of risk taking and risk attitude, such as the Balloon Analogue Risk Task (BART) developed by Wallsten, Pleskac, and Lejuez (2005).
We urge care in the interpretation of differences in the two cultural groups, reported in this paper. We did not attempt to explain why the groups differed in risk perception, risk taking, and perceived-risk attitude when they did, as we felt such explanations were not warranted given the exploratory nature of the comparison. The two groups might differ simply because of methodological or procedural differences in the data collection process. For example, the French group completed the study in a more controlled laboratory setting, whereas the English group took part in an on-line, web-based, study.
Ultimately, the most important finding is that the two groups appeared to be perceived-risk averse or neutral, in line with the prediction derived from the risk-return framework of risky choice. More extensive and theory-based cross-cultural comparisons, such as the ones re-ported in Johnsonet al.(2004) realized with a sample of Germans participants and the comparison between Chi-nese and American respondents reported by Weber and Hsee (1998) are necessary to establish whether individu-als from different cultures and/or speaking different lan-guages differ in apparent risk taking and its various com-ponents, and if so, why.
The final important contribution of this study is made by its data analytic approach. In addition to replicating and extending previous results by Weber et al. (2002), the multilevel analysis allowed us to differentiate be-tween and differentially explain within-individuals (i.e.,
10In Weberet al.(2002), we found, for example, that the
impres-sion management subscale score of the Paulhus’ (1988) social desirabil-ity scale was significantly correlated with the Ethics and Health/Safety Risk-Behavior subscales,rs =−0.51 and−0.34, respectively. That is, the desire to present oneself in a positive way was associated with lower reported likelihoods to engage in risky ethics and health/safety behav-iors.
domain) and between-individuals variability in apparent risk taking. The fact that almost 90% of the total vari-ance in risk taking existed at the domain level is strik-ing, and a result that has not been quantified before, as past research has not separated these sources of variabil-ity in risk taking. This result lends additional support to the importance of studying domain-specific or situa-tional influences on apparent risk taking. Person and sit-uation effects can be modeled in an integrated multilevel framework, and future research should utilize such anal-yses in an effort to integrate situational explanations for within-individuals variability in apparent risk taking into the more complex personality trait approach advocated by Mischel and Shoda (1995).
References
Allport, F. H., & Allport, G. W. (1921). Personality traits: Their classification and measurement. Journal of Ab-normal and Social Psychology, 16, 6–40.
Aiken, L. S., & West, S. G. (1991). Multiple regression: Testing and interpreting interactions. Newbury Park, CA: Sage.
Bell, D. E. (1995). Risk, return, and utility.Management Science, 41, 23–30.
Blais, A.-R., Montmarquette, C., & Weber, E. U. (2003, November). French translation of the Domain-Specific Risk-Taking (DOSPERT) Scale. Poster session pre-sented at the annual meeting of the Society for Judg-ment and Decision Making, Vancouver, Canada. Blais, A.-R., & Weber, E. U. (2003, November). A
Domain-Specific Risk-Taking (DOSPERT) Scale Con-tinued. Poster session presented at the annual meet-ing of the Society for Judgment and Decision Makmeet-ing, Vancouver, Canada.
Blais, A.-R., & Weber, E. U. (2006). Testing in-variance in risk taking: A comparison between An-glophone and Francophone groups. Working paper, Columbia University. Retrieved July 17, 2006, from
https://decisionsciences.columbia.edu/dospert/index.htm. Bontempo, R. N., Bottom, W. P., & Weber, E. U. (1997).
Crosscultural differences in risk perception: A model-based approach.Risk Analysis, 17, 479–488.
Brislin, R. W. (1970). Back-translation for cross-cultural research. Journal of Cross-Cultural Psychology, 1, 185–216.
Bromiley, P., & Curley, S. (1992). Individual differences in risk taking. In. J. F. Yates (Ed.),Risk-taking behav-ior, pp. 87–132. New York: John Wiley.
Cohen, J. (1988). Statistical power analysis for the be-havioral sciences (2nd ed.). Hillsdale, NJ: Earlbaum. Cohen, J., & Cohen, P. (1983). Applied multiple
regres-sion/correlation analysis for the behavioral sciences (2nd ed.). Hillsdale, NJ: Erlbaum.
Columbia University, Center for Decision Sci-ences. (n.d.). The DOSPERT Scale in vari-ous languages. Retrieved June 8, 2006, from
https://decisionsciences.columbia.edu/dospert/index.htm. Eysenck, H. J., & Eysenck, M. W. (1985).
Personal-ity and individual differences: A natural science ap-proach. New York: Plenum.
Goldstein, H. (1995). Multilevel Statistical Models(2nd ed.). New York: John Wiley & Sons.
Hanoch, Y., Johnson, J.G., & Wilke, A. (2006). Do-main specificity in experimental measures and partici-pant recruitment.Psychological Science, 17, 300–304. Harrison, J. D., Young, J. M., Butow, P., Salkeld, G., & Solomon, M. J. (2005). Is it worth the risk? A system-atic review of instruments that measure risk propen-sity for use in the health setting. Social Science & Medicine, 60, 1385–1396.
Jia, J., & Dyer, J. S. (1997). Risk-value theory. Working Paper 94/95–3-4, Graduate School of Business, Uni-versity of Texas at Austin.
Johnson, J. G., Wilke, A., & Weber, E. U. (2004). Be-yond a trait view of risk-taking: A domain-specific scale measuring risk perceptions, expected benefits, and perceived-risk attitude in German-speaking pop-ulations. Polish Psychological Bulletin, 35, 153–172. Kahneman, D., & Tversky, A. (1979). Prospect theory:
An analysis of decision under risk. Econometrica, 47, 263–291.
Kline, R. B. (1998).Principles and practice of structural equation modeling. New York: The Guilford Press. Kogan, N., & Wallach, M. A. (1964). Risk-taking: A
study in cognition and personality. New York: Holt. Kreft, I., & De Leeuw, J. (1998). Introducing Multilevel
Modeling. London: Sage.
Loewenstein, G. F., Weber, E. U., Hsee, C. K., Welch, E. (2001). Risk as feelings. Psychological Bulletin, 127, 267–286.
MacCrimmon, K. R., & Wehrung, D. A. (1986). Tak-ing risks: The management of uncertainty. New York: Free Press.
MacCrimmon, K. R., & Wehrung, D. A. (1990). Char-acteristics of risk taking executives. Management Sci-ence, 36, 422–435.
Markowitz, H. M. (1959).Portfolio selection. New York: Wiley
Mischel, W., & Shoda, Y. (1995). A cognitive-affective system theory of personality: Reconceptualizing situ-ations, dispositions, dynamics, and invariance in
per-sonality structure. Psychological Review, 102, 246– 268.
Nunally, J. C., & Bernstein, I. H. (1994). Psychometric Theory (3rd ed.).New York: McGraw-Hill.
Pratt, J. W., (1964). Risk aversion in the small and in the large.Econometrica, 32, 122–136.
Rasbash, J., Browne, W., Healy, M. Cameron, B. & Charlton, C. (2001).The MlwiN software Package ver-sion 1.10.0007. London: Institute of Education. Sarin, R. K., & Weber, M. (1993). Risk-value models.
European Journal of Operations Research, 70, 135– 149.
Schoemaker, P. J. H. (1990). Are riskpreferences related across payoff domains and response modes? Manage-ment Science, 36, 1451–1463.
Slovic, P. (1964). Assessment of risk taking behavior. Psychological Bulletin, 61, 330–333.
Slovic, P. (1998). Trust, emotion, sex, politics, and sci-ence: Surveying the risk-assessment battlefield. In M. H. Bazerman, D. M. Messck, A. E. Tenbrunsel, & K. A. Wade-Benzoni (Eds.) Environment, ethics and behavior: The psychology of environmental valuation and degradation, pp. 277–313. San Francisco: New Lexington Press.
Slovic, P., Finucane, M., Peters, E. & MacGregor, D. G. (2002). The affect heuristic. In T. Gilovich, D. Griffin, & D. Kahneman, (Eds.),Heuristics and Biases: The Psychology of Intuitive Judgment, pp. 397–420. New York: Cambridge University Press.
Slovic, P., Fischhoff, B., & Lichtenstein, S. (1986). The psychometric study of risk perception. In V. T. Cov-ello, J. Menkes, & J. Mumpower (Eds.),Risk Evalua-tion and Management(pp. 3–24). New York: Plenum Press.
Snijders, T. A. B., & Bosker, R. J. (1999). Multilevel Analysis: An Introduction to Basic and Advanced Mul-tilevel Modeling. London: Sage.
Tabachnick, B. G., & Fidell, L. S. (1996). Using multi-variate statistics (3rd ed.). New York: Harper Collins. Tversky, A., & Kahneman, D. (1992). Advances in prospect theory: Cumulative representation of uncer-tainty.Journal of Risk and Uncertainty, 5, 297–323. Visser, P. S., Krosnick, J. A., & Lavrakas, P. (2000).
Survey research. In H. T. Reis & C. M. Judd (Eds.), Handbook of research methods in social psychology, pp. 223–252. New York: Cambridge University Press. Wallsten, T. S., Pleskac, T. J., Lejuez, C. W., (2005). Modeling a sequential risk-taking task. Psychological Review, 112, 862–880.
Weber, E. U. (1988). A descriptive measure of risk.Acta Psychologica, 69, 185-203.
Re-search from Bayesian Approaches to Normative Sys-tems: Reflections on the Contributions of Ward Ed-wards, pp. 53–64. Norwell, MA: Kluwer.
Weber, E. U. (2001). Personality and risk taking. In N. J. Smelser & P. B. Baltes (Eds.),International encyclope-dia of the social and behavioral sciences(pp. 11274– 11276). Oxford, UK: Elsevier.
Weber, E. U., Ames, D., & Blais, A.-R. (2005). How do I choose thee? Let me count the ways: A textual analy-sis of similarities and differences in modes of decision making in the USA and China. Management and Or-ganization Review, 1, 87–118.
Weber, E. U., Blais, A.-R., Betz, E. (2002). A Domain-specific risk-attitude scale: Measuring risk perceptions and risk behaviors. Journal of Behavioral Decision Making, 15, 263–290.
Weber, E. U., & Hsee, C. K. (1998). Cross-cultural dif-ferences in risk perception but cross-cultural similari-ties in attitudes towards risk.Management Science, 44, 1205–1217.
Weber, E. U. & Lindemann, P. G. (in press). From intu-ition to analysis: Making decisions with our head, our heart, or by the book. In H. Plessner, C. Betsch & T. Betsch (Eds.),Intuition in judgment and decision mak-ing. Mahwah, NJ: Lawrence Erlbaum Associates. Weber, E. U., & Milliman, R. (1997). Perceived risk
at-titudes: Relating risk perception to risky choice. Man-agement Science, 43, 122–143.
Zuniga, A., & Bouzas, A. (2005). Actitud hacia el riesgo y consume de alcohol de los adolescented. Working paper. Retrieved July 17, 2006, from
Table A: Scales used in DOSPERT.
Risk taking, English
1 2 3 4 5 6 7
Extremely Moderately Somewhat Not Sure Somewhat Moderately Extremely
Unlikely Unlikely Unlikely Likely Likely Likely
Risk perception, English
1 2 3 4 5 6 7
Not at all Slightly Somewhat Moderately Risky Very Extremely
Risky Risky Risky Risky Risky Risky
Risk taking, French
1 2 3 4 5 6 7
Extrêmement Modérément Assez Incertain(e) Assez Moyennement Extrêmement Peu Probable Peu Probable Peu Probable Probable Probable Probable
Risk perception, French
1 2 3 4 5 6 7
Pas Du Tout Très Peu Peu Modérément Risquée Très Extrêmement
Risquée Risquée Risquée Risquée Risquée Risquée
A
Appendix
A.1
Domain-Specific Risk-Taking (Adult) Scale — RT scale
For each of the following statements, please indicate the likelihood that you would engage in the described activity or behavior if you were to find yourself in that situation. Provide a rating fromExtremely UnlikelytoExtremely Likely, using the following scale: [Scales are shown in Table A.]
1. Admitting that your tastes are different from those of a friend. (S)
2. Going camping in the wilderness. (R)
3. Betting a day’s income at the horse races. (F)
4. Investing 10% of your annual income in a moderate growth mutual fund. (F)
5. Drinking heavily at a social function. (H/S)
6. Taking some questionable deductions on your income tax return. (E)
7. Disagreeing with an authority figure on a major issue. (S)
8. Betting a day’s income at a high-stake poker game. (F)
9. Having an affair with a married man/woman. (E)
10. Passing off somebody else’s work as your own. (E)
11. Going down a ski run that is beyond your ability. (R)
13. Going whitewater rafting at high water in the spring. (R)
14. Betting a day’s income on the outcome of a sporting event (F)
15. Engaging in unprotected sex. (H/S)
16. Revealing a friend’s secret to someone else. (E)
17. Driving a car without wearing a seat belt. (H/S)
18. Investing 10% of your annual income in a new business venture. (F)
19. Taking a skydiving class. (R)
20. Riding a motorcycle without a helmet. (H/S)
21. Choosing a career that you truly enjoy over a more secure one.11 (S)
22. Speaking your mind about an unpopular issue in a meeting at work. (S)
23. Sunbathing without sunscreen. (H/S)
24. Bungee jumping off a tall bridge. (R)
25. Piloting a small plane. (R)
26. Walking home alone at night in an unsafe area of town. (H/S)
27. Moving to a city far away from your extended family. (S)
28. Starting a new career in your mid-thirties. (S)
29. Leaving your young children alone at home while running an errand. (E)
30. Not returning a wallet you found that contains $200. (E)
Note. E = Ethical, F = Financial, H/S = Health/Safety, R = Recreational, and S = Social.
A.2
Domain-Specific Risk-Taking (Adult) Scale — RP subscale
People often see some risk in situations that contain uncertainty about what the outcome or consequences will be and for which there is the possibility of negative consequences. However, riskiness is a very personal and intuitive notion, and we are interested inyour gut level assessment of how riskyeach situation or behavior is.
For each of the following statements, please indicatehow risky you perceiveeach situation. Provide a rating from Not at all RiskytoExtremely Risky, using the following scale:
A.3
French Domain-Specific Risk-Taking (Adult) Scale — RT subscale
Pour chacune des phrases suivantes, veuillez indiquer laprobabilitéque vous preniez part à l’activité spécifiée ou que vous adoptiez le comportement spécifié si vous vous retrouviez dans la situation décrite.
Veuillez choisir l’une des possibilités qui vont d’Extrêmement peu probableàExtrêmement probableen vous servant de l’échelle suivante:
1. Avouer que vos goûts sont différents de ceux d’un ami.
2. Aller camper en pleine nature.
3. Parier une journée de salaire aux courses de chevaux.
11We modified this item by replacing “prestigious” by “secure” in order to reflect the trade-off between enjoyment and security. We would like
4. Investir 10% de vos revenu annuels dans un fonds mutuel à croissance modérée.
5. Boire abondamment lors d’une activité sociale.
6. Tricher par un montant important dans votre déclaration d’impôt.
7. Être en désaccord avec un symbole d’autorité sur une question importante.
8. Parier une journée de salaire lors d’une partie de poker à enjeu important.
9. Avoir une aventure avec un homme ou une femme marié(e).
10. Présenter le travail de quelqu’un d’autre comme étant le vôtre.
11. Descendre une pente de ski exigeant une habileté plus grande que la vôtre.
12. Investir 5% de vos revenus annuels dans des titres très spéculatifs.
13. Faire de la descente en eau vive au printemps, quand le niveau de l’eau est élevé.
14. Parier une journée de salaire sur le résultat d’un événement sportif.
15. Avoir des relations sexuelles sans protection.
16. Révéler le secret d’un ami à un autre ami.
17. Conduire une voiture sans porter de ceinture de sécurité.
18. Investir 10% de vos revenus annuels dans une nouvelle entreprise.
19. Suivre un cours de parachutisme.
20. Conduire une motocyclette sans casque protecteur.
21. Choisir une carrière qui vous plaît vraiment plutôt qu’une carrière sécuritaire.
22. Dire votre opinion sur une question controversée lors d’une réunion au travail.
23. Vous faire bronzer sans écran solaire.
24. Effectuer un saut à l’élastique (? bungee ?) à partir d’un pont élevé.
25. Piloter un petit avion.
26. Rentrer chez vous à pied le soir dans un quartier peu sécuritaire.
27. Déménager dans une ville éloignée de votre famille.
28. Entreprendre une nouvelle carrière au cours de la mi-trentaine.
29. Laisser vos enfants seuls à la maison pendant que vous faites une course.
30. Ne pas retourner un portefeuille trouvé contenant 200$.
A.4
French Domain-Specific Risk-Taking (Adult) Scale — RP subscale
Les gens perçoivent souvent des risques dans les situations qui comportent de l’incertitude quant à leur conclusion ou à leurs conséquences et pour lesquelles il existe une possibilité de conséquences négatives. Cependant, le degré de risque est un concept très personnel et intuitif, et nous sommes intéressés parvotre évaluation intuitive du niveau de risquede chacun des situations et des comportements suivants. Pour chacune des phrases suivantes, veuillez indiquer le niveau de risque que vous percevezpour chacune des situations.