www.biogeosciences.net/10/7897/2013/ doi:10.5194/bg-10-7897-2013
© Author(s) 2013. CC Attribution 3.0 License.
Biogeosciences
Net global warming potential and greenhouse gas intensity in a
double-cropping cereal rotation as affected by nitrogen and straw
management
T. Huang1, B. Gao1, P. Christie1,2, and X. Ju1
1College of Resources and Environmental Sciences, China Agricultural University, Beijing 100193, China 2Agri-Environment Branch, Agri-Food and Biosciences Institute, Belfast BT9 5PX, UK
Correspondence to:X. Ju ([email protected])
Received: 25 June 2013 – Published in Biogeosciences Discuss.: 8 August 2013
Revised: 30 October 2013 – Accepted: 3 November 2013 – Published: 4 December 2013
Abstract. The effects of nitrogen and straw management on global warming potential (GWP) and greenhouse gas in-tensity (GHGI) in a winter wheat–summer maize double-cropping system on the North China Plain were investigated. We measured nitrous oxide (N2O) emissions and studied net
GWP (NGWP) and GHGI by calculating the net exchange of CO2equivalent (CO2-eq) from greenhouse gas emissions,
agricultural inputs and management practices, as well as changes in soil organic carbon (SOC), based on a long-term field experiment established in 2006. The field experiment includes six treatments with three fertilizer N levels (zero N (control), optimum and conventional N) and straw removal (i.e. N0, Noptand Ncon)or return (i.e. SN0, SNoptand SNcon).
Optimum N management (Nopt, SNopt)saved roughly half of
the fertilizer N compared to conventional agricultural prac-tice (Ncon, SNcon), with no significant effect on grain yields.
Annual mean N2O emissions reached 3.90 kg N2O-N ha−1in
Nconand SNcon, and N2O emissions were reduced by 46.9 %
by optimizing N management of Noptand SNopt. Straw
re-turn increased annual mean N2O emissions by 27.9 %.
An-nual SOC sequestration was 0.40–1.44 Mg C ha−1yr−1 in plots with N application and/or straw return. Compared to the conventional N treatments the optimum N treatments reduced NGWP by 51 %, comprising 25 % from decreas-ing N2O emissions and 75 % from reducing N fertilizer
ap-plication rates. Straw return treatments reduced NGWP by 30 % compared to no straw return because the GWP from increments of SOC offset the GWP from higher emissions of N2O, N fertilizer and fuel after straw return. The GHGI
trends from the different nitrogen and straw management
practices were similar to the NGWP. In conclusion, optimum N and straw return significantly reduced NGWP and GHGI and concomitantly achieved relatively high grain yields in this important winter wheat–summer maize double-cropping system.
1 Introduction
Carbon dioxide (CO2), methane (CH4) and nitrous
ox-ide (N2O) are the three most important greenhouse gases
(GHGs) because of their positive increases in radiative forc-ing and their longevity in the atmosphere (Mosier et al., 2006; IPCC, 2007). Agricultural GHG emissions were es-timated to be 5.1–6.1 Pg (1 Pg=1015 g ) CO2 equivalents (CO2-eq) in 2005, representing 10–12 % of total global
an-thropogenic emissions (Smith et al., 2007). Furthermore, agricultural GHG emissions account for roughly 20 % of the increment in radiative forcing of climate change each year (Cole et al., 1997). The mitigation potential from agriculture (excluding fossil fuel offsets from biomass) was estimated to be about 5.5–6.0 Pg CO2-eq yr−1if global agricultural
tech-niques were improved by 2030 (Smith et al., 2008). There-fore, agricultural ecosystems are not only a very important source of GHG emissions but also present substantial oppor-tunities for mitigation (Snyder et al., 2009).
7898 T. Huang et al.: Net global warming potential and greenhouse gas intensity
Mosier et al., 2006). Many long-term field experiments have indicated that proper fertilization together with straw return can increase soil organic carbon (SOC) content (Huang and Sun, 2006; Mosier et al., 2006; Zhang et al., 2010; Shang et al., 2011). However, these practices may also stimulate N2O emissions by increasing the supply of substrates for
soil nitrifiers and denitrifiers, and the resulting increase in microbial activity may offset the SOC sequestration effects (Pathak et al., 2005). Field practices that change some soil conditions to mitigate one form of GHG emissions may bring about favourable conditions for other forms of emissions and thereby change the overall balance of GHGs (Pathak et al., 2005; Shang et al., 2011; Ma et al., 2013). To measure these overall effects in any given system the concept of net global warming potential (NGWP) was proposed based on the ra-diative properties of all the GHG emissions and carbon fix-ation, expressed as CO2-eq ha−1yr−1, to give an integrated
evaluation of whether the system is positive or negative in terms of CO2-eq (Robertson and Grace, 2004). Furthermore,
in order to measure the magnitude of GHG emissions to pro-duce the same crop yield, another concept, greenhouse gas intensity (GHGI), was introduced and is expressed as the GWP of per unit of crop yield (Mosier et al., 2006). This con-cept can assist in solving the global challenges of increasing food production and concomitantly decreasing emissions. This also raises the important question of the potential for indirect land use change and GWP by clearing carbon-rich natural ecosystems for crop production (Tilman et al., 2002; Foley et al., 2011).
The North China Plain (NCP) covers an area of 35 million hectares and is one of the most important cereal production areas in China (Ding et al., 2011). Winter wheat–summer maize double-cropping rotations are the dominant cropping system in this region, and rational fertilization, irrigation and straw management are key factors for production of rela-tively high target yields, nutrient and water use efficiencies, and sustainable environmental conditions (Chen et al., 2011; Meng et al., 2012). Due to numerous interacting economic, social, and policy factors – e.g low on-farm incomes and high off-farm incomes, poor extension services, and relative low N fertilizer prices through subsidies for N fertilizer manu-facturers over the last two decades – fertilizer N application rates are in general 30 to 60 % above the agronomic or rec-ommended levels, with N application rates of 325 and 263 kg N ha−1for winter wheat and summer maize, respectively, in
conventional farming practice (Ju et al., 2009). The overuse of fertilizer N in the past will inevitably bring about a range of environmental consequences such as N2O emissions (Gao
et al., 2011; Ju et al., 2011), nitrate leaching (Ju et al., 2009), soil acidification (Guo et al., 2010) and air pollution (Liu et al., 2013). Recently, our results have shown that N2O
emis-sions can be reduced by 61.5 % by optimizing N management compared to local farming practice (Ju et al., 2011) and con-sequently reduce emissions of CO2-eq during the
manufac-ture of N fertilizers (Zhang et al., 2013). However, the SOC
content of topsoils on the NCP has increased over the last two decades due to high application rates of synthetic fertilizers and straw return (Huang and Sun, 2006). It remains unclear to what extent NGWP and GHGI can be reduced following optimum N and straw management in this cropping system in comparison with conventional farming practice.
The energy used for irrigation, fuel consumption for farm operations and application of agrochemicals in crop produc-tion systems can also produce large amounts of CO2-eq,
which should be taken into account in the estimation of emission sources contributing to GWP (Mosier et al., 2006; Snyder et al., 2009). In our region the winter wheat must be irrigated (about 400 mm) to ensure relatively high grain yields because the precipitation during the dry growing sea-son represents only 20–30 % of annual rainfall (Meng et al., 2012). Over-exploitation of the groundwater by agriculture for irrigation during the last three decades has lowered the water level (Wang et al., 2002), and the operation of the pumps requires more electricity, which is mostly generated by coal combustion, thus emitting more CO2-eq (Zhang et
al., 2013). The tillage practices developed in the last two decades for this cropping system are also unique, i.e. winter wheat straw mulching and direct seeding of summer maize without tillage, with only annual moldboard ploughing to in-corporate maize straw and sow winter wheat and thus pro-mote SOC sequestration and reduce the amount of fuel re-quired for tillage (Huang et al., 2011) as compared to deep tillage for every crop in the past. Moreover, this cropping sys-tem normally serves as small sink for CH4, and most results
show that CH4uptake is almost 1 kg CH4-C ha−1yr−1(Gao,
2012; Liu et al., 2012; Hu et al., 2013). The unique features of soil and climatic conditions together with the management practices of this double-cropping system make it interesting for us to know the integrated changes in GHG emissions af-ter optimum N and straw management in comparison with conventional farming practice. To our knowledge, few stud-ies have examined the NGWP and/or GHGI of this cropping system (Gao, 2012; Song et al., 2013), and the sources of emissions and carbon fixation were not taken fully into con-sideration in those studies that did, and as such the tradeoffs between the GWP sources and sinks remain to be explored.
The objectives of the present study were to investigate the effects of N application rate and straw return on grain yield, N2O emissions, topsoil SOC sequestration and the tradeoffs
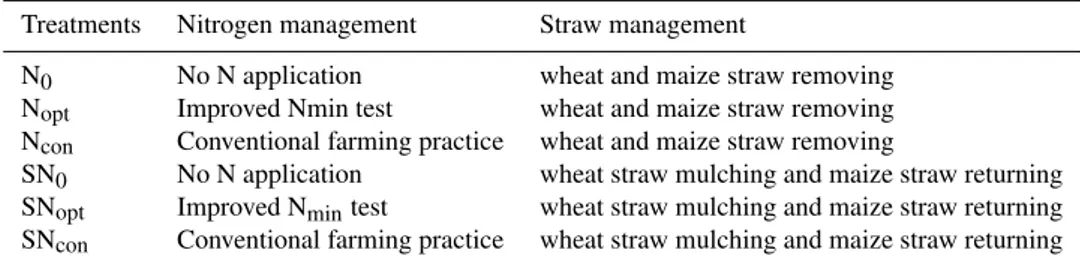
Table 1.Treatments of the long-term field experiment.
Treatments Nitrogen management Straw management
N0 No N application wheat and maize straw removing Nopt Improved Nmin test wheat and maize straw removing Ncon Conventional farming practice wheat and maize straw removing
SN0 No N application wheat straw mulching and maize straw returning SNopt Improved Nmintest wheat straw mulching and maize straw returning SNcon Conventional farming practice wheat straw mulching and maize straw returning
2 Materials and methods
2.1 Description of study site
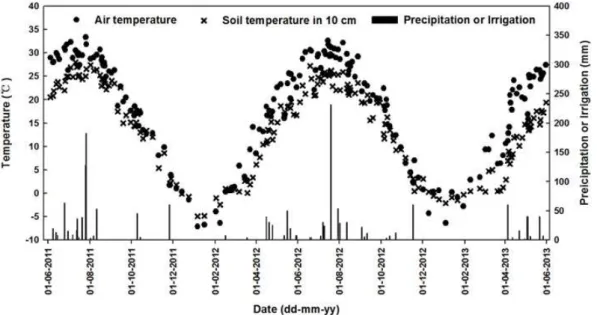
The long-term field experiment started in October 2006 and is located at Shangzhuang Research Station (39◦48′N, 116◦28′E) of China Agricultural University in suburban Bei-jing. The site is at an altitude of 40 m and has a typical continental monsoon climate. Annual cumulative mean tem-perature for days with mean temtem-peratures above 10◦C is 4000–5000◦C and the annual precipitation is 500–700 mm, of which 60–70 % occurs during the period from July to September. The air temperature and soil temperature at 10 cm depth, as well as precipitation and irrigation from June 2011 to June 2013, are shown in Fig. 1. The top 20 cm of the calcareous fluvo-aquic soil has a 28 % clay con-tent, 32 % silt, 40 % sand and a pH of 8.1 (soil : water ratio 1:2.5). The bulk density is 1.31g cm−3 and the SOC con-tent is 7.1 g kg−1, total N 0.8 g kg−1, NO3-N 24.5 mg kg−1,
NH4-N 1.20 mg kg−1, Olsen P 7.8 mg kg−1and available K
76.2 mg kg−1. Detailed information about the study site was presented in a previous paper (Qiu et al., 2012).
2.2 Experimental design
The study involved six treatments with three N levels (zero N (control), optimum and conventional N) with straw re-moval (i.e. N0, Nopt and Ncon)and return (i.e. SN0, SNopt
and SNcon) (Table 1). The design was a completely
ran-domized block with three replicates and each plot was 8 m×8 m=64 m2. Winter wheat was sown at the beginning of October and harvested in the middle of the June of the following year, and summer maize was sown immediately after the wheat and harvested at the end of September. Win-ter wheat received basal and top-dressed N fertilizer. N rates were estimated according to the synchronization of crop N demand and soil N supply in SNoptand Nopt, i.e. the target
crop N demand minus NO3-N in the root zone. The target
crop N demands for basal application and topdressing were 100 and 200 kg N ha−1in the corresponding root zone depths 0–40 and 0–100 cm, respectively (Qiu et al., 2012); in Ncon
and SNcon, N rates followed local conventional farming
prac-tice, i.e. 150 kg N ha−1as basal fertilizer followed by plough-ing and 150 kg N ha−1at the shooting stage of wheat (Zhao
et al., 2006). For summer maize, Ncon was 130 kg N ha−1at
the four- and ten-leaf stages; the target crop N demands for Noptwere 100 and 160 kg N ha−1topdressing at the four- and
ten-leaf stages with the corresponding root zone depths 0– 60 and 0–100 cm, respectively, as recommended by Zhao et al. (2006). Phosphorus and potassium fertilizer were applied only as basal fertilizer for winter wheat at rates of 160 kg P2O5ha−1yr−1and 90 kg K2O ha−1yr−1.
2.3 Field management
The row spacing of winter wheat (var. Nongda 211) was 15 cm and the sowing rate was 225 kg ha−1. The distances
in summer maize (var. Zhengdan 958) between rows and plants were 60 and 25 cm, respectively. Chemical fertilizers and chopped maize straw were incorporated into the soil with tillage at the beginning of October before wheat was sown, and the topdressing N fertilizer was broadcast at the shoot-ing stage of wheat followed by irrigation. N fertilizer was broadcast before a precipitation event or supplementary ir-rigation at the four- and ten-leaf stages of summer maize; the wheat straw was mulched on the soil surface after the wheat harvest. Both maize and wheat straws were mechan-ically chopped into 5–8 cm lengths. All the plants in straw removal plots were cut down manually and removed after yield sampling by hand.
7900 T. Huang et al.: Net global warming potential and greenhouse gas intensity
Fig. 1.Air temperature, soil temperature at 10 cm depth, and precipitation or irrigation in the winter wheat–summer maize double-cropping system from June 2011 to June 2013.
2.4 Topsoil SOC measurement
Soil samples were taken to a depth of 20 cm from each plot before summer maize harvest to determine the SOC con-tent. Each sample was a composite of five subsamples which were taken randomly from each plot. Samples were passed through a 2 mm sieve and visible plant residues were re-moved after air drying. The SOC content was determined with a CN analyser (Vario Max CN, Elementar, Hanau, Ger-many) after soaking for 24 hours in excess of 0.3 mol L−1 HCl solution to remove calcium carbonate (CaCO3) and
oven-drying at 65◦C. We also measured the topsoil (0– 20 cm) bulk density by the cutting-ring method annually after the maize harvest. Because the changes in SOC content at the depths of 20–40 and 40–60 cm were very small over the last 6 years and not significantly different between treatments, we calculated the SOC content in the different treatments only in the top 20 cm of the soil profile.
The topsoil SOC content (g kg−1)increased annually
dur-ing the period 2006–2012 in all treatments except N0(Fig. 2).
Linear regression was therefore used to simulate the annual rate of increase of SOC content for all treatments:
SOC=at+b, (1)
wheretis the duration of the experiment (years since 2006). Annual topsoil organic carbon sequestration rate (SOCSR, kg
C ha−1yr−1)was estimated on the basis of the rate of in-crease of topsoil SOC content (dSOC/dt, g C kg−1yr−1).
Based on Eq. (1), dSOC/dt was estimated by a. Therefore,
SOCSRwas estimated using the following equation:
SOCSR=a×B×20×100, (2)
where B is the bulk density (g cm−3) of the topsoil (0– 20 cm). The numbers 20 and 100 in the equation are the top-soil depth and the area conversion coefficient, respectively. Similarly, the SOCdensity(Mg C ha−1)was calculated by
SOCdensity=c×B×20/10, (3)
wherecandB are the SOC content and bulk density of the topsoil (0–20 cm), respectively. The numbers 20 and 10 in the equation are the topsoil depth and the area conversion coefficient, respectively.
2.5 Plant measurement
The above-ground biomass was measured in the middle of each plot at the winter wheat harvest within an area of 9 m2
(3 m×3 m). Grain and straw samples were oven-dried at 65◦C until constant weight to determine dry matter yield. In
the case of summer maize 14.4 m2(six rows 4 m in length) in the middle of each plot were harvested to determine the fresh ear and stover yields together with ear number. Five plants were randomly sampled from the harvested summer maize and separated into grains, cobs and stover to determine the oven-dried weight at 65◦C. The grain yield of maize was es-timated by deduction of cob yield. The C content in straw was determined using a CN analyser (Vario Max CN, Ele-mentar, Hanau, Germany).
2.6 N2O emission measurements
N2O emissions were measured manually in two cycles
(length×width=60 cm×50 cm and 60 cm×30 cm) made of stainless steel were inserted 20 cm into the soil in ev-ery plot. These collars were removed only once per year before tillage after summer maize harvest and remained in position during the whole crop rotation. Type I chambers (length×width×height=60 cm×50 cm×50 cm) were designed to measure N2O emissions from the winter wheat
season and early stages of summer maize (before 50 cm height). The two parts of type I chambers were sealed by a groove filled with water on the top edge of the base collar. If the maize height surpassed 50 cm, type II chambers (length×width×height=60 cm×30 cm×20 cm) were used, separated vertically into two parts and with a hole (11 cm diameter) drilled in the centre of the top of the chamber (Liu et al., 2012). Type II chambers allowed the cornstalks to pass through the chamber tops, and as a result only the maize roots were covered. The gaps between the type II chambers and cornstalks were sealed using a preser-vative film (1.2 µm-thick polyvinylidene chloride) when the chambers were closed. The two parts of type II chambers were sealed with rubber. Each chamber was covered with a layer of insulating material to minimize any chamber effects on air temperature to <3◦C in the headspace during gas sampling, and the interior of the chamber was equipped with two opposing ventilators to ensure complete mixing of air. The first sample was collected immediately from the chamber roof after the chamber was enclosed. Four gas samples were collected at intervals of 15 min using 50 mL plastic injectors through a three-way stopcock and a Teflon tube connected to the chamber. Daily measurements were carried out for about 10 days and 5 days after fertilizer application and rainfall or irrigation, respectively, for the remaining periods emissions were measured twice per week and once a week when the soil was frozen (Hu et al., 2013). The sampling time was between 08:00 and 11:00 a.m. of the local time.
Gas samples were analysed for N2O using a modified
gas chromatograph (GC; Agilent 6820, USA) equipped with a63Ni-electron capture detector (ECD) running at 350◦C. High-purity dinitrogen (N2, 99.999 %) was used as the
car-rier gas for N2O analysis and 10 % CO2in pure N2as a
make-up gas for ECD (Zheng et al., 2008). The detection limits of the GC were 2 µg N m−2h−1for N2O at a chamber height of
50 cm. The GC was calibrated using known concentrations of mixed gas (0.354 ppm N2O in pure N2) which was
cal-ibrated using standard calibration gases during each group measurement cycle, and air conditioning was used for tem-perature stabilization during measurement in the laboratory to minimize the tendency of the ECD to drift with changing temperature.
Taking into account the methodology for calculating the fluxes of N2O emissions from some previous studies, the
N2O fluxes were calculated by linear regression (Eq. 5) or
nonlinear (Eq. 6) methods according to the changing pattern of gas concentration in the headspace of the closed chamber
(Livingston et al., 2005; Kroon et al., 2008). The flux of N2O
emission (µg N2O-N ha−1d−1)was calculated as
F=k1×P0/P×273/(273+T )×28/22.4×0.5×dc/dt
, (4)
c=a+bt (dc/dt=b), (5)
c=a+bt+dt2(dc/dt=b), (6)
whereF (µg N2O-N m−2h−1) is the flux;k1is a coefficient
(0.001) for dimensional conversion;P0is air pressure
incu-bation (hPa);P is the ambient air pressure at the experimen-tal site (1013 hPa);P0/P ≈1 because the altitude of the
ex-perimental site is 40 m and very close to sea level;T (◦C) is
mean air temperature in the chamber; 28 (g N2O-N mol−1)
is the molecular weight of N2 in the N2O molecule; 22.4
(L mol−1)is the molecular volume at 1, 013 hPa and 273 K; 0.5 (m) is the chamber height; c (ppm) is the concentra-tion of N2O;t (h) is the time of chamber closure; and dc/dt
(µL L−1h−1)is the rate of increase in N2O concentration in
the chamber (Zheng et al., 2008).P0/P×273/(273+T) is
the temperature- and pressure-corrected mole volume. dc/dt
is the slope of the curve which was calculated depending on the pattern of the concentration changes in the headspace (Kroon et al., 2008), anda,banddare constants. N2O
emis-sions are the mean values of three replicates on the sam-pling days. The seasonal or annual cumulative N2O
emis-sions were estimated from the sum of measurement and no-measurement days, which was estimated by linear interpola-tion (Mosier et al., 2006).
2.7 NGWP and GHGI calculation
To better understand climatic effects of the nitrogen and straw management on winter wheat–summer maize double-cropping system, the NGWP and GHGI were calculated us-ing the followus-ing equations.
N2OGWP=N2O
kgN2O−N ha−1
/28×44×298, (7)
where 28 is the molecular weight of N in N2O and 44 is the
molecular weight of N2O. The global warming potentials of
1 kg N2O is equivalent to 298 kg CO2 based on 100 years
(IPCC, 2007). CH4 GWP=CH4
kg CH4−C ha−1
/12×16×25, (8)
where 12 is the molecular weight of C in CH4 and 16 is
the molecular weight of CH4. The global warming
poten-tial of 1 kg CH4 is equivalent to 25 kg CO2 based on 100
years (IPCC, 2007). We adopted CH4uptake by 1 kg CH4
7902 T. Huang et al.: Net global warming potential and greenhouse gas intensity
Fig. 2.Changes in soil organic carbon (SOC) in the top 20 cm of the soil profile in the winter wheat–summer maize double-cropping system from 2006 to 2012. The dashed line and solid line were fitted by linear regression from straw and without straw treatments, respectively.
using the same cropping system and climatic zone (Hu et al., 2013).
SOCGWP=SOCSR
kgC ha−1/12×44, (9) where the 12 is the molecular weight of C in CO2and 44 is
the molecular weight of CO2.
FertilizerGWP=N rate kgNha−1×8.3+P2O5rate
kgP2O5ha−1×1.51+K2O rate
kgK2O ha−1×0.98,
(10)
where the 8.3, 1.51 and 0.98 are the GHG emissions (kg CO2-eq kg−1) associated with the manufacture and
trans-portation of fertilizer N (Zhang et al., 2013), P and K
(Huang et al., 2011), respectively. The date, type and rate of fertilizer applications were recorded in detail.
PowerGWP=Electricity(kW)×time(h)×1.30, (11)
where 1.30 (kg CO2-eq (kW h)−1)is the GHG emission (kg
CO2-eq kg−1)associated with the production and utilization
of electricity by coal combustion (Zhang et al., 2013). The duration of every irrigation event and the pump power con-sumption were recorded in detail. The electricity consump-tion for irrigaconsump-tion was sum of the duraconsump-tion of all irrigaconsump-tion events multiplied by the power of the pump.
FuelGWP=Diesel oil(L)×3.94, (12)
where 3.94 (kg CO2-eq L−1) is the GHG emission (kg
CO2-eq kg−1)associated with diesel oil combustion (Huang
et al., 2011). The energy consumption of every farm machin-ery operation was recorded in detail. The annual consump-tion of diesel oil by farm machinery operaconsump-tions was 64 and
70 L ha−1from the straw removal and return treatments, re-spectively.
PesticideGWP=Pesticide(kg)×18.0, (13)
where 18.0 (kg CO2-eq kg−1) is the GHG emission (kg
CO2-eq kg−1)associated with pesticide production (Huang
et al., 2011). The dates, types and rates of pesticide appli-cation were recorded in detail. The annual consumption of pesticide was 6.2 kg ha−1.
Net-GWP=N2OGWP−SOCGWP−CH4 GWP
+FertilizerGWP+PowerGWP+FuelGWP (14)
GHGI=Net-GWP/grain yield (15)
The units of NGWP and GHGI are kg CO2-eq ha−1yr−1
and kg CO2-eq Mg−1yr−1grain, respectively.
2.8 Statistical analysis
The primary data were examined using Microsoft Excel spreadsheets. The grain yield, seasonal and annual N2O
Table 2.Fertilizer N rates (kg N ha−1)in the winter wheat–summer maize cropping system from October 2006 to September 2012.
Treatmentsa 2006–2007 2007–2008 2008–2009 2009–2010 2010–2011 2011–2012 Mean of six years
WWb SM WW SM WW SM WW SM WW SM WW SM WW SM
N0 0 0 0 0 0 0 0 0 0 0 0 0 0 0
Nopt 86 45 139 132 127 130 150 30 110 212 150 130 127 113 Ncon 300 260 300 260 300 260 300 260 300 260 300 260 300 260
SN0 0 0 0 0 0 0 0 0 0 0 0 0 0 0
SNopt 126 93 181 151 114 132 150 30 107 159 150 130 138 116 SNcon 300 260 300 260 300 260 300 260 300 260 300 260 300 260 aN
0, Noptand Nconrepresent zero-N (control), optimum and conventional N, respectively. S represents straw return.bWW and SM are winter wheat and summer maize; number is mean±
standard error (n=3); N application in 2006–2009 was retrieved from Qiu et al. (2012).
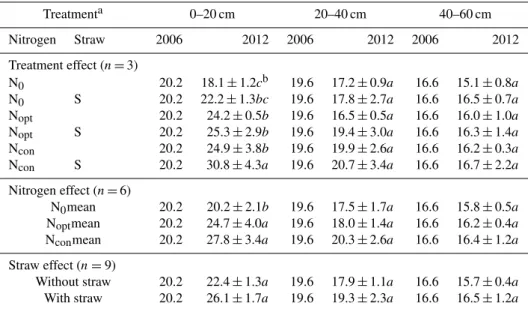
Table 3.Grain yield (dry matter, Mg ha−1)in winter wheat–summer maize double-cropping system from October 2010 to October 2012.
Treatmentsa 2010–2011 2011 2010–2011 2011–2012 2012 2011–2012 2010–2012
Nitrogen Straw WWb SM Annual yield WW SM Annual yield Mean annual yield
Treatment effect (n=3)
N0 2.67±0.38bc 5.43±0.40b 8.10±0.63c 2.39±0.31b 3.94±0.35c 6.33±0.63b 7.21±0.14b N0 S 2.86±0.44b 4.99±0.33b 7.86±0.70c 2.50±0.36b 4.48±0.59c 6.98±0.95b 7.42±0.74b Nopt 5.40±0.59a 6.52±0.84ab 11.92±1.11ab 4.27±0.61a 6.08±0.31b 10.35±0.91a 11.14±0.92a
Nopt S 5.35±0.23a 5.94±0.73b 11.29±0.87b 4.70±0.37a 6.46±0.36ab 11.16±0.60a 11.23±0.60a
Ncon 5.51±0.11a 6.49±1.11ab 12.00±1.14ab 4.53±0.42a 7.29±0.36a 11.82±0.78a 11.91±0.73a
Ncon S 5.65±0.80a 7.85±0.27a 13.50±0.89a 4.58±0.41a 7.30±0.26a 11.88±0.67a 12.69±0.75a
Nitrogen effect (n=6)
N0mean 2.77±0.27b 5.21±0.17b 7.98±0.35b 2.44±0.32b 4.21±0.47c 6.65±0.78c 7.32±0.40c
Noptmean 5.38±0.27a 6.23±0.53ab 11.61±0.56a 4.49±0.16a 6.27±0.21b 10.76±0.37b 11.18±0.19b
Nconmean 5.58±0.35a 7.17±0.43a 12.75±0.66a 4.55±0.41a 7.30±0.31a 11.85±0.72a 12.30±0.66a
Straw effect (n=9)
Without straw 4.53±0.12a 6.15±0.23a 10.67±0.12a 3.73±0.41a 5.77±0.32a 9.50±0.73a 10.09±0.31a With straw 4.62±0.32a 6.26±0.26a 10.88±0.26a 3.93±0.16a 6.08±0.31a 10.01±0.46a 10.44±0.25a
aN
0, Noptand Nconrepresent zero-N (control), optimum and conventional N, respectively. S is straw returning.bWW and SM are winter wheat and summer maize; number is mean±standard error (n=3).cDifferent letters within same column denote significant differences (P <0.05).
3 Results
3.1 N Fertilizer rate and grain yield
The optimum N management (Noptand SNopt)with the
im-proved Nmin test significantly reduced N fertilizer rate to both crops compared to conventional farming practice (Ncon
& SNcon), which saved 54–58, 56–57 and 55–57 % N
fertil-izer in winter wheat, summer maize and annually, respec-tively (Table 2). Application of N (Nopt and Ncon)
signif-icantly increased the grain yield by 20–94 and 38–101 %, respectively, compared to the control, but there was no sig-nificant difference between Nopt and Ncon except in maize
in 2012 (Table 3). Although there was almost 3.7–5.5 Mg C ha−1yr−1straw input in treatments SN
0, SNoptand SNcon,
the yields increased by only 1.8–5.4 % over the two years (four crops) compared to the straw removal treatments. 3.2 Changes in topsoil SOC content and density
The significantly changes in SOC densities in all treat-ments were only found in 0–20 cm, but not in 20–40 and 40–60 cm in 2012 (Table 4). Compared to the N0
treat-ment, long-term N application and straw return gradually increased topsoil SOC content by 2.9–51.9 % (Fig. 2). The topsoil SOC content rate of increase was in the sequence SNcon (0.55 g kg−1yr−1) >Ncon (0.42 g kg−1yr−1) >SNopt
(0.30 g kg−1yr−1) >Nopt (0.25 g kg−1yr−1) >SN0 (0.15
g kg−1yr−1), but with N0decreasing by 0.15 g kg−1yr−1.
In 2012 the topsoil SOC density of SNconwas the highest
and was significantly higher than the other treatments (Ta-ble 4), and those of SNcon, Ncon, SNoptand Noptwere
signif-icantly higher than the N0treatment. As for the nitrogen
ap-plication effect, Nconwas the highest and was 4.5–13.9 % and
2.0–23.3 % higher than Noptand N0, respectively. The
dif-ferences among the three N levels were not significant until 2012, when Nconand Noptwere significantly higher than N0
(P <0.05). As for the straw return effect, the 0–20 cm SOC
7904 T. Huang et al.: Net global warming potential and greenhouse gas intensity
Fig. 3.Nitrous oxide (N2O) fluxes in the winter wheat–summer maize double-cropping system from June 2011 to June 2013. The arrows show the dates of fertilizer N application.
3.3 N2O emissions
The patterns of N2O fluxes from June 2011 to June 2013
are shown in Fig. 3 for all treatments. The fluxes of the all plots varied from−28.3 to 1682.1 µg N2O-N m−2h−1. Sev-eral N2O emission peaks were observed in the fertilized
treat-ments, which were associated with N fertilizer application events coupled with irrigation/rainfall or tillage or triggered by heavy rainfall alone, and two may have been related to the freeze–thaw effect on 20 March 2012 and 15 March 2013, when the soil temperature increased above 0◦C.
Fertiliza-tion alone only slightly stimulated N2O emissions within
two weeks, i.e. the maximum N2O emissions amounting to
106.9, 254.8 and 82.2 µg N2O-N m−2h−1after fertilization
at the ten-leaf stage of 2011 maize, 2012 maize and basal fertilization in 2012–2013 wheat, respectively. When fertil-ization was coupled with rainfall or irrigation, massive pulses of N2O emissions were observed, with maximum fluxes up
to 230.2 µg N2O-N m−2h−1at shooting stage in 2012–2013
wheat, and 704.7, 556.1 µg N2O-N m−2h−1 after four-leaf
stage fertilization in 2011 and 2012 maize. The highest N2O
emission was 1682.1 µg N2O-N m−2h−1after the wheat was
sown in October 2011 because fertilization and tillage were coupled with irrigation.
Annual cumulative N2O emissions over the two cropping
rotations ranged from 0.20 to 4.54 and 0.47 to 4.35 kg N2
O-N ha−1in 2011–2012 and 2012–2013, respectively (Table 5). The seasonal cumulative N2O emission from all treatments
was in the order SNcon>Ncon>SNopt>Nopt>SN0>N0in
these four different seasons. As for the nitrogen application effect, annual cumulative N2O emissions in Nopt and Ncon
were significantly higher than N0(P <0.05), with increases
of more than 3 and 6 times, respectively. The cumulative N2O emissions of Nconin 2011–2012 and 2012–2013 winter
wheat were not significantly higher than Nopt, but the
oppo-site trend occurred in 2011 and 2012 summer maize. As for the straw return effect, the seasonal cumulative N2O
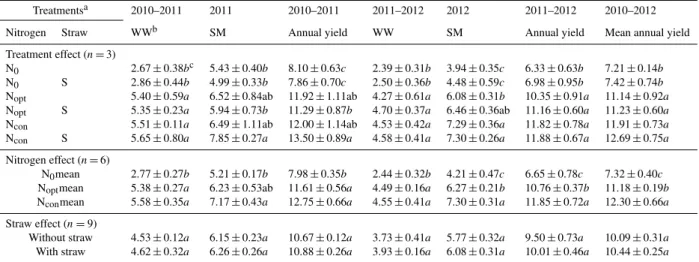
Table 4.Soil organic carbon (SOC) density (Mg C ha−1)in 0–20, 20–40, 40–60 cm in winter wheat–summer maize double-cropping system for the year 2006 and 2012.
Treatmenta 0–20 cm 20–40 cm 40–60 cm
Nitrogen Straw 2006 2012 2006 2012 2006 2012
Treatment effect (n=3)
N0 20.2 18.1±1.2cb 19.6 17.2±0.9a 16.6 15.1±0.8a N0 S 20.2 22.2±1.3bc 19.6 17.8±2.7a 16.6 16.5±0.7a Nopt 20.2 24.2±0.5b 19.6 16.5±0.5a 16.6 16.0±1.0a Nopt S 20.2 25.3±2.9b 19.6 19.4±3.0a 16.6 16.3±1.4a Ncon 20.2 24.9±3.8b 19.6 19.9±2.6a 16.6 16.2±0.3a Ncon S 20.2 30.8±4.3a 19.6 20.7±3.4a 16.6 16.7±2.2a
Nitrogen effect (n=6)
N0mean 20.2 20.2±2.1b 19.6 17.5±1.7a 16.6 15.8±0.5a Noptmean 20.2 24.7±4.0a 19.6 18.0±1.4a 16.6 16.2±0.4a Nconmean 20.2 27.8±3.4a 19.6 20.3±2.6a 16.6 16.4±1.2a
Straw effect (n=9)
Without straw 20.2 22.4±1.3a 19.6 17.9±1.1a 16.6 15.7±0.4a With straw 20.2 26.1±1.7a 19.6 19.3±2.3a 16.6 16.5±1.2a
aN
0, Noptand Nconrepresent zero-N (control), optimum and conventional N, respectively. S is straw return.bDifferent lowercase letters within same column denote significant differences between treatments (P <0.05).
34 and 37 % compared to straw removal treatments in the four crops, respectively, but only in 2012 maize was the in-crease significant (P <0.05). The cumulative N2O emissions
showed pronounced seasonal variation.
Correlations between seasonal cumulative N2O emissions
and fertilizer N application rates from straw removal and straw return were also calculated and the seasonal cumula-tive N2O emissions increased linearly with increasing N
ap-plication rate (Fig. 4). Compared to the straw removal treat-ments, the slopes from the straw return treatments were 56, 8, 23 and 10 % higher in 2011 maize, 2011–2012 wheat, 2012 maize and 2012–2013 wheat, respectively.
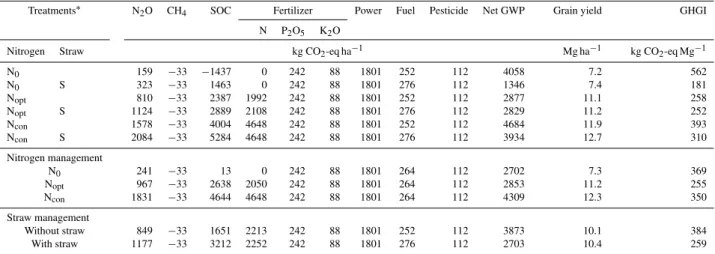
3.4 NGWP and GHGI
Although N fertilizer and straw return increased annual N2O
emissions, they also increased SOC sequestration and it is interesting to explore the NGWP and GHGI in this double-cropping system. From the view of carbon footprint, we in-cluded GHG emissions associated with all the inputs (fer-tilization, power, fuel, pesticide) and SOC sequestration ex-pressed as kg CO2-eq ha−1yr−1(Table 6). The NGWP was
in the order Ncon>N0>SNcon>Nopt>SNopt>SN0.
The NGWP of the zero-N application treatments (N0and
SN0)averaged 2702 kg CO2-eq ha−1, with a positive GWP
of 2748 kg CO2-eq ha−1(including a 9 % contribution from
N2O emissions, 12 % from fertilizer production (0 % from
N), 66 % from power, 13 % from fuel and pesticide) and a negative GWP of only 46 kg CO2-eq ha−1 (including 72
and 28 % from CH4uptake and SOC sequestration,
respec-tively). In contrast, the NGWP of optimum (Noptand SNopt)
applications averaged 2853 kg CO2-eq ha−1, with a positive
GWP of 5525 kg CO2-eq ha−1(including an 18 %
contribu-tion from N2O emissions, 43 % from fertilizer production
(37 % from N), 33 % from power, 6 % from fuel and pesti-cide) and a negative GWP of 2672 kg CO2-eq ha−1
(includ-ing 99 % from SOC sequestration). The NGWP of the con-ventional N (Nconand SNcon)applications averaged 4309 kg
CO2-eq ha−1, with a positive GWP of 8986 kg CO2-eq ha−1
(including a 20 % contribution from N2O emissions, 54 %
from fertilizer production (51 % from N), 20 % from power and 6 % from fuel and pesticide), and a negative GWP of 4677 kg CO2-eq ha−1 (including 99 % from SOC
seques-tration). The optimum N application reduced CO2-eq ha−1
by 3462 kg by reducing N2O emissions (25 %) and N
fer-tilizer (75 %) compared to the conventional N application, but the latter fixed over 2006 kg CO2-eq ha−1more than the
optimum N application through increasing SOC. Thus, the optimum N application led to a reduction of only 1456 kg CO2-eq ha−1 compared to the conventional N application,
which accounted for 34 % of NGWP in the latter.
Comparing the two straw management practices, the net GWP of the straw removal treatments (N0, Nopt and Ncon)
averaged 3873 kg CO2-eq ha−1, with a positive GWP of
5558 kg CO2-eq ha−1 (including a 15 % contribution from
N2O emissions, 46 % from chemical fertilizer production and
transport (40 % from N), 32 % from power and 7 % from fuel and pesticide) and a negative GWP of 1685 kg CO2-eq ha−1
(including 98 % from SOC sequestration). In comparison, the NGWP of the straw return treatments (SN0, SNopt &
SNcon)averaged 2703 kg CO2-eq ha−1with a positive GWP
7906 T. Huang et al.: Net global warming potential and greenhouse gas intensity
Table 5.N2O emissions (kg N2O-N ha−1)in winter wheat–summer maize double-cropping system from June 2011 to June 2013.
Treatmentsa 2011 2011–2012 2011–2012 2012 2012–2013 2012–2013 2011–2013
Nitrogen Straw SMb WW Annual SM WW Annual Mean annual
Treatment effect (n=3)
N0 0.09±0.02c 0.11±0.02c 0.20±0.04c 0.17±0.04e 0.30±0.05c 0.47±0.09c 0.34±0.03d N0 S 0.20±0.15c 0.34±0.11bc 0.54±0.16c 0.19±0.07e 0.64±0.17bc 0.83±0.21bc 0.69±0.17d Nopt 1.09±0.33bc 0.89±0.29abc 1.99±0.25bc 0.72±0.06d 0.75±0.46bc 1.48±0.45b 1.73±0.34c Nopt S 1.18±0.62bc 0.98±0.19abc 2.16±0.49bc 1.21±0.04c 1.43±0.65ab 2.65±0.63a 2.40±0.26bc Ncon 1.80±0.65ab 1.47±0.85ab 3.27±0.83ab 1.97±0.20b 1.50±0.56ab 3.47±0.40a 3.37±0.32ab Ncon S 2.71±1.05a 1.83±1.00a 4.54±1.85a 2.39±0.41a 1.96±0.63a 4.35±0.64a 4.45±1.31a
Nitrogen effect (n=6)
N0mean 0.15±0.08c 0.23±0.05b 0.37±0.09c 0.18±0.05c 0.47±0.09b 0.65±0.12c 0.51±0.08c Noptmean 1.14±0.47b 0.94±0.23ab 2.07±0.36b 0.97±0.05b 1.09±0.47ab 2.06±0.45b 2.07±0.29b Nconmean 2.26±0.81a 1.65±0.40a 3.90±1.20a 2.18±0.18a 1.73±0.68a 3.91±0.66a 3.90±0.69a
Straw effect (n=9)
Without straw 1.00±0.28a 0.82±0.20a 1.82±0.34a 0.95±0.07b 0.85±0.34a 1.81±0.27b 1.81±0.19b
With straw 1.36±0.60a 1.05±0.40a 2.41±0.82a 1.27±0.16a 1.34±0.27a 2.61±0.46a 2.51±0.48a
aN
0, Noptand Nconrepresent zero-N (control), optimum and conventional N, respectively. S is straw return.bWW and SM are winter wheat and summer maize; number represents mean±
standard error (n=3); different letters within same column indicate significant differences (P <0.05).
Table 6.Net global warming potential (NGWP) and greenhouse gas intensity (GHGI) in winter wheat–summer maize double-cropping system from June 2011 to June 2013.
Treatments∗ N2O CH4 SOC Fertilizer Power Fuel Pesticide Net GWP Grain yield GHGI N P2O5 K2O
Nitrogen Straw kg CO2-eq ha−1 Mg ha−1 kg CO2-eq Mg−1 N0 159 −33 −1437 0 242 88 1801 252 112 4058 7.2 562 N0 S 323 −33 1463 0 242 88 1801 276 112 1346 7.4 181 Nopt 810 −33 2387 1992 242 88 1801 252 112 2877 11.1 258 Nopt S 1124 −33 2889 2108 242 88 1801 276 112 2829 11.2 252 Ncon 1578 −33 4004 4648 242 88 1801 252 112 4684 11.9 393 Ncon S 2084 −33 5284 4648 242 88 1801 276 112 3934 12.7 310
Nitrogen management
N0 241 −33 13 0 242 88 1801 264 112 2702 7.3 369 Nopt 967 −33 2638 2050 242 88 1801 264 112 2853 11.2 255 Ncon 1831 −33 4644 4648 242 88 1801 264 112 4309 12.3 350
Straw management
Without straw 849 −33 1651 2213 242 88 1801 252 112 3873 10.1 384 With straw 1177 −33 3212 2252 242 88 1801 276 112 2703 10.4 259
∗
N0, Noptrepresent zero-N (control), optimum and conventional N, respectively. S represents straw return.
N2O emissions, 43 % from chemical fertilizer production and
transport (38 % from N), 30 % from power and 7 % from fuel and pesticide) and a negative GWP of 3245 kg CO2-eq ha−1
(including 99 % from SOC sequestration). Compared to the straw removal treatments, the positive GWP in the straw re-turn treatments increased by 391 kg CO2-eq ha−1, 84 % of
which is from the increment of N2O emissions, 10 % from
higher N input and 7 % from straw return, but the nega-tive GWP also increased by 1561 kg CO2-eq ha−1 because
of more SOC sequestration after straw return, so the NGWP in the straw return treatments decreased by 1170 kg CO2-eq
ha−1 compared to straw removal, accounting for 30 % of NGWP in the latter.
The GHGI across all treatments ranged from 181 to 562 kg CO2-eq Mg−1 grain and followed the order
N0>Ncon>SNcon>Nopt>SNopt>SN0 (Table 6).
Com-paring the three N levels, the GHGI of zero-N applications (N0 and SN0) averaged 369 kg CO2-eq Mg−1 grain,
in-cluding contributions of 34, 45, 246, 51,−5 and −2 CO2
-eq Mg−1 from N
2O emissions, fertilizer production and
transport, power, other sources, CH4 uptake and SOC
se-questration, respectively. In contrast, the GHGI of the op-timum (Nopt and SNopt) N applications averaged 255 kg
CO2-eq Mg−1grain, including contributions of 86, 183, 161,
64 and−236 kg CO2-eq Mg−1 grain from N2O emissions, N fertilizer production, power, other sources and SOC se-questration, respectively. The GHGI of conventional (Ncon
and SNcon) N application averaged 350 kg CO2-eq Mg−1
fer-Fig. 4.Correlations between seasonal cumulative N2O emissions and fertilizer N application rates from 2011 to 2013. The dashed line and solid line were fitted by linear regression from the straw and without straw treatments, respectively.
tilizer production, power, other sources and SOC seques-tration, respectively. Compared to conventional N appli-cation, the GHGI at the optimum N treatment decreased by 95 kg CO2-eq Mg−1 grain, with 62, 193 and −142 kg
CO2-eq Mg−1grain of this due to a decrease in N2O
emis-sions, N fertilizer production and transport, and SOC seques-tration, and 18 kg CO2-eq Mg−1 grain due to an increase
from other sources. Compared to straw removal, although the GHGI with straw return was 28 kg CO2-eq Mg−1grain due
to a increase in N2O emissions, this was offset by 144 and
9 kg CO2-eq Mg−1grain due to SOC sequestration and other
sources, and finally decreased by 125 kg CO2-eq Mg−1grain.
4 Discussion
4.1 Effects of N application and straw return on grain yields
The mean grain yields (dry matter) of winter wheat (5.0 Mg ha−1)and summer maize (6.8 Mg ha−1)from the N
application treatments (Noptand Ncon)in this study (Table 3)
were comparable to the normal average yield in conventional farming practice on the NCP (wheat 5.5 Mg ha−1, maize 5.5– 6.0 Mg ha−1)as reported by Zhao et al. (2006), and lower than the potential productivity (wheat 6.9 Mg ha−1, maize 8.3 Mg ha−1)based on the results of experiments conducted in the region (Wang et al., 2010). This further supports the argument that about half of the conventional N application
rate could be used to achieve comparable crop yields because the conventional practice has involved substantial over-use of chemical N fertilizers over the last decade, leading to pollu-tion of surface waters and groundwater and high emissions of reactive N to the atmosphere (Ju et al., 2009; Guo et al., 2010; Liu et al., 2013). There is considerable scope for saving N fertilizer to restore the environment and maintain relatively high crop productivity.
It was locally common practice to remove straw and burn it as a household fuel about 20 years ago, but nowadays most straw is returned to the field because of a switch of house-hold fuel to coal or natural gas (Edwards et al., 2004). These changes provide good opportunities to enhance soil fertility, store more carbon in the soil and boost crop yields (Huang and Sun, 2006). As shown in our study, straw return slightly increased winter wheat and summer maize yields (Table 3) and might increase the yields significantly as the experiment continues over the longer term (Malhi et al., 2011).
4.2 Impacts of N application and straw return on SOC sequestration and N2O emissions
SOC density change represents the net CO2 exchange
7908 T. Huang et al.: Net global warming potential and greenhouse gas intensity
conditions, management practices such as tillage, and crop-ping systems (Zhang et al., 2010). A local 25 yr old field experiment showed that the SOC content in the top 20 cm increased by 10–53 % compared with the control with N fer-tilizer application and maize straw return (Du et al., 2009). In our study the rate of increase of SOC density ranged from 0.04 to 1.44 Mg C ha−1yr−1, similar to previous reports from work in the uplands of northern China (0.07–1.461 Mg C ha−1yr−1)(Zhang et al., 2010). However, the change was very slow due to the decomposition of the straw coupled with high soil temperatures and moisture in summer on the NCP (Huang et al., 2013).
The processes, patterns and factors controlling N2O
emis-sions have been reported by several studies recently (Ju et al., 2011; Cui et al., 2012; Hu et al., 2013), i.e. N2O emission
peaks occurring mainly within one or two weeks of NH+4 -based fertilizer application and irrigation, and the occurrence of emissions mainly during the summer maize season with combined high soil temperatures and moisture. Our results are in line with these earlier studies. N2O emissions usually
increase linearly or exponentially with increasing N appli-cation rate, and thus reduction of the N rate to an optimum level could substantially reduce N2O emissions in cropping
systems (Van Groenigen et al., 2010; Liu et al., 2012). Our former results using an automated system showed that total N2O emissions decreased by 40 and 67 % in the winter wheat
and summer maize seasons, respectively, when the conven-tional N management (300 kg N ha−1 per crop) changed to optimum N management (50–122 kg N ha−1per crop) (Ju et al., 2011), which is similar to the 37–56 % reduction in the present study.
Straw return consistently increased N2O emissions and
showed positive interactions between N and straw, especially in the summer maize season (Fig. 4). This indicates that the N2O emissions from the straw incorporation treatments were
4 times higher than the straw removal treatments (Hao et al., 2001). In addition, N2O emissions increased by 58 % in
the following summer maize after wheat straw return (Liu et al., 2011). This increase may have been due to accelerat-ing microbial nitrification and denitrification processes with the coupling of mineral N, available carbon, and favourable temperatures and soil moisture (Huang et al., 2004). 4.3 Impacts of N application and straw return on
NGWP and GHGI
Agricultural management practices that change one type of GWP source/sink may also impact other sources/sinks and therefore change the NGWP and GHGI (Mosier et al., 2006; Shang et al., 2011). In the present study a 56 % decrease in N fertilizer to the Nopt treatment brought about a 47 %
decrease in N2O emissions, a 56 % decrease in N fertilizer
manufacture and transport, a 43 % decrease in SOC seques-tration, and finally a 34 % decrease in the net GWP relative to the Ncontreatment. However, despite the lower N fertilizer
input, the grain yield declined by only 9 % (and not signifi-cantly) and the GHGI of the Nopttreatment was 27 % lower
than the Ncontreatment, indicating less CO2-eq consumption
per unit grain produced. Similarly, compared to the straw re-moval treatments, straw return generated a 28 % increase in N2O emissions, 9 % increase in fuel consumption for straw
returning, a 49 % increase in SOC sequestration, and finally 30 and 33 % decreases in NGWP and GHGI, respectively. Thus, this indicates that relatively high yields and lower car-bon costs can be achieved simultaneously by optimizing N-and straw management.
The NGWP in our study (1346–4684 kg CO2-eq ha−1)
was much lower than in rice–wheat rotations (6660–9710 kg CO2-eq ha−1) (Ma et al., 2013) and double-rice-cropping
systems (13 407–26 066 kg CO2-eq ha−1) (Shang et al.,
2011), in both of which CH4 emission was the main
con-tributor to the high GWP. However, CH4is a very small sink
in our upland cropping system and CH4 uptake makes
lit-tle contribution when calculating the NGWP from all emis-sions and sinks. We therefore adopted the CH4uptake data
from previous field experiments carried out on the same soil type, climatic zone and cropping system, and the annual and treatment variation in CH4uptake was very small (e.g. 0.74–
1.16 kg CH4-C ha−1 in 2009–2010 and 0.69–0.93 kg CH4
-C ha−1in 2010–2011 across all treatments) (Gao, 2012; Hu et al., 2013). The effect of nitrogen and straw on cumulative CH4uptake in this region is very small (Liu et al., 2012) and
the negative GWP from CH4 uptake represented less than
1 % in all GWP calculations.
The GHGI values of the N application treatments were 252–393 kg CO2-eq Mg−1grain in this study, higher than the
values from irrigated maize in central Nebraska, where the GHGI was 230 kg CO2-eq Mg−1 grain (Grassini and
Cass-man, 2012) because of low emission factors for N fertil-izer production (2.6 kg CO2-eq kg−1 in the US vs. 8.3 kg
CO2-eq kg−1 in China) and electricity generation (0.6 kg
CO2-eq (kW h)−1in the US vs. 1.3 kg CO2-eq (kW h)−1in
China) (Grassini and Cassman, 2012; Zhang et al., 2013). The higher emission factor was due 70 and 86 % to Chi-nese primary energy consumption and the energy consumed in N fertilizer production being dependent on coal (Cromp-ton and Wu, 2005; Zhang et al., 2013), which has a greater GWP (methane and carbon dioxide emission from min-ing and combustion of coal) and lower energy efficiency than other sources of energy such as natural gas and nu-clear power (Zhang et al., 2013). In the present study the GHGI from the N fertilizer and electricity production ac-counted for 37–50 and 19–34 % of the total positive GHGI, respectively. However, if we adopt the lower emission factor (4.7 kg CO2-eq kg−1)for the N fertilizer industry in China by
the best available technologies and a lower emission factor (0.24 kg CO2-eq (kW h)−1)for producing electricity by
hy-dro power (Zhang et al., 2013), the GHGI for the N applica-tion treatments will be reduced to 35–101 kg CO2-eq Mg−1
Our results show that 48–52 % of positive GWP from the agricultural inputs has been offset by SOC sequestra-tion with a low initial SOC content (7.7 g kg−1). However,
this trend of increasing SOC content might slow down when it reaches a maximum soil C capacity, i.e. soil C satura-tion (West and Six, 2007). Moreover, different agricultural management practices that increase SOC will simultaneously change other types of greenhouse gas emissions (Robert-son et al., 2000). Robert(Robert-son et al. (2000) revealed that no-till management enhanced SOC accumulation but concomi-tantly stimulated N2O emissions, which almost offset the
negative GWP from SOC sequestration. Fertilizers and wheat residues applied to the soil will provide additional SOC in Ohio Crosby soil, but its greenhouse mitigating effect would be offset not only by increasing N2O emissions but also by
SOC sequestration rates decreasing with time, and as a re-sult the GWP-lowering effect of the fertilized and unfertil-ized treatments will vanish after 7 and 12 years, respectively (Jacinthe and Lal, 2003). Nevertheless, this overestimation of SOC sequestration is unlikely to change our conclusion that optimum N fertilization and straw return can both maintain relatively high target yields and also reduce environmental costs in our cropping system.
In our study the main emission sources are power con-sumption for irrigation, N production and N2O emissions,
with the main emission sink being SOC sequestration. To further reduce the GWP of the winter wheat–summer maize cropping system in future, we firstly can change the current conventional cropping system (winter wheat–summer maize with two harvests in one year) to an alternative system (win-ter wheat/summer maize–spring maize with three harvests in two years or monoculture spring maize with one harvest each year) and reduce the power consumption for irrigating win-ter wheat as described by Meng et al. (2012). Secondly, we can reduce the GHG emissions generated from N fertilizer production by optimizing the N application rate (Ju et al., 2011; Liu et al., 2012) and improving the technologies of fertilizer N manufacturing technologies (Zhang et al., 2013). Thirdly, N2O emissions can be reduced by using nitrification
inhibitors (Ding et al., 2011) or polymer-coated controlled-release fertilizers (Hu et al., 2013). Finally, although in this study the highest SOC had increased to 10.8 g kg−1after 6 years, there was still potential to increase SOC further by manure application and reduced tillage (Smith et al., 2007; Snyder et al., 2009).
5 Conclusions
The conventional N application rate could be reduced by roughly half to the optimum level using the improved Nmin method and still maintain relatively high target yields and consequently significantly reduce N2O emissions. Straw
re-turn had a slight yield benefit and could increase annual N2O emissions but led to a significant increase in SOC.
Ra-tional long-term N and straw return management can in-crease SOC sequestration, which can offset the CO2-eq from
GHG emissions and agricultural inputs and consequently re-duce NGWP and GHGI compared with conventional farming practices in this double-cropping system. The main emission sources are the power consumption for irrigation, fertilizer N production and N2O emissions, with SOC sequestration
providing the main emission sink. Therefore, the NGWP and GHGI of this cropping system can be further decreased by water saving in the winter wheat season, improving the tech-nologies of fertilizer N manufacture and reducing N2O
emis-sions by using slow-release or controlled-release fertilizers.
Acknowledgements. This work was funded by the National Natural Science Foundation of China (31172033, 41230856), the Special Fund for the Agricultural Profession (201103039), and the Inno-vation Group Grant of the National Natural Science Foundation of China (31121062).
Edited by: A. Neftel
References
Chen, X. P., Cui, Z. L., Vitousek, P. M., Cassman, K. G., Matson, P. A., Bai, J. S., Meng, Q. F., Hou, P., Yue, S. C., Roemheld, V., and Zhang, F. S.: Integrated soil-crop system management for food security, P. Natl. Acad. Sci., 108, 6399–6404, 2011.
Cole, C. V., Duxbury, J., Freney, J., Heinemeyer, O., Minami, K., Mosier, A., Paustian, K., Rosenberg, N., Sampson, N., Sauer-beck, D., and Zhao, Q.: Global estimates of potential mitigation of greenhouse gas emissions by agriculture, Nutr. Cycl. Agroe-cosys., 49, 221–228, 1997.
Crompton, P. and Wu, Y. R.: Energy consumption in China: past trends and future directions, Energy Economics, 27, 195–208, 2005.
Cui, F., Yan, G. X., Zhou, Z. X., Zheng, X. H., and Deng, J.: Annual emissions of nitrous oxide and nitric oxide from a wheat-maize cropping system on a silt loam calcareous soil in the North China Plain, Soil Biol. Biochem., 48, 10–19, 2012.
Ding, W. X., Yu, H. Y., and Cai, Z. C.: Impact of urease and ni-trification inhibitors on nitrous oxide emissions from fluvo-aquic soil in the North China Plain, Biol. Fert. Soils, 47, 91–99, 2011. Du, Z. L., Liu, S., F., Li, K. J., and Ren, T. S.: Soil organic carbon and physical quality as influenced by long-term application of residue and mineral fertiliser in the North China Plain, Aust. J. Soil Res., 47, 585–591, 2009.
Edwards, R. D., Smith, K. R., Zhang, J. F., and Ma, Y. Q.: Implica-tions of changes in household stoves and fuel use in China, Energ Policy, 32, 395–411, 2004.
Foley, J. A., Ramankutty, N., Brauman, K. A., Cassidy, E. S., Ger-ber, J. S., Johnston, M., Mueller, N. D., O’Connell, C., Ray, D. K., West, P. C., Balzer, C., Bennett, E. M., Carpenter, S. R., Hill, J., Monfreda, C., Polasky, S., Rockstrom, J., Sheehan, J., Siebert, S., Tilman, D., and Zaks, D. P. M.: Solutions for a cultivated planet, Nature, 478, 337–342, 2011.
7910 T. Huang et al.: Net global warming potential and greenhouse gas intensity
on the North China Plain. China Agricultural University PhD Thesis, Beijing, 79–80, 2012.
Gao, B., Ju, X. T., Zhang, Q., Christie, P., and Zhang, F. S.: New estimates of direct N2O emissions from Chinese croplands from 1980 to 2007 using localized emission factors, Biogeosciences Discuss., 8, 6971–7006, doi:10.5194/bgd-8-6971-2011, 2011 Grassini, P. and Cassman, K. G.: High-yield maize with large net
energy yield and small global warming intensity, P. Natl. Acad. Sci., 109, 1074–1079, 2012.
Guo, J. H., Liu, X. J., Zhang, Y., Shen, J. L., Han, W. X., Zhang, W. F., Christie, P., Goulding, K. W. T., Vitousek, P. M., and Zhang, F. S.: Significant Acidification in Major Chinese Croplands, Sci-ence, 327, 1008–1010, 2010.
Hao, X., Chang, C., Carefoot, J. M., Janzen, H. H., and Ellert, B. H.: Nitrous oxide emissions from an irrigated soil as affected by fertilizer and straw management, Nutr. Cycl. Agroecosys. 60, 1– 8, 2001.
Hu, X. K., Su, F., Ju, X. T., Gao, B., Oenema, O., Christie, P., Huang, B. X., Jiang, R. F., and Zhang, F. S.: Greenhouse gas emissions from a wheat-maize double cropping system with dif-ferent nitrogen fertilization regimes, Environ. Pollut., 176, 198– 207, 2013.
Huang, J. X., Chen, Y. Q., Liu, W. R., Zheng, H. B., Sui, P., Li, Y. Y., Shi, X. P., Nie, S. W., and Gao, W. S.: Effect on net green-house gases emission under different conservation tillages in Jilin Province, Scientia agricultura, Sinica, 44, 2935–2942, 2011. Huang, T., Qiu, S. J., Du, J., Shi, Z. X., and Ju, X. T.: Effect of
different carbon and nitrogen managements on yield, straw de-composition, soil CO2flux of the winter wheat/summer maize, Scientia agricultura. Sinica, 46, 756–768, 2013.
Huang, Y. and Sun, W. J.: Changes in topsoil organic carbon of croplands in mainland China over the last two decades, Chinese Sci. Bull., 51, 1785–1803, 2006.
Huang, Y., Zou, J. W., Zheng, X. H., Wang, Y. S., and Xu, X. K.: Nitrous oxide emissions as influenced by amendment of plant residues with different C : N ratios, Soil Biol. Biochem., 36, 973– 981, 2004.
IPCC: Changes in atmospheric constituents and in radiative forcing. Climate Change 2007: The Physical Science Basis, Contribution of Working Group I to the Fourth Assessment Report of the In-tergovernmental Panel on Climate Change, edited by: Solomon, S., Qin, D., Manning, M., Chen, Z., Marquis, M., Averyt, K. B., Tignor, M., and Miller, H. L., Cambridge University Press, Cam-bridge, UK and New York, NY, USA, 130–234, 2007.
Jacinthe, P. A. and Lal, R.: Nitrogen fertilization of wheat residue affecting nitrous oxide and methane emission from a central Ohio Luvisol, Biol. Fert. Soils, 37, 338–347, 2003.
Ju, X. T., Lu, X., Gao, Z. L., Chen, X. P., Su, F., Kogge, M., Roemheld, V., Christie, P., and Zhang, F. S.: Processes and fac-tors controlling N2O production in an intensively managed low carbon calcareous soil under sub-humid monsoon conditions, Environ. Pollut., 159, 1007–1016, 2011.
Ju, X. T., Xing, G. X., Chen, X. P., Zhang, S. L., Zhang, L. J., Liu, X. J., Cui, Z. L., Yin, B., Christie, P., Zhu, Z. L., and Zhang, F. S.: Reducing environmental risk by improving N management in intensive Chinese agricultural systems, P. Natl. Acad. Sci., 106, 3041–3046, 2009.
Kroon, P. S., Hensen, A., van den Bulk, W. C. M., Jongejan, P. A. C., and Vermeulen, A. T.: The importance of reducing the systematic
error due to non-linearity in N2O flux measurements by static chambers, Nutr. Cycl. Agroecosys., 82, 175–186, 2008. Liu, C. Y., Wang, K., Meng, S. X., Zheng, X. H., Zhou, Z. X., Han,
S. H., Chen, D. L., and Yang, Z. P.: Effects of irrigation, fertil-ization and crop straw management on nitrous oxide and nitric oxide emissions from a wheat-maize rotation field in northern China, Agr. Ecosyst. Environ., 140, 226–233, 2011.
Liu, C., Wang, K., and Zheng, X.: Responses of N2O and CH4 fluxes to fertilizer nitrogen addition rates in an irrigated wheat-maize cropping system in northern China, Biogeosciences, 9, 839–850, doi:10.5194/bg-9-839-2012, 2012.
Liu, X. J., Zhang, Y., Han, W. X., Tang, A. H., Shen, J. L., Cui, Z. L., Vitousek, P., Erisman, J. W., Goulding, K., Christie, P., Fangmeier, A., and Zhang, F. S.: Enhanced nitrogen deposition over China, Nature, 494, 459–462, 2013.
Livingston, G. P., Hutchinson, G. L., and Spartalian, K.: Diffusion theory improves chamber-based measurements of trace gas emissions, Geophys. Res. Lett., 32, L24817, doi:10.1029/2005GL024744, 2005.
Ma, Y. C., Kong, X. W., Yang, B., Zhang, X. L., Yan, X. Y., Yang, J. C., and Xiong, Z. Q.: Net global warming potential and green-house gas intensity of annual rice-wheat rotations with integrated soil-crop system management, Agr. Ecosyst. Environ., 164, 209– 219, 2013.
Malhi, S. S., Nyborg, M., Solberg, E. D., Dyck, M. F., and Puurveen, D.: Improving crop yield and N uptake with long-term straw re-tention in two contrasting soil types, Field Crop Res., 124, 378– 391, 2011.
Meng, Q. F., Sun, Q. P., Chen, X. P., Cui, Z. L., Yue, S. C., Zhang, F. S., and Roemheld, V.: Alternative cropping systems for sus-tainable water and nitrogen use in the North China Plain, Agr. Ecosyst. Environ., 146, 93–102, 2012.
Mosier, A. R., Halvorson, A. D., Reule, C. A., and Liu, X. J.: Net global warming potential and greenhouse gas intensity in irri-gated cropping systems in northeastern Colorado, J. Environ. Qual., 35, 1584–1598, 2006.
Pathak, H., Li, C., and Wassmann, R.: Greenhouse gas emis-sions from Indian rice fields: calibration and upscaling using the DNDC model, Biogeosciences, 2, 113–123, doi:10.5194/bg-2-113-2005, 2005.
Qiu, S. J., Ju, X. T., Lu, X., Li, L., Ingwersen, J., Streck, T., Christie, P., and Zhang, F. S.: Improved nitrogen management for an inten-sive winter wheat/summer maize double-cropping system, Soil Sci. Soc. Am. J., 76, 286–297, 2012.
Robertson, G. P. and Grace, P. R.: Greenhouse gas fluxes in tropical and temperate agriculture: The need for a full-cost accounting of global warming potentials, Environment Development and Sus-tainability, 6, 51–63, 2004.
Robertson, G. P., Paul, E. A., and Harwood, R. R.: Greenhouse gases in intensive agriculture: Contributions of individual gases to the radiative forcing of the atmosphere, Science, 289, 1922– 1925, 2000.
Smith, P., Martino, D., Cai, Z. C., Gwary, D., Janzen, H., Ku-mar, P., McCarl, B., Ogle, S., O’Mara, F., Rice, C., Scholes, B., Sirotenko, O., Howden, M., McAllister, T., Pan, G. X., Roma-nenkov, V., Schneider, U., and Towprayoon, S.: Policy and tech-nological constraints to implementation of greenhouse gas miti-gation options in agriculture, Agr. Ecosyst. Environ., 118, 6–28, 2007.
Smith, P., Fang, C. M., Dawson, J. J. C., and Moncrieff, J. B.: Impact of global warming on soil organic carbon, Advances in Agronomy, 97, 1–43, 2008.
Snyder, C. S., Bruulsema, T. W., Jensen, T. L., and Fixen, P. E.: Re-view of greenhouse gas emissions from crop production systems and fertilizer management effects, Agr. Ecosyst. Environ., 133, 247–266, 2009.
Song, L. N., Zhang, Y. M., Hu, C. S., Zhang, X. Y., Dong, W. X., Wang, Y. Y., and Qin, S. P.: Comprehensive analysis of emissions and global warming effects of greenhouse gases in winter-wheat fields in the high-yield agro-region of North China Plain, Chinese Journal of Eco-Agriculture, 21, 297–307, 2013.
Tilman, D., Cassman, K. G., Matson, P. A., Naylor, R., and Polasky, S.: Agricultural sustainability and intensive production practices, Nature, 418, 671–677, 2002.
Van Groenigen, J. W., Velthof, G. L., Oenema, O., Van Groenigen, K. J., and Van Kessel, C.: Towards an agronomic assessment of N2O emissions: a case study for arable crops, Eur. J. Soil Sci., 61, 903–913, 2010.
Wang, H. X., Liu, C. M., and Zhang, L.: Water-saving agriculture in China: An overview, Advances in Agronomy, 75, 135–171, 2002.
Wang, Y. C., Wang, E. L., Wang, D. L., Huang, S. M., Ma, Y. B., Smith, C. J., and Wang, L. G.: Crop productivity and nutrient use efficiency as affected by long-term fertilisation in North China Plain, Nutr. Cycl. Agroecosys., 86, 105–119, 2010.
West, T. O. and Six, J.: Considering the influence of sequestration duration and carbon saturation on estimates of soil carbon capac-ity, Climatic Change, 80, 25–41, 2007.
Zhang, W. F., Dou, Z. X., He, P., Ju, X. T., Powlson, D., Chadwick, D., Norse, D., Lu, Y. L., Zhang, Y., Wu, L., Chen, X. P., Cassman, K. G., and Zhang, F. S.: New technologies reduce greenhouse gas emissions from nitrogenous fertilizer in China, P. Natl. Acad. Sci., 110, 8375–8380, 2013.
Zhang, W. J., Wang, X. J., Xu, M. G., Huang, S. M., Liu, H., and Peng, C.: Soil organic carbon dynamics under long-term fer-tilizations in arable land of northern China, Biogeosciences, 7, 409–425, 2010,
http://www.biogeosciences.net/7/409/2010/.
Zhao, R. F., Chen, X. P., Zhang, F. S., Zhang, H. L., Schroder, J., and Roemheld, V.: Fertilization and nitrogen balance in a wheat-maize rotation system in North China, Agron. J., 98, 938–945, 2006.