62 www.hrmars.com/journals
An investigation on the impact of Fadama II Project on
the adoption and demand for advisory services in
Adamawa State, Nigeria
Umar, A. M
Ph.D. Candidate (Community and Youth development)
Adamawa State University Mubi, Nigeria
Dr C. L. J Phoa
.
Senior Lecturer
Senior Lecturer, Faculty of Social Sciences University Malaysia Sarawak
Muhammad Khalique
PhD Student
Faculty of Economics and Business
Universiti Malaysia Sarawak
cks748@gmail.com
Abstract
63 www.hrmars.com/journals Keywords: Pluralistic advisory services, Community driven development, Impact, Fadama II beneficiaries
Introduction
Agricultural extension (advisory service) approaches and performance in Nigeria have been changing over the past few decades (Oladele et al., 2004). These changes have been driven by many factors, including the political and policy changes, donors, and recently by participation of nongovernmental organizations (NGOs) in funding and providing agricultural extension services (Oladele et al., 2004; Ozor et al., 2007). Currently, advisory services in Nigeria are largely provided by an agricultural development program (ADP) that evolved from a project funded by the World Bank. The World Bank project started in 1974 and had a broad objective of increasing food production to attain food self-sufficiency (IEG, 2001; Oladele et al., 2004). When the project ended in 1995 with significant success in increasing agricultural production, the federal government adopted its approach and incorporated it into the new ADP. Operations of the ADP are mainly funded by the federal and state governments, and provision of advisory services remains in the hands of public extension workers (Oladele et al., 2004). The ADP has continued to use the traditional supply-driven approach and has also been characterized by poor funding and less effective advisory services (Ozor et al., 2007). These weaknesses have likely limited the impacts of the ADP on agricultural productivity in the country and rural development in general.
The NGOs and projects have also been providing advisory services and other agriculture-related services (e.g., credit services and agricultural input supply). The approaches of the advisory services provided by NGOs and projects have differed, reflecting different focuses and locations in the country. Although the government has allowed and supported NGOs and projects, it has not yet taken bold steps to promote pluralistic advisory services. However, the presence of NGOs and projects has created opportunities for introducing demand-driven advisory services funded by nonpublic sources. Fadama II is one of the projects providing demand-driven advisory services. The project has also introduced the user fee approach that could help in promoting pluralistic extension services in developing countries (Umali- Deininger, 1997). Fadama II beneficiaries contribute 10 percent of the cost of the advisory services they receive. The experience of the Fadama II project in implementing a user-fee demand-driven approach is likely to serve as a good case study for the government to use to design policies for implementing pluralistic extension services in Nigeria and other developing countries.
The advisory services available to farmers in Adamawa State before the advent of Fadama II Project were largely supply-driven. Such services were mainly offered as primary responsibility of the ADP sponsored extension system as mentioned earlier, and was paid for 100% by the government (Ihaenachu et al, 2007). The supply driven advisory service was delivered to the beneficiaries in a manner that marginalized them as passive recipients of service perceived by the extension organization or its agents as suitable for their production needs (IFPRI, 2007).
64 www.hrmars.com/journals
Theoretical Framework: An Overview of Fadama II
In 2004, the Nigerian government launched the Second National Fadama Development Project (Fadama II) to increase the incomes of farmers, fishers, and other poor people in Fadama areas. Fadama is a Hausa word which connotes low-lying and flood plain areas underlined by shallow aquifers and found
alo g Nigeria’s ri er syste . It is in most cases irrigable land (NFDP II, 2007). Fadama II sought to
e po er lo al o u ities a d i pro e the go er e t’s apa ity to rea h out spe ifi ally to the
poor and vulnerable groups, such as women, unemployed youth, widows, and people living with HIV/AIDS (IDA, 2009; IFPRI, 2007; Nwanchuku and Ezeh, 2007). Importantly, the strategy represented a shift from public sector domination to a community-driven development (CDD) approach, which is built around community-defined priorities. The participatory component of the project was based on Fadama user groups with common economic interests, such as farmers, fishers, pastoralists (people who raise livestock), women, the disabled, and students (NFDP II, 2005). The project encouraged these groups to develop plans, and then each group requested money to pay for income-ge erati g o u ity-level
assets, su h as fishi g ets, fertilizer, ater-pumps, or generators. Fadama II also supported off-farm activities such as agro-processing, business training, and rural marketing. Moreover, it provided demand-driven extension services, worked to resolve conflicts over natural resources, and developed rural infrastructure such as roads.
Contribution of Study
In general, the MTR report indicates quite positive accomplishments of the Fadama II projects in all the components of the project. However, the MTR did not quantify the impacts of the project on community or households-. Hence the major contribution of the study is its approach of investigating the actual contribution of advisory services component of Fadama II project in the benefiting communities and households and the use of a sophisticated statistical methods to analyze the effect of the identified factor. Suggestions were made to improve the level of fadama III project success and its impact on the beneficiaries
Methodology
Nigeria is located in West Africa and shares land borders with the Republic of Benin in the west, Chad and Cameroon in the east, and Niger in the north around the Sahara desert. Its coast in the south lies on the Gulf of Guinea on the Atlantic Ocean. Nigeria occupies a total land area of 923,768 square kilometres with 910,770 square kilometres as arable land, a coastland of 853 square kilometres with ecological diversities which enables the country to produce a wide variety of crops and livestock, fishery and forestry to support its very large population of over 150 million people (FOS estimate, 2008). Nigeria has two main climatic zones which are influenced by Atlantic Ocean in the south, and Sahara desert in the north (FOS, 2008). As mentioned earlier, this study only focuses on Adamawa State. Adamawa is one of the thirty-six (36) States which constituted the Federal Republic of Nigeria. It is located in the northeastern part of Nigeria. It lies between latitude 12.20 N to 11.45N and longitude7.0E to 7.5 E
65 www.hrmars.com/journals Savannah Zone and the bulk of agricultural production is undertaken by small farmers of which women are included. The major crops are cotton, groundnuts, maize, yam, cassava, guinea corn, millet and rice and major dry season crops are tomatoes, pepper, onion, wheat, lettuce, carrot, garden egg, sugarcane, okra, amaranthus etc. The village communities living on the banks of the rivers engage in fishing while the Fulanis engage in livestock (cattle) production.
To achieve the objective of the study, primary data were collected from five Fadama-II projects benefiting LGAs randomly selected at 50 percent. There ten (10) participating LGAs. The benefiting LGAs selected include: Ganye, Mubi-North, Gombi, Guyuk and Fufore.
In each of the randomly selected five LGAs, 50 percent of the FCAs were randomly selected and in each selected FCAs, three households were also randomly selected. A total of 62 households were selected from the beneficiaries. Similarly the same numbers of households were selected from non-beneficiaries within Fadama-II LGAs and non-beneficiaries outside Fadama II LGAs. In all, a total number of 186 households were selected for this study.
ATT estimator was used to determine the impact of the project on provision of advisory services among the beneficiaries. Impact assessment studies face three interrelated challenges: establishing a viable counterfactual (the predicted outcome in the absence of the intervention—that is, what would have happened to the beneficiaries had they not participated in the project); attributing the impact to an intervention; and coping with long and unpredictable lag times (Alston and Pardey, 2001; Salter and
Marti , ). If a proje t’s out o e i di ator is household i o e, the a erage i pa t of the project on its beneficiaries (referred to in the impact assessment literature as the average effect of the treatment on the treated [ATT]) is defined as the difference between the expected income earned by project beneficiaries while participating in the project and the expected income they would have received if they had not participated in the project:
ATT = E (Y1|p =1) – E (Y0|p =0)
where ATT = average impact of treatment on the treated; p = participation in the project (p = 1 if participated in the project, and p = 0 if did not participate in the project); Y1 = outcome (household income, in this example) of the project beneficiary after participation in project; Y0 = outcome (income) of the same beneficiary if he or she had not participated in the project. Unfortunately, it is not tenable in this study to observe the counterfactual outcome of the beneficiaries had they not participated in the project.
66 www.hrmars.com/journals estimator. The double-difference estimator compares changes in outcome measures (i.e., change from before to after the project) between project participants and non-participants, rather than simply comparing outcome levels at one point in time.
D = (Yp1–Yp0) – (Ynp1–Ynp0)
Where Yp1 = outcome (e.g., income) of beneficiaries after the project started; Yp0 = outcome of beneficiaries before the project started; Ynp1 = outcome of non-beneficiaries after the project started; and Ynp0 = outcome of non-beneficiaries before the project started. Statistical test for difference was used to compare beneficiaries and nonbeneficiaries of the project at 5% level of significant.
Impact of Fadama II on the Types of Technologies Adopted and Demanded
The findings of this survey as shown in table 17 depicts that the technologies used by a large percentage of respondents was improved crop varieties, financial management and agricultural marketing technologies, probably due to that being one of the conditions for joining the project. However, all the technologies identified as presented in the table were used by the beneficiaries more than the nonbeneficiaries. The statistical test for difference between the beneficiaries and nonbeneficiaries is significant at 5% level of significance for crop management practices, financial record keeping, agricultural marketing, livestock management and postharvest handling. While the use of soil management and improved crop varieties was not significant, it was used more by the beneficiaries than the nonbeneficiaries. In the same vein, the technology that was demanded by the largest share of respondents differed across types of respondents. Fadama II beneficiaries asked for almost all the technologies more than the nonbeneficiaries. The difference in demand for crop management, livestock breeds and management, postharvest, and agricultural marketing technologies was significant at 5% level of significance. This could be a reflection of the beneficiaries demand to make use of the productive assets they acquired through the pilot asset acquisition subproject. Surprisingly, demand for financial management technology was not significant. This could be a result of having facilitators who
supply e efi iaries ith fi a ial management technologies, preempting the need to ask for such technologies. There was no significant difference between adoption and demand for crop-improved varieties. Beneficiaries demand for soil fertility management was significantly higher (at p = .05) than that of nonbeneficiaries. This means that there was a difference between adoption and demand for soil fertility management technology. That reflects the emphasis of the Fadama II project on soil fertility technologies by launching the agricultural input support component in 2006 to address soil fertility problems (NFDO, 2006).
67 www.hrmars.com/journals Table 1: Adoption and demand for production, postharvest, financial management, and marketing technologies
Proportion reporting using the technology Technology
FII Beneficiaries All Non Beneficiaries
T-test (p value)
(n = 62) (n = 124)
Improved Crop Varieties 0.8387(0.37080) 0.2097(0.40873) 0.108 Crop Management Practice 0.8065(0.39830) 0.2823(0.45192) 0.006** Soil Fertility Management 0.7903(0.41040) 0.3629(048279) 5.780
Livestock Breeds 0.6129(0.49106) 0.2661(0.44373) 0.003**
Livestock Management Practice 0.5968(0.49455) 0.2661(0.44373) 0.001** Post Harvesting Handling 0.6935(0.46478) 0.2823(0.45192) 0.055* Financial/Record Keeping 0.8387(0.37080) 0.1935(0.39668) 1.185 Agricultural Marketing 0.8387(0.37080) 0.2339(0.42501) 0.001
Proportion reporting asking for the technology Technology
FII Beneficiaries All Non Beneficiaries
T-test (p value)
(n = 62) (n = 124)
Improved Crop Varieties 0.8548(0.35514) 0.1774(0.38357) 0.261 Crop Management Practice 0.8226(0.38514) 0.3306(0.47235) 0.000** Soil Fertility Management 0.6935(0.46478) 0.2984(0.45941) 0.824
Livestock Breeds 0.7419(0.44114) 0.1129(0.31776) 0.000**
Livestock Management Practice 0.4839(0.50382) 0.1694(0.37659) 0.000** Post Harvesting Handling 0.6290(0.48701) 0.1694(0.37659) 0.000** Financial/Record Keeping 0.8548(0.35514) 0.1371(0.34534) 0.767 Agricultural Marketing 0.8387(0.37080) 0.2903(0.45575) 0.000** Note: Figures in parentheses are standard deviation, ** significant at 5%.
Table 2 shows that the Fadama II, Radio and ADP are the major providers of production technologies (improved crop varieties, soil fertility management, and livestock production) for both beneficiaries and
o e efi iaries. The ADP’s fo us o pro idi g ai ly agri ultural produ tio te h ologies is si ilar to
the pattern of public extension services observed in other developing countries (Qamar, 2005). However, it is interesting to note that the State Fadama Development Office (SFDO) was the source of production technologies for about 50 percent of the beneficiary respondents who adopted those technologies.
68 www.hrmars.com/journals services. This implies that certain group of the community members is receiving free services, because Fadama II beneficiaries contribute 10 percent of the costs of advisory services, whereas nonbeneficiaries presumably do not contribute. The results have implications on the user-fee arrangement that Fadama II uses. Collection of user fees from non–Fadama II households could be difficult because they may not be in organized groups and may not have any form of contract that could facilitate collection of user fees.
Table 18: Sources of advisory services by type of production technology Technology/Source of
Information Proportion of Respondents
FII Beneficiaries
All Non
Beneficiaries T-test (p value)
Improved Crop Varieties n = 38 n = 96
SFDO 0.1129(0.31906) 0.0041(0.0001) 3.951 0.007**
ADP 0.1290(0.33797) 0.0403(0.19751) 2.255 0.025**
MANR 0.1290(0.33797) 0.0726(0.26050) 1.155 0.251
Radio/TV 1.2419(1.39889) 0.1129(0.31776 6.275 0.000**
Farmer association 0.0323(0.17813) 0.1935(0.39668) -3.048 0.003**
Individual 0.0645(0.24768) 0.1694(0.37659) -1.986 0.048**
Others 0.0323(0.17813) 0.4113(0.49406) -5.847 0.000**
Crop Management
Practices n = 42 n = 84
Fadama II 0.0968(0.29806) 0.0011(0.0001) 2.557 0.013**
ADP 0.1290(0.33797) 0.0081(0.08980) 2.770 0.007**
MANR 0.0968(0.29806) 0.0645(0.24667) 0.783 0.435
Radio/TV 0.4516(0.50172) 0.0887(0.28548) 6.282 0.000**
Farmer Association 0.1290(0.33797) 0.1210(0.32741) 0.157 0.088
Individual 0.0806(0.27451) 0.0806(0.27339) 0.000 1.000**
Others 0.0161(0.127000) 0.6290(0.04850) -9.772 0.000**
Soil Fertility
Management n = 52 n = 74
Fadama II 0.0484(0.21633) 0.0021(0.00002) 1.761 0.083
ADP 0.968(0.29806) 0.0323(0.17740) 1.846 0.067
MANR 0.2419(0.43175) 0.0569(0.23262) 3.152 0.002**
Radio/TV 0.3065(0.46478) 0.0726(0.26050) 3.683 0.001**
Farmer Association 0.1613(0.37080) 0.1371(0.42931) 0.379 0.705
Individual 0.1129(0.31906) 0.0726(0.26050) 0.922 0.358
Others 0.0323(0.17813) 0.6532(0.47787) -12.800 0.000
Livestock Breed n = 58 n = 92
Fadama II 0.2258(0.42153) 0.0045(0.0004) 4.218 0.000**
ADP 0.1774(0.38514) 0.0323(0.17740) 2.822 0.006**
MANR 0.1290(0.33797) 0.0484(0.21545) 1.975 0.050
Radio/TV 0.7097(1.17887) 0.1613(0.36929) 3.576 0.001**
Farmer Association 0.0806(0.27451) 0.2177(0.41439) -2.358 0.019
Individual 0.0645(0.24768) 0.1532(0.36167) -1.737 0.084
Others 0.0056(0.0034) 0.3871(0.48906) -5.224 0.000**
69 www.hrmars.com/journals Practice Fadama II ADP MANR Radio/TV Farmer Association Individual Others 0.0645(0.24768) 0.2997(0.41040) 0.2097(0.41040) 0.4194(0.49748) 0.0484(0.21633) 0.0484(0.21633) 0.0161(012700) 0.0087(0.0006) 0.0484(0.21545) 0.0806(0.27339) 0.1532(0.36167) 0.1855(0.39027) 0.1613(0.36929) 0.3871(0.48906) 2.051 2.901 2.240 3.746 -2.573 -2.222 -5.867 0.045** 0.005** 0.028** 0.000** 0.011** 0.027** 0.000**
Note: ADP Agricultural Development Project, MANR Min, of Agric. and Natural Resource, ** significant at5% level of significant and figures in parentheses are standard deviation
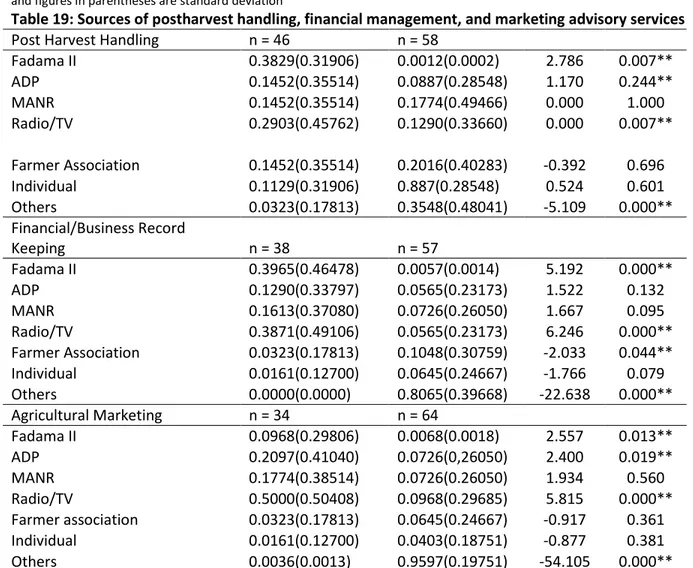
Table 19: Sources of postharvest handling, financial management, and marketing advisory services
Post Harvest Handling n = 46 n = 58
Fadama II 0.3829(0.31906) 0.0012(0.0002) 2.786 0.007**
ADP 0.1452(0.35514) 0.0887(0.28548) 1.170 0.244**
MANR 0.1452(0.35514) 0.1774(0.49466) 0.000 1.000
Radio/TV 0.2903(0.45762) 0.1290(0.33660) 0.000 0.007**
Farmer Association 0.1452(0.35514) 0.2016(0.40283) -0.392 0.696
Individual 0.1129(0.31906) 0.887(0.28548) 0.524 0.601
Others 0.0323(0.17813) 0.3548(0.48041) -5.109 0.000**
Financial/Business Record
Keeping n = 38 n = 57
Fadama II 0.3965(0.46478) 0.0057(0.0014) 5.192 0.000**
ADP 0.1290(0.33797) 0.0565(0.23173) 1.522 0.132
MANR 0.1613(0.37080) 0.0726(0.26050) 1.667 0.095
Radio/TV 0.3871(0.49106) 0.0565(0.23173) 6.246 0.000**
Farmer Association 0.0323(0.17813) 0.1048(0.30759) -2.033 0.044**
Individual 0.0161(0.12700) 0.0645(0.24667) -1.766 0.079
Others 0.0000(0.0000) 0.8065(0.39668) -22.638 0.000**
Agricultural Marketing n = 34 n = 64
Fadama II 0.0968(0.29806) 0.0068(0.0018) 2.557 0.013**
ADP 0.2097(0.41040) 0.0726(0,26050) 2.400 0.019**
MANR 0.1774(0.38514) 0.0726(0.26050) 1.934 0.560
Radio/TV 0.5000(0.50408) 0.0968(0.29685) 5.815 0.000**
Farmer association 0.0323(0.17813) 0.0645(0.24667) -0.917 0.361
Individual 0.0161(0.12700) 0.0403(0.18751) -0.877 0.381
Others 0.0036(0.0013) 0.9597(0.19751) -54.105 0.000**
70 www.hrmars.com/journals public funding of advisory services for such farmers may still remain the only viable option. It is also interesting to note that farmer groups and individual farmers are among the important providers of some advisory services. For example, significant share of nonbeneficiaries and Fadama II beneficiaries received agricultural marketing advisory services from fellow farmers. This demonstrates the important role that farmers play in providing advisory services. Radio and TV also play an important role in providing some advisory services. Crop management practices, livestock management practices, improved crop varieties, and agricultural marketing are mostly provided by radio/TV (Table 1&2). Fadama II has used radio and TV programs to promote various technologies. Radio is an especially important tool for disseminating advice on agricultural technologies (Nwaerondu and Thompson, 1987). Radio communication is becoming increasingly important in rural areas where ownership of private FM radios continues to spread. The major challenge for the use of the mass media is to ensure that programs are accessible to all listeners by using local languages in rural areas. Adamawa Fadama II has used local languages on the local radios/TVs to disseminate information to the benefiting communities.
In summary, Fadama II has focused on providing postharvest handling, agricultural marketing, livestock management practices, crop management practices, and financial management advisory services and have made significantly greater impact compared with nonbeneficiaries at 5% level of significance. On the other hand, nonbeneficiaries reported significantly greater demand for soil fertility management technologies and financial advisory services than did beneficiaries (at p = .05). The possible explanation for the latter result is that financial advisory services were provided to Fadama II beneficiaries through the capacity building component, which initially used a supply-driven approach to help beneficiaries to initiate their economic activities on a commercial basis. The results underline the greater demand for postproduction advisory services (especially on postharvest handling) and suggest the need to increase the provision of financial advisory services. Those services are important for implementing the National Economic Empowerment and Development Strategy framework, which aims to reduce poverty by transforming subsistence agriculture to commercial agriculture (NNPC, 2004).
The Fadama II project has had limited impact on provision of production advisory services. On the other hand, the public extension service provider (the ADP) has focused on providing production advisory services using mainly a supply-driven approach. Thus, the two projects appear to be complementing each other but use different approaches. The country has used several extension approaches promulgated by donors and projects (Oladele et al., 2004). As it strives to reform its extension systems toward more pluralistic systems, the government needs to harmonize existing approaches and seek to use those that are complementary rather than conflicting (Oladele et al., 2004). Complementary approaches will certainly increase the effectiveness of the advisory services. For example, the Fadama II project has already gained experience in providing demand-driven nonproduction technologies (postharvest, marketing, financial management and processing technologies), while the ADP has long-standing experience in providing production technologies.
71 www.hrmars.com/journals
Conclusion and Policy Implication
The study was carried out with the main objective of determining the impact of Fadama II on adoption and demand for advisory services among the beneficiaries. Fadama II has increased demand for postharvest handling, agricultural marketing, livestock management practices, crop management practices, and financial management advisory services and have made significantly greater impact compared with nonbeneficiaries at 5% level of significance but did not have a significant impact on the demand for improved crop varieties and soil fertility management technologies, perhaps because of its emphasis on providing postproduction advisory services. The Fadama II project has had limited impact on provision of production advisory services probably because the public extension service provider (the ADP) has focused on providing production advisory services using mainly a supply-driven approach. Thus, the two projects appear to be complementing each other but use different approaches
The project needs to consider supporting soil fertility management to enhance the effectiveness of productive assets and other interventions and to address the potential land degradation that could result from higher agricultural productivity. It is also important for Fadama II to invest in providing advisory services on production technologies, because the ADP has limited funding to effectively provide such services. As it strives to reform its extension systems toward more pluralistic systems, the government needs to harmonize existing approaches and seek to use those that are complementary rather than conflicting.
Reference
Alston J.M, & Parde, P.G.( 2001). Attribution and other problems in assessing returns to agricultural R&D. Agricultural Economics, 25, 141-152.
IDA. (2009). International Development Association at work: Nigeria: Strengthening communities and reducing poverty. Available at; http://go.worldbank.org/8254R18HC0.
IFPRI. (2007). Sustainable solution for ending hunger and poverty: International Food Policy Research Institute. Fadama II Abuja, Nigeria.
National Fadama Development Office (NFDO) ( 2005). Poverty reduction through increased productivity and empowerment. Abuja, Nigeria: NFDO, Project Coordination Unit.
Nigerian National Planning Commission (NNPC). (2004). National Economic Empowerment and Development (NEEDS) Abuja, Nigeria.
Nwaerondu, N. & Thompson, G. (1987). The use of educational radio in developing Countries. Lesson from the past. Journal of Distance Education. Available at htt://cade.athabascau.ca.vol12.2/7 Nwaerondu and Thompson. Html.
Oladele, O., Koyoma, O. & Sakagama, J.(2004). Africa in search of extension system:Experience from Nigeria. Food, Agriculture and Environment, 2(1), 276–280
Ozor, N., Agwu, A., Chukwuone, N., Madukwe, M. & Garforth, C. (2007). Cost-sharing of agricultural technology transfer in Nigeria: Perceptions of farmers and extension professionals. Journal of Agricultural Education and Extension, 13(1), 23–37.
Qamar, K. (2005). Modernizing national agricultural extension systems: A practical guide For policy makers of developing countries. Rome: United Nations Food and Agricultural Organization. Smith, J. & Todd, P. (2001). Does matching overcome LaLonde's critique of nonexperimental