www.biogeosciences.net/13/4569/2016/ doi:10.5194/bg-13-4569-2016
© Author(s) 2016. CC Attribution 3.0 License.
Greenhouse gas emissions and reactive nitrogen releases
from rice production with simultaneous incorporation
of wheat straw and nitrogen fertilizer
Longlong Xia1,2, Yongqiu Xia1, Shutan Ma1,2, Jinyang Wang1, Shuwei Wang1,2, Wei Zhou1,2, and Xiaoyuan Yan1
1State Key Laboratory of Soil and Sustainable Agriculture, Institute of Soil Science, Chinese Academy
of Sciences, Nanjing 210008, China
2University of Chinese Academy of Sciences, Beijing 100049, China Correspondence to:Xiaoyuan Yan (yanxy@issas.ac.cn)
Received: 2 December 2015 – Published in Biogeosciences Discuss.: 18 January 2016 Revised: 29 June 2016 – Accepted: 25 July 2016 – Published: 12 August 2016
Abstract. Impacts of simultaneous inputs of crop straw and nitrogen (N) fertilizer on greenhouse gas (GHG) emis-sions and N losses from rice production are not well un-derstood. A 2-year field experiment was established in a rice–wheat cropping system in the Taihu Lake region (TLR) of China to evaluate the GHG intensity (GHGI) as well as reactive N intensity (NrI) of rice production with inputs of wheat straw and N fertilizer. The field experiment in-cluded five treatments of different N fertilization rates for rice production: 0 (RN0), 120 (RN120), 180 (RN180), 240 (RN240), and 300 kg N ha−1 (RN300, traditional N
appli-cation rate in the TLR). Wheat straws were fully incorpo-rated into soil before rice transplantation. The meta-analytic technique was employed to evaluate various Nr losses. Re-sults showed that the response of rice yield to N rate suc-cessfully fitted a quadratic model, while N fertilization pro-moted Nr discharges exponentially (nitrous oxide emission, N leaching, and runoff) or linearly (ammonia volatilization). The GHGI of rice production ranged from 1.20 (RN240) to 1.61 kg CO2equivalent (CO2eq) kg−1(RN0), while NrI
var-ied from 2.14 (RN0) to 10.92 g N kg−1 (RN300). Methane (CH4)emission dominated the GHGI with a proportion of
70.2–88.6 % due to direct straw incorporation, while ammo-nia (NH3)volatilization dominated the NrI with proportion
of 53.5–57.4 %. Damage costs to environment incurred by GHG and Nr releases from current rice production (RN300) accounted for 8.8 and 4.9 % of farmers’ incomes, respec-tively. Cutting N application rate from 300 (traditional N rate) to 240 kg N ha−1could improve rice yield and nitrogen
use efficiency by 2.14 and 10.30 %, respectively, while si-multaneously reducing GHGI by 13 %, NrI by 23 %, and to-tal environmento-tal costs by 16 %. Moreover, the reduction of 60 kg N ha−1improved farmers’ income by CNY 639 ha−1, which would provide them with an incentive to change the current N application rate. Our study suggests that GHG and Nr releases, especially for CH4emission and NH3
volatiliza-tion, from rice production in the TLR could be further re-duced, considering the current incorporation pattern of wheat straw and N fertilizer.
1 Introduction
Rice is the staple food for the majority of the world’s popula-tion. However, while it is an industry used to feed the global population, rice production is an important source of green-house gas (GHG) emissions and reactive nitrogen (Nr) re-leases (Yan et al., 2009; Chen et al., 2014). Rice production in China involves heavy methane (CH4) emissions due to
cultivation in intensive agricultural regions, characterized by high inputs of N fertilizer and crop residues, should be pri-oritized for the implementation of such evaluation (Ju et al., 2009; Chen et al., 2014).
The Taihu Lake region (TLR) is one of the most productive areas for rice production in China, largely owing to the pop-ularity of intensive cultivation (Zhao et al., 2012a, b). Cur-rently, rice yield of this region in some fields can reach up to 8000 kg ha−1or even higher (Ma et al., 2013; Zhao et al., 2015). However, these grain yields are achieved with a cost to environment (Ju et al., 2009). TLR generally receives 550– 600 kg N ha−1yr−1, with the rice-growing season accounting for nearly 300 kg N ha−1 (Zhao et al., 2012b). Aside from these excessive N inputs, TLR also experiences high amounts of crop residue incorporation, which is highly encouraged by local governments (Xia et al., 2014). However, direct straw incorporation before rice transplantation triggers substantial CH4 emissions (Ma et al., 2009, 2013). Besides such
sub-stantial releases of Nr and GHG in a direct way, indirect re-leases during the production of various agricultural materi-als used for farming operations are materi-also not ignorable, due to higher input rates of these materials caused by intensive culti-vation (Zhang et al., 2013; Cheng et al., 2014). This warrants the need for life-cycle assessment (LCA) of GHG emissions and Nr releases with respect to rice production in this region. Considerable environmental costs can be caused by the di-rect and indidi-rect releases of GHG and Nr from rice produc-tion in the TLR, for instance, in the form of global warming, water eutrophication, or soil acidification (Ju et al., 2009; Xia and Yan, 2011, 2012). Previous studies have proven that environmental costs assessment could provide guidance for emerging policy priorities in mitigating certain GHG or Nr species, after quantifying both their release amounts and damage costs to ecosystems (Gu et al., 2012). However, few studies have attempted to evaluate the total GHG and Nr re-leases and the associated environmental costs from rice pro-duction, with high inputs of N fertilizer and crop straw.
In the present study, we conducted 2 years of simultaneous measurements of CH4 and nitrous oxide (N2O) emissions
from a rice–wheat cropping system in the TLR to evaluate the impacts of simultaneous inputs of crop straw and N fertil-izer on (1) net global warming potential (NGWP) and GHG intensity (GHGI), (2) total Nr losses and Nr intensity (NrI), and (3) environmental costs incurred by these GHG and Nr releases associated with rice production, from the perspective of LCA.
2 Materials and methods 2.1 Experimental site
The field experiment was conducted in a paddy rice field at Changshu Agroecological Experimental Station (31◦32′93 N, 120◦41′88 E) in Jiangsu province, which is
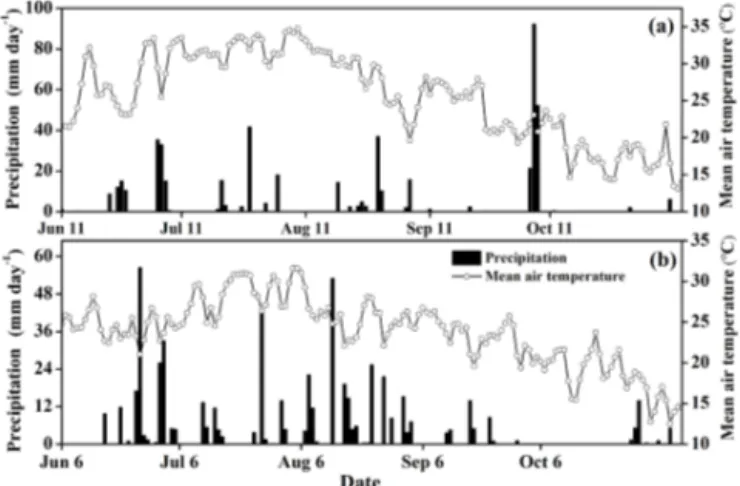
lo-Figure 1. Seasonal variations in the daily precipitation and the temperature during the two rice-growing seasons of(a)2013 and
(b)2014.
cated in the TLR of China, where the cropping system is pri-marily dominated by summer rice (Oryza sativaL.) and win-ter wheat (Triticum aestivumL.) rotation. The climate of the study area is subtropical monsoon, with a mean air tempera-ture of 16.1◦C and mean annual precipitation of 990 mm, of
which 60–70 % occurs during the rice-growing season. The daily mean temperature and precipitation during two rice-growing seasons from 2013 to 2014 are shown in Fig. 1. The paddy soil is classified as Anthrosol, which develops from lacustrine sediments. The topsoil (0–20 cm) has a pH of 7.68 (H2O). The bulk density is 1.16 g cm−3, the organic C
con-tent is 20.1 g C kg−1, the total N is 1.98 g kg−1, the available P is 11.83 mg kg−1, and the available K is 126 mg kg−1. 2.2 Experimental design and field management
The field experiment included five treatments of different N fertilization rates for rice production: 0 (RN0), 120 (RN120), 180 (RN180), 240 (RN240), and 300 kg N ha−1(RN300, tra-ditional N application rate in the TLR). Consistent with local practices, wheat straws were harvested, chopped, and fully incorporated into soil before rice transplantation in all treat-ments (Table 1). All of the treattreat-ments are laid out in a ran-domized block design with three replicates, and each plot covered an area of 3 m×11 m (33 m2).
Rice is transplanted in the middle of June and harvested at the beginning of November. N fertilizer (in the form of urea) was split into three parts during the rice-growing season: 40 % as basal fertilizer, 30 % as tiller fertilizer, and 30 % as panicle fertilizer. Phosphorus (in the form of calcium super-phosphate) and potassium (in the form of potassium chloride) were applied as basal fertilizer at rates of 30 kg P2O5ha−1
and 60 kg K2O ha−1, respectively. All basal fertilizers were
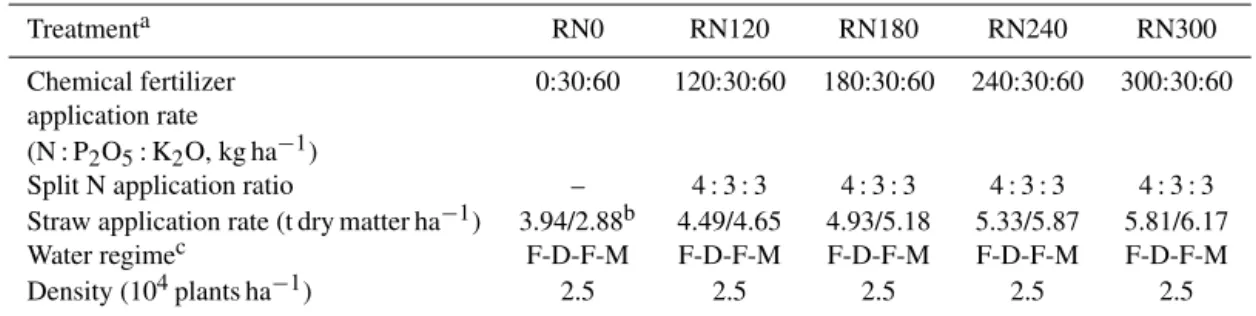
Table 1.Field experimental treatments and agricultural management practices during the rice-growing seasons of 2013 and 2014 in the Taihu Lake region.
Treatmenta RN0 RN120 RN180 RN240 RN300
Chemical fertilizer 0:30:60 120:30:60 180:30:60 240:30:60 300:30:60 application rate
(N : P2O5: K2O, kg ha−1)
Split N application ratio – 4 : 3 : 3 4 : 3 : 3 4 : 3 : 3 4 : 3 : 3 Straw application rate (t dry matter ha−1) 3.94/2.88b 4.49/4.65 4.93/5.18 5.33/5.87 5.81/6.17
Water regimec F-D-F-M F-D-F-M F-D-F-M F-D-F-M F-D-F-M
Density (104plants ha−1) 2.5 2.5 2.5 2.5 2.5
aRN0, RN120, RN180, RN240, and RN300 represent N application rates of 0, 120, 180, 240, 300 kg N ha−1, respectively.b3.94/2.88 denotes that straw application rates during the rice-growing seasons of 2013 and 2014 are 3.94 and 2.88 t dry matter ha−1, respectively.cF, flooding; D, mid-season drainage; M, moist but non-waterlogged by intermittent irrigation.
with flooding followed by mid-season drainage, which is in turn followed by flooding and moist but non-waterlogged by intermittent irrigation. Details of the specific agricultural management practices for rice production are provided in Ta-ble 1.
2.3 Gas fluxes and topsoil organic carbon sequestration rate
The CH4and N2O fluxes during the rice-growing seasons of
2013 and 2014 were measured using a static chamber and gas chromatography technique. Details of the procedures used for sampling and analysis the gases are described in Xia et al. (2014).
Generally, it takes long-term observations over years to decades before the soil organic carbon (SOC) change is de-tectable (Yan et al., 2011). The SOC content changes in the short-term field experiment could not be correctly mea-sured, due to the high variability in SOC during the pre-liminary several years of the experiment. Therefore, we used the following relationship between the straw input rate (kg C ha−1yr−1)and SOC sequestration rate (SOCSR,
kg C ha−1yr−1), obtained through an ongoing long-term
straw application experiment in the same region, to calculate the SOCSR in this study (Xia et al., 2014):
SOCSR=straw input rate×0.0603+31.39
(R2=0.92). (1)
This ongoing long-term field experiment is also taking place at the Changshu Agroecological Experimental Station (since 1990), which includes three straw application levels: 0, 4.5 t, and 9.0 t dry weight ha−1yr−1. The Eq. (1) was established based on the results of 22 years of observation (Xia et al., 2014). Same agricultural management practices were applied to the ongoing long-term experiment and the experiment of this study.
2.4 Net global warming potential and greenhouse gas intensity
The net global warming potential (NGWP, kg CO2eq ha−1)
and greenhouse gas intensity (GHGI, kg CO2 eq kg−1)of
rice production in the TLR were calculated using the follow-ing equations:
NGWP=Xm
i=1AIico2+CH4×25+N2O×44/28
×298−SOCSR×44/12, (2)
GHGI=NGWP/rice yield, (3)
where AIico2 denotes the GHG emissions from the produc-tion and transportaproduc-tion of agricultural inputs, which are cal-culated by multiplying their application rates by their indi-vidual GHG emission factors, such as synthetic fertilizers, diesel oil, electricity, and pesticides (Liang, 2009; Zhang et al., 2013). CH4 (kg CH4ha−1), N2O (kg N ha−1), and
SOCSR (kg C ha−1yr−1)represent the CH4and N2O
emis-sions from rice production and the SOC sequestration rate, respectively.
2.5 Total Nr losses and Nr intensity
The total Nr losses (kg N ha−1) and Nr intensity (NrI, g N kg−1)were calculated using the following equations:
Total Nr losses=Xm i=1AIiNr
+(NH3+N2O+Nleaching+Nrunoff)rice; (4)
NH3volatilization=0.17×Nrate+0.64, (5)
N runoff=5.39×Exp(0.0054×Nrate), (6)
N leaching=1.44×Exp(0.0037×Nrate), (7)
volatilization, N2O emissions, N leaching, and runoff during
the rice-growing season. Nraterepresents the N fertilizer
ap-plication rate. Nr empirical models (Eqs. 5, 6, 7) are derived from a meta-analysis of published literature concerning Nr losses from rice production in the TLR. Specific details re-garding this literature survey are provided in the Supplement. 2.6 Total environmental costs incurred by GHG and
Nr releases and farmers’ income
The total environmental costs (CNY ha−1)incurred by GHG and Nr releases and farmers’ income from rice production in the TLR were calculated based on the following equations: Environmental costs=Xn
i=1(NriA×DCi)
+CO2A×DCCO2, (9) Farmer’s income=rice yield×rice price
−input costs. (10)
NriA (kg N) represents the release amounts of certain Nr species (i) and DCi (CNY kg−1N) denotes the damage cost (DC) per kg of certain Nr (i). CO2A (t) and DCCO2 (CNY t−1)represent the CO2emissions amount and global
warming cost of CO2, respectively. N2O is both a GHG and
Nr species, but its environmental cost was calculated as a GHG here. Because the cost of N2O emission as Nr species
is to damage human health (Gu et al., 2012), but the effects of Nr losses on the damage costs of human health were not included in this study. The environmental costs mainly refer to the global warming incurred by GHG emissions, soil acid-ification incurred by NH3and NOx emissions, and aquatic eutrophication caused by NH3 emissions, N leaching, and
runoff (Xia and Yan, 2012).
2.7 Nitrogen use efficiency and N2O emission factor Nitrogen use efficiency (NUE) and the N2O emission factor
(EFd%) were respectively calculated by the following equa-tions (Ma et al., 2013; Yan et al., 2014):
NUE=(UN−U0)/FN, (11)
EFd%=(EN−E0)/FN, (12)
whereUNis the grain N uptake (kg ha−1)measured in grain
at physiological maturity in the N fertilization treatments, while U0is the N uptake measured in grain in the treatment
without N fertilizer addition (RN0). EN denotes the
cumu-lative N2O emissions in the N fertilization treatments, while E0denotes the N2O emissions in the RN0.FNrepresents the
application rate of N fertilizer. The N uptake in straw and grain was analyzed via concentrated sulfuric acid digestion and the Kjeldahl method (Zhao et al., 2015).
2.8 Statistical analysis
Differences in seasonal CH4, N2O emissions, and rice yield
of the two rice-growing seasons from 2013 to 2014 affected
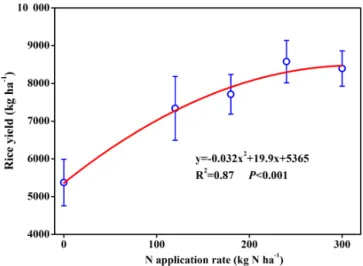
Figure 2.Relationship between N fertilizer application rate and av-erage rice yield over the two rice-growing seasons of 2013 and 2014 in the Taihu Lake region. The vertical bars represent standard errors.
by fertilizer treatments, year, and their interaction were ex-amined by using a two-way analysis of variance (ANOVA; Table 2). The grain yield, seasonal CH4, and N2O emissions,
SOCSR and GHGI of different treatments were tested by ANOVA, and mean values were compared by least signif-icant difference (LSD) at the 5 % level. All these analyses were carried out using SPSS (version 19.0, USA).
3 Results and discussion 3.1 Rice yield and NUE
The two-way ANOVA analyses indicated that the rice grain yields were significantly affected by the year and fertilizer treatment (Table 2). The farmers’ practice plot (RN300) had an average rice grain yield of 8395 kg ha−1, with an NUE of 31.35 %, over the two growing seasons from 2013 to 2014. Compared with RN300, reducing the N fertilizer rate by 20 % (RN240) slightly improved the grain yield and NUE to 8576 kg ha−1and 34.58 %, respectively. Further N reduction, without additional agricultural managements, could decrease the rice yield by 8.15 % (RN180) and 15.18 % (RN120; Ta-ble 3). The response of rice yield to the synthetic N applica-tion rate in our study successfully fitted a quadratic model (Fig.2), as has been reported in previous studies (Xia and Yan, 2012; Cui et al., 2013a). Reducing N application reason-ably, therefore, is considered essential to reduce environmen-tal costs, without sacrificing grain yield (Chen et al., 2014). Our study showed that lowering the N input adopted by local farmer (300 kg N ha−1)by 20 % could still enhance the grain yield and NUE. However, a further reduction of N by 40 % (RN180) would largely impair the rice yield (Table 3).
Table 2.Two-way ANOVA for the effects of fertilizer (F) application and year (Y) on CH4and N2O emissions, and rice grain yields in rice
paddies.
CH4(kg ha−1) N2O (kg N ha−1) Yield (kg ha−1)
Factor df SS F P SS F P SS F P
F 4 8739 0.79 0.55 0.33 12.46 < 0.01 39 297 547 32.96 < 0.01 Y 1 4492 1.62 0.22 0.11 16.41 < 0.01 2 810 414 9.43 < 0.01
F×Y 4 2532 0.23 0.92 0.18 7.1 < 0.01 750 639 0.63 0.65
Model 9 15 763 0.63 0.77 0.62 10.52 < 0.01 42 858 600 15.97 < 0.01
Error 16 20 0.13 5 962 260
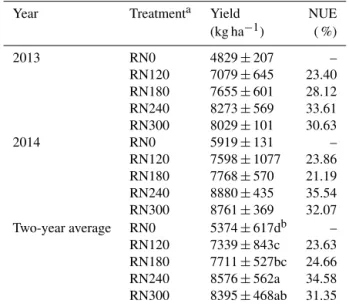
Table 3.Rice yield and nitrogen use efficiency (NUE) for the two rice-growing seasons from 2013 to 2014 in the Taihu Lake region.
Year Treatmenta Yield NUE
(kg ha−1) ( %)
2013 RN0 4829±207 –
RN120 7079±645 23.40
RN180 7655±601 28.12
RN240 8273±569 33.61
RN300 8029±101 30.63
2014 RN0 5919±131 –
RN120 7598±1077 23.86
RN180 7768±570 21.19
RN240 8880±435 35.54
RN300 8761±369 32.07
Two-year average RN0 5374±617db – RN120 7339±843c 23.63 RN180 7711±527bc 24.66 RN240 8576±562a 34.58 RN300 8395±468ab 31.35
aDefinitions of the treatment codes are given in the footnotes of Table 1. bMean±SD; different letters within the same column indicate a significant difference atp< 0.05.
reported that, based on knowledge-based N managements, such as optimizing N fertilizer source, rate, timing, and place (in accordance with crop demand), rice grain yield in the TLR was not significantly affected by a 30–60 % N saving, while various Nr losses would experience a two-fold curbing. Similarly, Zhao et al. (2015) found that the NUE could be im-proved from 31 to 44 %, even under a N reduction of 25 % for rice production in the TLR, through the implementation of integrated soil–crop system managements. In the present study, the NUE was improved by 10 via a 20 % N reduction, but it still falls behind the NUE values in the studies which received knowledge-based N managements. Previous studies have proven that straw incorporation exerted little impacts on grain yield. For instance, a meta-analysis conducted by Singh et al. (2005) found that incorporation of crop straw produced no significant trend in improving crop yield in rice-based cropping systems. Moreover, based on a long-term straw in-corporation experiment established in 1990 in the TLR, Xia
et al. (2014) reported that long-term incorporation of wheat straw only increased the rice yield by 1 %. Therefore, in the present study, the effects of straw incorporation on rice yield were considered inappreciable.
3.2 CH4, N2O emissions and SOSCR
Over the two rice-growing seasons from 2013 to 2014, all treatments showed similar patterns of CH4fluxes, albeit with
large interannual variation (Fig. 3a). The seasonal average CH4 emissions from all plots showed no significant
differ-ence, ranging from 289.53 kg CH4ha−1in the RN180 plot
to 334.61 kg CH4ha−1 in the RN120 plot (Table 4), much
higher than observations conducted in the same region (Zou et al., 2005; Ma et al., 2013). This phenomenon can be at-tributed to the larger amounts of straw incorporation in this study (Table 1). Relative to the RN300 plot, CH4emissions
from the RN240 plot decreased by 8 and 10 %, during the rice-growing season of 2013 and 2014, respectively, although this effect was not statistically significant (Table 4).
Many studies have shown a clear linear relationship be-tween CH4 emissions and the amounts of applied organic
matter (OM; Shang et al., 2011; Xia et al., 2014). It is pos-sible that the linear response of CH4 emissions to OM
in-puts can become flat or even unobvious (Fig. S1 in the Sup-plement) when the OM application rates among different treatments were insignificant different (Table S1 in the Sup-plement). It is unsurprising that no obvious relationship be-tween CH4emissions and N fertilizer application rates was
observed in this study (Fig. S1), because the effects of N fertilization on CH4 production, transportation, and
oxida-tion are complex. For instance, N fertilizaoxida-tion can provide methanogens with more carbon substrates in the rhizosphere of plants by stimulating the growth of rice biomass, thus pro-moting CH4production and transportation (Zou et al., 2005;
Banger et al., 2012). On the other hand, N enrichment could also enhance the activities of methanotrophs, therefore en-hancing CH4oxidation (Xie et al., 2010; Yao et al., 2013).
The N2O fluxes were sporadic and pulse-like, and these
fluxes showed large variations between different seasons, and the majority of the N2O peaks occurred after the application
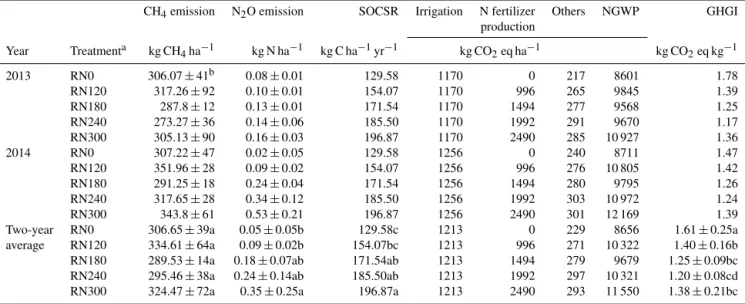
in-Table 4.The net global warming potential (NGWP) and greenhouse gas intensity (GHGI) for the two rice-growing seasons from 2013 to 2014 in the Taihu Lake region.
CH4emission N2O emission SOCSR Irrigation N fertilizer Others NGWP GHGI production
Year Treatmenta kg CH4ha−1 kg N ha−1 kg C ha−1yr−1 kg CO2eq ha−1 kg CO2eq kg−1
2013 RN0 306.07±41b 0.08±0.01 129.58 1170 0 217 8601 1.78
RN120 317.26±92 0.10±0.01 154.07 1170 996 265 9845 1.39
RN180 287.8±12 0.13±0.01 171.54 1170 1494 277 9568 1.25
RN240 273.27±36 0.14±0.06 185.50 1170 1992 291 9670 1.17
RN300 305.13±90 0.16±0.03 196.87 1170 2490 285 10 927 1.36
2014 RN0 307.22±47 0.02±0.05 129.58 1256 0 240 8711 1.47
RN120 351.96±28 0.09±0.02 154.07 1256 996 276 10 805 1.42
RN180 291.25±18 0.24±0.04 171.54 1256 1494 280 9795 1.26
RN240 317.65±28 0.34±0.12 185.50 1256 1992 303 10 972 1.24
RN300 343.8±61 0.53±0.21 196.87 1256 2490 301 12 169 1.39
Two-year RN0 306.65±39a 0.05±0.05b 129.58c 1213 0 229 8656 1.61±0.25a
average RN120 334.61±64a 0.09±0.02b 154.07bc 1213 996 271 10 322 1.40±0.16b
RN180 289.53±14a 0.18±0.07ab 171.54ab 1213 1494 279 9679 1.25±0.09bc
RN240 295.46±38a 0.24±0.14ab 185.50ab 1213 1992 297 10 321 1.20±0.08cd
RN300 324.47±72a 0.35±0.25a 196.87a 1213 2490 293 11 550 1.38±0.21bc
aDefinitions of treatment codes are given in the footnotes of Table 1.bMean±SD; different letters within same column indicate a significant difference atp< 0.05.
Figure 3.Seasonal variations in(a)CH4and(b)N2O fluxes
dur-ing the two rice-growdur-ing seasons from 2013 to 2014 in the Taihu Lake region. The arrow indicates N fertilizer application. The verti-cal bars represent standard errors.
dicated that the seasonal N2O emissions were significantly
affected by the year, the fertilizer treatment, and their interac-tions during the rice-growing seasons (Table 2). The average N2O emission during the two rice-growing seasons ranged
from 0.05 kg N ha−1 for RN0 to 0.35 kg N ha−1 for RN300 (Table 4), which increased exponentially as the N fertilizer rate increased; this shows that the reduction in N fertilizer rate is an effective approach to reduce the N2O emissions
(Zou et al., 2005; Zhang et al., 2012). The average N2O
emis-sion factors varied between 0.03 and 0.1 %, with an average of 0.07 %, which is comparable with previous studies (0.05–
0.1 %) conducted in the same region (Ma et al., 2013; Zhao et al., 2015).
The rice paddies have witnessed an increase in the SOC stock as a result of straw incorporation (Table 4). The es-timated topsoil (0–20 cm) SOCSR varied from 0.13 for the RN0 plot to 0.197 t C ha−1yr−1for the RN300 plot. The em-pirical model established through a long-term straw incorpo-ration study in the same region was employed to evaluate the SOCSR in this study, which likely brought uncertainty into the results of this study. Under the same agricultural manage-ments, soil and climatic conditions, cropping systems, and straw types, it is reasonable to believe that the rates of straw C stabilizing into SOC (i.e., conversion efficiency of crop residue C into SOC) are similar between these two experi-ments (Mandal et al., 2008). It is reported that the conversion rates of crop straw to SOC in two main wheat/maize pro-duction regions in China, which have similar climatic con-ditions and agricultural practices, were very close, at 40.524 vs. 40.607 kg SOC-C t−1dry-weight straw (Lu et al., 2009). Moreover, the current estimated SOCSR for rice production in the TLR (0.197 t C ha−1)is comparable to the estimation of 0.17 t C ha−1yr−1from Ma et al. (2013) in a study based
on a paddy field experiment with OM incorporation in the same region. Therefore, we hold the opinion that the above SOCSR calculation method is appropriate, and the uncer-tainty incurred by this method unlikely affects the main con-clusions of this study.
emissions. When converting to CO2 eq, the SOCSR only
offsets the CH4 emissions by 6.2–9.2 % in this study
(Ta-ble 4). This proportion is expected to increase provided that appropriate straw incorporation method (e.g., compost straw before incorporation) and conservative tillage are adopted. Moreover, previous studies have shown that the combined adoption of conservative-tillage system with straw return had large advantages in increasing SOC stocks while reducing CH4emissions (Zhao et al., 2015a, b).
3.3 NGWP and GHGI
The average NGWP for all treatments varied from 8656 to 11 550 kg CO2eq ha−1(Table 4). CH4emissions dominated
the NGWP in all treatments, with the proportion ranging from 70.23 % to 88.56 %, while synthetic N fertilizer pro-duction was the secondary contributor (Table 4). In addi-tion, SOC sequestration offset the positive GWP by 5.18– 6.18 % in the fertilization treatments. Compared to conven-tional practice (RN300), the NGWP in the 20 % reduction N practice (RN240) decreased by 10.64 %. Therein, 6.28 % came from CH4 reduction and 4.31 % from N production
savings (Table 4). The GHGI of rice production ranged from 1.20 (RN240) to 1.61 (RN0) kg CO2eq kg−1, which is higher
than previous estimation of 0.24–0.74 kg CO2 eq kg−1 for
rice production in other rice–upland crop rotation systems (Qin et al., 2010; Ma et al., 2013). Moreover, the GHGI of current rice production in the TLR (RW300) was estimated to be 1.45 times that of the national average value estimated by Wang et al. (2014a), at 1.38 vs. 0.95 kg CO2eq kg−1.
Such a phenomenon was attributed to the following reasons. First, compared to above studies, current higher amounts of direct straw incorporation (2.9–6.2 t dry matter ha−1), before rice transplantation in the TLR, triggered substantial CH4 emissions (290–335 kg CH4ha−1). Crop
residue incorporation is regarded as a win–win strategy to benefit food security and mitigate climate change, due to the fact that it possesses a large potential for carbon sequestra-tion (Lu et al., 2009). However, the GWP of straw-induced CH4emissions was reported to be 3.2–3.9 times that of the
straw-induced SOCSR, which indicates that direct straw in-corporation in paddy soils worsens rather than mitigates cli-mate changes, in terms of GWP (Xia et al., 2014). The SOC sequestration induced by straw incorporation only offset the positive GWP by 5.2–6.2 % in this study. Sensible methods of straw incorporation should therefore be developed to re-duce the substantial CH4 emissions without compromising
the build-up of SOC stock in the TLR.
Second, the high N application rate (300 kg N ha−1)in the TLR combined with the large emission factor of N fertil-izer production, 8.3 kg CO2eq kg−1 N (Zhang et al., 2013),
marked the sector of N fertilizer production as the secondary contributor to the GHGI (Table 4); this sector, however, was not involved in above-mentioned studies. Compared to lo-cal farmers’ practices (RN300), reducing the N rate by 20 %
(RN240) lowered the GHGI by 13 %, under the condition of straw incorporation, although this effect was not statistically significant (Table 4). Compared to RN240, however, further reduction of N rate (RN180 or RN120) increased the GHGI, due to the fact that rice yield was considerably reduced under excessive N reduction. Therefore, the joint application of rea-sonable N reduction and a judicious method of straw incor-poration would be promising in reducing the GHGI for rice production in the TLR, in consideration of the current situ-ation of simultaneous high inputs of N fertilizer and wheat straw.
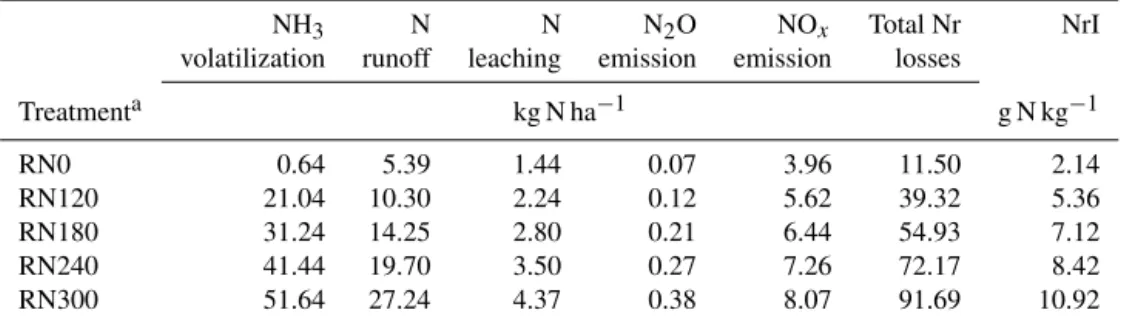
3.4 Various Nr losses and NrI
The results of the meta-analysis indicated that N2O
emis-sions, as well as N leaching and runoff, increased expo-nentially with an increase in N application rate (Fig. 4b– d,P< 0.01), while the response of NH3volatilization to N
rates fitted the linear model best (Fig. 4a,P< 0.01). The es-timated total Nr losses for all treatments varied from 39.3 to 91.7 kg N ha−1 in the fertilization treatments (Table 5), accounting for 30.1–32.8 % of N application rates. NH3
volatilization dominated the NrI, with the proportion rang-ing from 53.5 to 57.4 %, mainly because of the current fer-tilizer application method (soil surface broadcast) and high temperatures in the field (Zhao et al., 2012b; Li et al., 2014). N runoff was the second most important contributor (Ta-ble 5). Using 15N micro-plots combined with 3-year field measurements, Zhao et al. (2012b) reported that the total Nr losses from rice production in the TLR, under an N rate of 300 kg N ha−1, were 98 kg N ha−1, which is
compa-rable with our estimation of 91.69 kg N ha−1 in the RN300
plot. Similarly, Xia and Yan (2011) estimated the Nr losses for life-cycle rice production in this region to be around 90 kg N ha−1. The high proportion (30.1–32.8 %) of the ap-plied N fertilizer released as Nr from rice production in the TLR highlights the need to adopt reasonable N managements to increase the plant N uptake and reduce Nr losses (Ju et al., 2009).
The NrI of rice production in different plots varied be-tween 2.14 (RN0) and 10.92 g N kg−1 (RN300), which in-creased significantly as the N fertilizer rate inin-creased (Ta-ble 5). The NrI for rice production in the TLR was estimated to be 10.92 g N kg−1(RN300), which is 68 % higher than the national average value estimated by Chen et al. (2014), as a result of higher N fertilizer input in the TLR. Under the con-dition of straw incorporation, reducing N application rate by 20 % pulled the NrI down to 8.42 g N kg−1(RN240; Table 5).
Table 5.The seasonal average reactive N (Nr) losses and reactive N intensity (NrI) for the two rice-growing seasons from 2013 to 2014 in the Taihu Lake region.
NH3 N N N2O NOx Total Nr NrI
volatilization runoff leaching emission emission losses
Treatmenta kg N ha−1 g N kg−1
RN0 0.64 5.39 1.44 0.07 3.96 11.50 2.14
RN120 21.04 10.30 2.24 0.12 5.62 39.32 5.36
RN180 31.24 14.25 2.80 0.21 6.44 54.93 7.12
RN240 41.44 19.70 3.50 0.27 7.26 72.17 8.42
RN300 51.64 27.24 4.37 0.38 8.07 91.69 10.92
aDefinitions of treatment codes are given in the footnotes of Table 1.
Table 6.The economic indicators (two-season average) for rice production of the growing seasons from 2013 to 2014 in the Taihu Lake region (unit: CNY ha−1).
Treatmenta Yield Input Farmer’s
incomeb costsc incomed Environmental costse
GHG emissions Nr releases
RN0 16 125 4493 11 632 1143 71
RN120 22 020 6104 15 916 1363 376
RN180 23 130 6542 16 588 1278 535
RN240 25 725 7277 18 448 1362 700
RN300 25 185 7385 17 800 1525 874
aDefinitions of treatment codes are given in the footnotes of Table 1.bYield income=rice yield×rice price.cInput costs denote the economic input of purchasing various agricultural materials and hiring labor.dFarmer’s income=yield income – input costs.eEnvironmental costs denoted the sum of the acidification costs, eutrophication costs, and global warming costs incurred by GHG emissions and Nr releases. The cost prices of GHG and Nr releases are as follows: GHG emission, CNY 132 t−1CO2eq (Xia et al., 2014); NH3volatilization, CNY 13.12 kg−1N; N leaching, CNY 6.12 kg−1N; N runoff, CNY 3.64 kg−1N; NO
xemission, CNY 8.7 kg−1N (Xia and Yan, 2011).
than being released as various Nr (Huang et al., 2004; Xia et al., 2014). For instance, a meta-analysis, integrating 112 scientific assessments of the crop residue incorporation on the N2O emissions, has reported that the practice exerted no
statistically significant effect on the N2O releases (Shan and
Yan, 2013). Therefore, the effects of wheat straw incorpora-tion on various Nr losses were considered negligible in this study.
Extra attention should be paid to the interrelationship be-tween the NrI and GHGI, which could provide clues for the purpose of mitigation. For instance, N fertilizer production and application is an intermediate link between the NrI and GHGI (Chen et al., 2014). For the NrI, N fertilization pro-motes various Nr releases, exponentially or linearly (Fig. 4), while N production and application made a secondary contri-bution to the GHGI (Table 4). Such interrelationships ought to be taken into account fully for any mitigation options pur-sued in order to reduce the GHG emissions and Nr discharges from rice production simultaneously (Cui et al., 2013b; Cui et al., 2014).
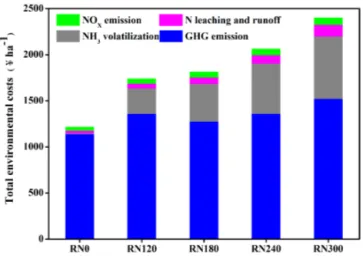
3.5 Economic evaluations of GHG emissions and Nr releases and their mitigation potential
The total environmental costs associated with the GHG emis-sions and Nr releases varied from CNY 1214 ha−1 for the RN0 to CNY 2399 ha−1for the RN300, which approximately accounted for 10.44–13.47 % of the farmers’ income and 27.05–32.47 % of the input costs (Table 6). CH4 emission
and NH3volatilization were the dominant contributors to the
total environmental costs (Table 4 and Fig. 5). The total dam-age costs to environment accounted for 13.5 % of farmers’ in-come under the current rice production in the TLR (RN300). Cutting the N rate from 300 to 240 kg N ha−1 slightly
im-proved the farmers’ income by 3.64 %, while further N re-duction would reduce the economic return of farmers (Ta-ble 6).
Figure 4. Relationship between N fertilizer application rate and
(a)NH3volatilization,(b)N runoff,(c)N leaching, and(d)N2O
emissions for rice production in the Taihu Lake region. These rela-tionships were obtained through a meta-analysis.
Figure 5.Seasonal average total environmental costs incurred by greenhouse gas (GHG) emissions and reactive N (Nr) losses for rice production in Taihu Lake region.
(Table 5), and 15.76 % for environmental costs (Table 6). Further reduction in GHG and Nr releases (especially for CH4emissions and NH3volatilization) is possible, with the
implementation of knowledge-based managements (Chen et al., 2014; Nayak et al., 2015). For the mitigation of Nr re-leases, switching the N fertilizer application method from surface broadcast to deep incorporation could largely lower the NH3volatilization from paddy soils (Zhang et al., 2012;
Li et al., 2014). Moreover, other optimum N managements, such as applying controlled-release fertilizers and urease in-hibitors, could also effectively increase the NUE and reduce the overall Nr losses (Chen et al., 2014). For the mitigation of GHG emissions, rather than being directly incorporated before rice transplantation, crop residues should be
preferen-tially decomposed under aerobic conditions or used to pro-duce biochar through pyrolysis, which could effectively re-duce CH4emissions (Linquist et al., 2012; Xie et al., 2013).
Moreover, these pre-treatments are also beneficial for carbon sequestration and yield production (Woolf et al., 2010; Lin-quist et al., 2012).
Most previous studies have merely focused on the quan-tification of GHG and Nr releases from food production from the perspective of environment assessments (Zhao et al., 2012b; Ma et al., 2013; Zhao et al., 2015). The per-spective of economic evaluation is seldom implemented, which goes against encouraging farmers to participate in the abatement of GHG and Nr releases on their own initiative (Xia et al., 2014). The current pattern of rice production in the TLR incurs great costs to the environment, accounting for 13.47 % of the net economic return that farmers ulti-mately acquire (Table 6). Such an evaluation facilitates the translation of highly specialized scientific conclusions into monetary-based information that is more familiar and acces-sible for farmers, and therefore likely encouraging them to adopt eco-friendly agricultural managements (Wang et al., 2014b). Profitability is generally considered the main driver for farmers to change their management approach. Com-pared to traditional N application rate, a reduction of 20 % would make environmental cost savings of 14 %, while si-multaneously improving the economic return of farmers by CNY 648 ha−1 (Table 6). This represents an incentive for farmers to optimize their N fertilizer application rates, pro-vided that such information is available to them.
Considering the fact that no specific carbon- and Nr-mitigation incentive programs, like the “Carbon Farming Ini-tiative” in Australia (Lam et al., 2013), have been launched in China, an ecological compensation incentive mechanism should be established by governments. This should be a national subsidy program with a special compensation and award fund to cover the extra mitigation costs induced by the adoption of knowledge-based mitigation managements for farmers (Xia et al., 2016). Such a program would provide farmers with a tangible incentive, thus guiding them towards gradually adopting the mitigation managements, which could effectively curb GHG emissions and Nr losses but likely ex-ert few positive effects on improving their net economic re-turn (Xia et al., 2014). Examples include the composing of crop straws aerobically, or their use to produce biochar be-fore incorporation (Xie et al., 2013), and encouraging the application of deep placement of N fertilizer (Wang et al., 2014b), as well as the application of enhanced-efficiency N fertilizers during the rice-growing season (Akiyama et al., 2010).
4 Conclusions
at-tributed to the current direct straw incorporation and exces-sive N fertilizer inputs. CH4emissions and NH3
volatiliza-tion dominated the GHG and Nr releases, respectively. Re-ducing N application rate by 20 % from the tradition level (300 kg N ha−1) could effectively decrease the GHG emis-sions, Nr releases and the damage costs to the environ-ment, while increasing the rice yield and improving farm-ers’ income simultaneously. Agricultural managements, such as letting straw decompose aerobically before its incorpora-tion and optimizing the applicaincorpora-tion method of N fertilizer, showed large potentials to further reduce the GHG (e.g., CH4
emission) and Nr releases (e.g., NH3volatilization) from rice
production in this region. Further studies are needed to evalu-ate the comprehensive effects of these managements on GHG emissions, Nr releases, and farmers’ economic returns.
The Supplement related to this article is available online at doi:10.5194/bg-13-4569-2016-supplement.
Acknowledgements. This study was financially supported by the CAS Strategic Priority Research Program (grant no. XDA05020200) and the National Science and Technol-ogy Pillar Program (2013BAD11B00). We gratefully acknowledge the technical assistance provided by the Changshu Agroecological Experimental Station of the Chinese Academy of Sciences.
Edited by: R. Conant
Reviewed by: two anonymous referees
References
Akiyama, H., Yan, X., and Yagi, K.: Evaluation of effectiveness of enhanced-efficiency fertilizers as mitigation options for N2O and NO emissions from agricultural soils: meta-analysis, Glob. Change Biol., 16, 1837–1846, 2010.
Banger, K., Tian, H., and Lu, C.: Do nitrogen fertilizers stimulate or inhibit methane emissions from rice fields, Glob. Change Biol., 18, 3259–3267, 2012.
Chen, X., Cui, Z., Fan, M., Vitousek, P., Zhao, M., Ma, W., Wang, Z., Zhang, W., Yan, X., and Yang, J.: Producing more grain with lower environmental costs, Nature, 514, 486–489, 2014. Cheng, K., Yan, M., Nayak, D., Pan, G., Smith, P., Zheng, J., and
Zheng, J.: Carbon footprint of crop production in China: an anal-ysis of National Statistics data, J. Agr. Sci., 153, 422–431, 2014. Cui, Z., Yue, S., Wang, G., Meng, Q., Wu, L., Yang, Z., Zhang, Q., Li, S., Zhang, F., and Chen, X.: Closing the yield gap could reduce projected greenhouse gas emissions: a case study of maize production in China, Glob. Change Biol., 19, 2467–2477, 2013a. Cui, Z., Yue, S., Wang, G., Zhang, F., and Chen, X.: In-season root-zone N management for mitigating greenhouse gas emission and reactive N losses in intensive wheat production, Environ. Sci. Technol., 47, 6015–6022, 2013b.
Cui, Z., Wang, G., Yue, S., Wu, L., Zhang, W., Zhang, F., and Chen, X.: Closing the N-use efficiency gap to achieve food and environ-mental security, Environ. Sci. Technol., 48, 5780–5787, 2014. Galloway, J. N., Townsend, A. R., Erisman, J. W., Bekunda, M.,
Cai, Z., Freney, J. R., Martinelli, L. A., Seitzinger, S. P., and Sut-ton, M. A.: Transformation of the nitrogen cycle: recent trends, questions, and potential solutions, Science, 320, 889–892, 2008. Gu, B., Ge, Y., Ren, Y., Xu, B., Luo, W., Jiang, H., Gu, B., and Chang, J.: Atmospheric reactive nitrogen in China: Sources, re-cent trends, and damage costs, Environ. Sci. Technol., 46, 9420– 9427, 2012.
Huang, T., Gao, B., Christie, P., and Ju, X.: Net global warming po-tential and greenhouse gas intensity in a double-cropping cereal rotation as affected by nitrogen and straw management, Biogeo-sciences, 10, 7897–7911, doi:10.5194/bg-10-7897-2013, 2013. Huang, Y., Zou, J., Zheng, X., Wang, Y., and Xu, X.: Nitrous
ox-ide emissions as influenced by amendment of plant residues with different C : N ratios, Soil Biol. Biochem., 36, 973–981, 2004. Ju, X., Xing, G., Chen, X., Zhang, S., Zhang, L., Liu, X., Cui, Z.,
Yin, B., Christie, P., and Zhu, Z.: Reducing environmental risk by improving N management in intensive Chinese agricultural systems, P. Natl. Acad. Sci. USA, 106, 3041–3046, 2009. Lam, S. K., Chen, D., Mosier, A. R., and Roush, R.: The
po-tential for carbon sequestration in Australian agricultural soils is technically and economically limited, Sci. Rep., 3, 2179, doi:10.1038/srep02179, 2013.
Li, X., Xia, L., and Yan, X.: Application of membrane inlet mass spectrometry to directly quantify denitrification in flooded rice paddy soil, Biol. Fertil. Soils, 50, 891–900, 2014.
Liang L.: Environmental impact assessment of circular agriculture based on life cycle assessment, Methods and case studies, PhD thesis, China Agricultural University, 2009 (in Chinese with En-glish abstract).
Linquist, B., Adviento-Borbe, M., Pittelkow, C., van Kessel, C., and van Groenigen, K.: Fertilizer management practices and green-house gas emissions from rice systems: A quantitative review and analysis, Field Crop. Res., 135, 10–21, 2012.
Lu, F., Wang, X., Han, B., Ouyang, Z., Duan, X., Zheng, H., and Miao, H.: Soil carbon sequestrations by nitrogen fertilizer ap-plication, straw return and no-tillage in China’s cropland, Glob. Change Biol., 15, 281–305, 2009.
Ma, J., Ma, E., Xu, H., Yagi, K., and Cai, Z.: Wheat straw manage-ment affects CH4and N2O emissions from rice fields, Soil Biol.
Biochem., 41, 1022–1028, 2009.
Ma, Y., Kong, X., Yang, B., Zhang, X., Yan, X., Yang, J., and Xiong, Z.: Net global warming potential and greenhouse gas intensity of annual rice–wheat rotations with integrated soil-crop system management, Agric. Ecosyst. Environ., 164, 209–219, 2013. Mandal, B., Majumder, B., Adhya, T., Bandyopadhyay, P.,
Gan-gopadhyay, A., Sarkar, D., Kundu, M., Choudhury, S. G., Hazra, G., and Kundu, S.: Potential of double-cropped rice ecology to conserve organic carbon under subtropical climate, Glob. Change Biol., 14, 2139–2151, 2008.
Nayak, D., Saetnan, E., Cheng, K., Wang, W., Koslowski, F., Cheng, Y., Zhu, W. Y., Wang, J., Liu, J., and Moran, D.: Management opportunities to mitigate greenhouse gas emissions from Chinese agriculture, Agric. Ecosyst. Environ., 209, 108–124, 2015. Qin, Y., Liu, S., Guo, Y., Liu, Q., and Zou, J.: Methane and
crop-ping systems in Southeast China, Biol. Fertil. Soils, 46, 825–834, 2010.
Shan, J. and Yan, X. Y.: Effects of crop residue returning on nitrous oxide emissions in agricultural soils, Atmos. Environ., 71, 170– 175, 2013.
Shang, Q., Yang, X., Gao, C., Wu, P., Liu, J., Xu, Y., Shen, Q., Zou, J., and Guo, S.: Net annual global warming potential and green-house gas intensity in Chinese double rice-cropping systems: a 3-year field measurement in long-term fertilizer experiments, Glob. Change Biol., 17, 2196–2210, 2011.
Singh, Y., Singh, B., and Timsina, J.: Crop residue management for nutrient cycling and improving soil productivity in rice-based cropping systems in the tropics, Adv. Agron., 85, 269–407, 2005. Wang, W., Guo, L., Li, Y., Su, M., Lin, Y., De Perthuis, C., Ju, X., Lin, E., and Moran, D.: Greenhouse gas intensity of three main crops and implications for low-carbon agriculture in China, Cli-matic Change, 128, 57–70, 2014a.
Wang, W., Koslowski, F., Nayak, D. R., Smith, P., Saetnan, E., Ju, X., Guo, L., Han, G., de Perthuis, C., Lin, E., and Moran, D.: Greenhouse gas mitigation in Chinese agriculture: Distinguish-ing technical and economic potentials, Global Environ. Change, 26, 53–62, 2014b.
Woolf, D., Amonette, J. E., Street-Perrott, F. A., Lehmann, J., and Joseph, S.: Sustainable biochar to mitigate global climate change, Nat. Commun., 1, 56, doi:10.1038/ncomms1053, 2010. Xia, L., Wang, S., and Yan, X.: Effects of long-term straw
incorpo-ration on the net global warming potential and the net economic benefit in a rice-wheat cropping system in China, Agric. Ecosyst. Environ., 197, 118–127, 2014.
Xia, L., Ti, C., Li, B., Xia, Y., and Yan, X.: Greenhouse gas emis-sions and reactive nitrogen releases during the life-cycles of sta-ple food production in China and their mitigation potential, Sci. Total Environ., 556, 116–125, 2016.
Xia, Y. and Yan, X.: Life-cycle evaluation of nitrogen-use in rice-farming systems: implications for economically-optimal ni-trogen rates, Biogeosciences, 8, 3159–3168, doi:10.5194/bg-8-3159-2011, 2011.
Xia, Y. and Yan, X.: Ecologically optimal nitrogen application rates for rice cropping in the Taihu Lake region of China, Sustain. Sci., 7, 33–44, 2012.
Xie, B., Zheng, X., Zhou, Z., Gu, J., Zhu, B., Chen, X., Shi, Y., Wang, Y., Zhao, Z., and Liu, C.: Effects of nitrogen fertilizer on CH4emission from rice fields: multi-site field observations,
Plant Soil, 326, 393–401, 2010.
Xie, Z., Xu, Y., Liu, G., Liu, Q., Zhu, J., Tu, C., Amonette, J. E., Cadisch, G., Yong, J. W., and Hu, S.: Impact of biochar applica-tion on nitrogen nutriapplica-tion of rice, greenhouse-gas emissions and soil organic carbon dynamics in two paddy soils of China, Plant Soil, 370, 527–540, 2013.
Yan, X., Akiyama, H., Yagi, K., and Akimoto, H.: Global esti-mations of the inventory and mitigation potential of methane emissions from rice cultivation conducted using the 2006 Inter-governmental Panel on Climate Change Guidelines, Global Bio-geochem. Cy., 23, GB2002, doi:10.1029/2008GB003299, 2009.
Yan, X., Cai, Z., Wang, S., and Smith, P.: Direct measurement of soil organic carbon content change in the croplands of China, Glob. Change Biol., 17, 1487–1496, 2011.
Yan, X., Ti, C.,Vitousek, P., Chen, D., Leip, A., Cai, Z.,and Zhu, Z.: Fertilizer nitrogen recovery efficiencies in crop pro-duction systems of China with and without consideration of the residual effect of nitrogen, Environ. Res. Lett., 9, 095002 doi:10.1088/1748-9326/9/9/095002, 2014.
Yao, Z., Zheng, X., Dong, H., Wang, R., Mei, B., and Zhu, J.: A 3-year record of N2O and CH4emissions from a sandy loam paddy during rice seasons as affected by different nitrogen application rates, Agric. Ecosyst. Environ., 152, 1–9, 2013.
Zhang, F., Cui, Z., Chen, X., Ju, X., Shen, J., Chen, Q., Liu, X., Zhang, W., Mi, G., and Fan, M.: Integrated nutrient manage-ment for food security and environmanage-mental quality in China, Adv. Agron., 116, 1–40, 2012.
Zhang, W., Dou, Z., He, P., Ju, X., Powlson, D., Chadwick, D., Norse, D., Lu, Y., Zhang, Y., and Wu, L.: New technologies reduce greenhouse gas emissions from nitrogenous fertilizer in China, P. Natl. Acad. Sci. USA, 110, 8375–8380, 2013. Zhao, M., Tian, Y., Ma, Y., Zhang, M., Yao, Y., Xiong, Z., Yin,
B., and Zhu, Z.: Mitigating gaseous nitrogen emissions intensity from a Chinese rice cropping system through an improved man-agement practice aimed to close the yield gap, Agric. Ecosyst. Environ., 203, 36–45, 2015.
Zhao, X., Zhou, Y., Min, J., Wang, S., Shi, W., and Xing, G.: Nitro-gen runoff dominates water nitroNitro-gen pollution from rice-wheat rotation in the Taihu Lake region of China, Agric. Ecosyst. Env-iron., 156, 1–11, 2012a.
Zhao, X., Zhou, Y., Wang, S., Xing, G., Shi, W., Xu, R., and Zhu, Z.: Nitrogen balance in a highly fertilized rice-wheat double-cropping system in southern China, Soil Sci. Soc. Am. J., 76, 1068–1078, 2012b.
Zhao, X., Liu, S. L., Pu, C., Zhang, X. Q., Xue, J. F., Zhang, R., Wang, Y. Q., Lal, R., Zhang, H. L., and Chen, F.: Methane and nitrous oxide emissions under no-till farming in China: a meta-analysis, Glob. Change Biol., 22, 1372–1384, 2015a.
Zhao, X., Zhang, R., Xue, J. F., Pu, C., Zhang, X. Q., Liu, S. L., Chen, F., Lal, R., and Zhang, H. L.: Management-induced changes to soil organic carbon in China: A meta-analysis, Adv. Agron., 134, 1–49, 2015b.