Correlating stock exchange indices
under both normal and financial crisis conditions
Gabriela-Victoria ANGHELACHE The BucharestUniversity of Economic Studies
Andreea NEGRU CIOBANU The BucharestUniversity of Economic Studies
Abstract. Until the years 1980 the financial crisis were considered as being limited to the level of the capital market (individually), without bearing a systemic character. If considering the intensification of the globalization process, we attended at the increase of the degree of commercial and financial integration of the states all over the world. Thus, gradually, the local financial crisis have propagated at the level of the world financial system. The consequences of these financial crisis did not limited to the markets of the countries where they launched, but spread rapidly on the world markets – an effect known in the literature as contagion. In this article we have tried to evaluate the importance of the contagion effects on the capital markets, by utilizing certain econometric methods, from the correlation tests, to the co-integration tests. Meantime, we have tried to show that during the period of the most severe financial crisis from the Second World War up to date, the degree of correlation of the markets amplifies.
Keywords: financial crisis; capital market; contagion; correlation tests; stock exchange indices.
JEL Code: G11. REL Code: 11B.
1. General notions
But, during the years 1990 we have faced major financial crisis: the European Monetary System (1992), Mexico crisis (1994-1995), Asia (1997-1998), Russia (1998), Brazil (1999), Argentina (2001) and the most significant after the second World War – the financial crisis launched in the United States in 2007.
There are several difficult episodes which confronted the capital markets, mainly after the years 1980, to be mentioned in this respect: the European Monetary System (1992), the Tequila crisis (Mexico, 1994-1995), the Asian crisis (1997-1998), the Russian crisis (1998), the Brazil crisis (1999), the Argentina crisis (2001).
There are a series of important reasons to mention when talking about the research of the phenomenon of the international transmission of the financial shocks.
First of all, the contagion phenomenon may have significant implications for the process of the assets portfolio management, mainly as far as the international diversification of the risk is concerned.
On the other hand, the significance of researching this phenomenon is strengthen by the tendency of integrating the financial markets at the world level. The technological revolution, corroborated with the liberalization of the international financial markets have generated the significant increase of the international flows of capitals, which allowed the world-wide shocks transmission.
The last but not the least, the study of the contagion phenomenon is important in order to establish the role and efficiency of the international financial interventions under crisis circumstances.
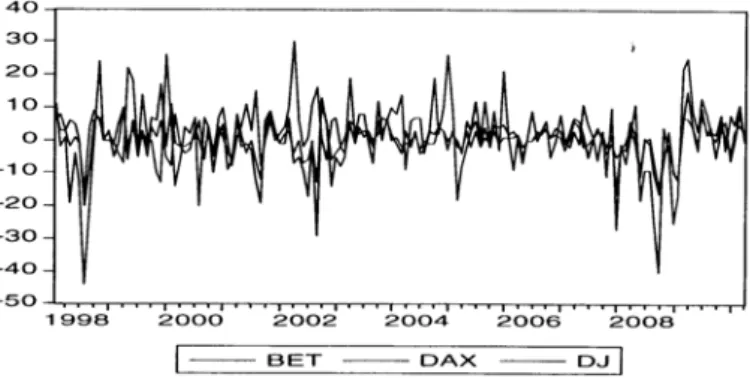
We have utilized the MetaStock data base in order to get the evolution of the Dow Jones (United States), DAX 30 (Germany) and BET (Romania) stock exchange indices. We have calculated the monthly yields of these indices during the period from 1998 up to date (148 observations). We have applied the E-Views econometric software.
The diagram of yields for the three indices allows us to observe the fact that the Romanian market – defined by BET in our analysis, shows larger amplitudes comparatively with the American or German markets.
Correlation matrix
The high degree of correlation between the Dow Jones and DAX indices over the period 1998-2010 (80%) is to be noted. The low degree of correlation between the BET and DAX indices or between the BET and Dow Jones indices is explained by the specific evolution of the BET index during the last decade (the degree of under-evaluation at the beginning of the interval, significant acceleration during the years preceding the crisis launched in 2007 and severe decline afterwards). As we shall notice further on, the degree of correlation of the BET index with the indices Dow Jones and DAX increased significantly over the crisis specific period.
The graphic representation of the indices BET-DAX and BET-DJ will indicate a lack of correlation between them, a conclusion arising also from the values indicated by the correlations matrix. As to DAX-DJ, the cloud of points is going to concentrate around a line, which indicates a high degree of correlation between the two indices.
2. The utilization of the Kolmogorov-Smirnov test
The test Kolmogorov-Smirnov is suited to the ordinal variables when the hypothesis of the normal distribution is not plausible or in the situation when the variables are numerical but the samples are small and information about the distribution is missing. In this case, the tables of incidence 2xn, namely two lines and n columns, are to be applied.
The test is based on a statistic calculated in several steps, which is compared with a theoretical statistic, which is not taken from tables but is calculated according to the formula:
2 1
2 1 1
*n n
n n K
D
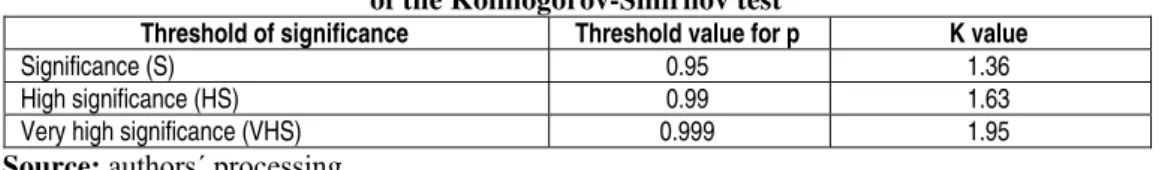
Table 1
Values of the coefficient K for calculating the theoretic threshold of the Kolmogorov-Smirnov test
Threshold of significance Threshold value for p K value
Significance (S) 0.95 1.36
High significance (HS) 0.99 1.63
Very high significance (VHS) 0.999 1.95
Source: authors΄ processing.
The following steps are to be run through:
Groups are fixed as in the case of drawing a histogram, by dividing into equal segments the difference between the minimum and the maximum values between the two series of cumulated data;
Then, the relative frequencies are calculated for each and every class out of the two series of data;
The relative frequencies cumulated for the two series of data are calculated;
The differences between the cumulated relative frequencies of the two series are calculated, separately for each class;
The largest difference out of those calculated as per the previous point is chosen.
This is the test statistic.
Then there is the theoretic statistic of the test to be calculated, that is the equivalent of the threshold value which is taken over from tables in the case of the other tests. This statistic is Dt above.
If the test statistic is higher as against the theoretic one, the difference is significant; otherwise it is not significant. The following step of the analysis consists of the application of the Kolmogorov-Smirnov (non - parametric). The results shown in the diagram show a distribution close (similar) to the yields consigned by the indices Dow Jones, DAX 30 and BET over the analyzed period. If the distributions of the series on the axis of abscise and ordinates coincide, the graph should have a linear trend. We state out that the three cases are emphasizing the fact that BET, DAX and DJ follow the normal distribution.
is a platikurtic one and has thinner tails than the normal distribution. The graphic representation of the three indices leads to the conclusion that they are platikurtics.
Among the notable differences we have to mention the different amplitude of the evolution of these stock exchange indices. Thus, the saying "... When America sneezes, Europe catches a cold and the rest of the world dies of pneumonia..” gets a confirmation. It can be observed that a variation of the Dow Jones index implies a larger amplitude of the German DAX 30 index and a still higher amplitude of the BET index (when the Dow Jones index decreased by 16%, the DAX 30 index lost 30%, while the BET index consigned a decline of over 40%). In order to identify the relation existing between the three stock exchange indices we shall apply the Granger causality test, as well as the Johansen test of co-integration.
3. The utilization of the Johansen test of co-integration
The discovery that un-numbered time series of the macroeconomic variable type may have a unit root overthrown the theory of the non-stationary time series. Engle and Granger (1987) have shown that a linear combination of two or more non-stationary time series may be a stationary series. If indeed this linear combination exists, it is said that the non-stationary component series are co-integrated. The stationary linear combination is called the co-integration equation and is interpreted as a relation of equilibrium on long-term basis between the variables.
The purpose of the co-integration tests is to establish whether a group of non-stationary series is co-integrated or not. Eviews assumes co-integration tests based on autoregressive vectors (VAR), starting from the methodology developed by Johansen (1991, 1995a). Considering an autoregressive vector of order p:
Yt = Ai yt-i + ... + Ap yt-p + B xt + εt, where yt is the vector of dimension k of the non-stationary variables I(1), xt is the vector of dimension d of the exogenous variables and εt is the innovative vector.
The equation can be re-written as follows:
The theory alleges that is the coefficients matrix Π has the rank r < k, then there are the matrices α and β of dimension k x r, each of the rank r, so that Π = α β ' and β 'yt is I(0) – integrate of order 0, r is the number of co-integration relations (rank of co-integration) and each column of β is the co-integration vector. The elements of the vector α are known as adjustment parameters.
The Johansen model assumes the estimate for the matrix Π starting from an auto-regressive vector, without restricted auto-regressive vector and testing whether the restrictions required by the reduction of the matrix Π rank can be rejected.
The first part of the outcomes is correlated with the number of the co-integration relations. The technique offers two statistics: Trace Statistic and Max-Eigen value. The conclusions are shown at the bottom of each table, so that each test indicates the fact that there are three co-integration relations between the indices.
One of the conclusions of the test is that the three stock exchange indices are co-integrated through three co-integration equations, a stationary series resulting.
4. The utilization of the Granger test of causality
The correlations are not necessarily assuming relations of causality as well, as there is a multitude of correlations meaningless such as, for instance, those between the wages in the education system and the alcohol consumption. The Granger approach (1969) in connection with this issue of the causality relation x - y consists of establishing how much from the submitted values of y can be explained by the past values of y and, then, whether by adding belated values (with different lags) of x, the connection can be improved. It is stated that y is caused Granger by x if x helps to estimate y or, in other words, whether those coefficients of the belated values of x are significant from statistical point of view. To keep in mind the fact that the statement „y Granger caused by de x" does not assume as well that y is the effect or the result of x. Meantime, the Granger causality test is acting in double sense, meaning that y is Granger caused by x and x is Granger caused by y.
The starting regressions are the following: yt = α0 + αlyt-l + ... + αiyt-i + β1xt-1 + ... + βixt-i + εt
xt = α0 + αlxt-1 + ... + αixt-i + βlyt-1 + ... + βiyt-i + ut, for all the pairs of the analyzed variables. For F-calculated the Wald statistic having a null hypothesis is used:
The null hypothesis is that y is not Granger caused by x, for the first regression and x is not Granger caused by y, for the second regression.
The outcomes of the test application are shown in the table bellow:
As to the causality relation between DAX and BET, the null hypotheses will be accepted, since the errors assumed by the rejection of the null hypothesis are very large (77%, respectively 34%). Therefore, BET is not Granger caused by DAX, neither is DAX a Granger caused by BET.
The causality between DJ and BET goes to a single direction only, according to the test outcomes, namely that the American market is the cause for the Romanian market. The error implied by the rejection of the non-causality between DJ and BET is of 11% and, thus, accepting a level of confidence counting for 89%, it can be concluded that BET is Granger caused by DJ, but not the vice-versa.
In the case of DJ and DAX, the null hypotheses cannot be rejected hence there are no relations of causality between the two indices, according to this test.
The correlation matrix set up by calculations is submitted bellow:
To observe that during the period of the economic and financial crisis the degree of correlation between the markets increased significantly. The evolution of the BET index became more closely correlated with the evolution of the Dow Jones and DAX 30 indices within that period.
Out of the graphic presentation it results that the outcomes of the correlation matrix are concentrated around a line.
By applying the Kolmogorov-Smirnov test we state out a close (similar) distribution of the yields consigned by the Dow Jones, DAX 30 and BET indices over the analyzed period.
If the distributions of the series on the axis abscise and ordinate coincide, the graph will emphasize a linear trend. It is clearly noticeable that the three graphs indicate the fact that BET, DAX and DJ follow the normal platikurtic distribution.
As well for the new time horizon considered, among the notable differences we take into account the different amplitude of the evolution of these stock exchange indices. The variation of the Dow Jones index generates the same amplitude of the German DAX 30 index and a still higher amplitude for the BET index (when the index Dow Jones dropped by 16%, the index DAX 30 lost 16%, while the index BET recorded a decline of over 40%).
The Granger test of causality, submitted above, suggests that DAX and DJ are caused by BET. Meantime, there are relations of causality between DJ and DAX as well, namely the German market is caused by the American market.
To note the fact that the relations of causality are more pronounced under conditions of crisis on the considered markets, so that the three stock exchange indices appear in the relations of causality of Granger type, either in one sense, or another (according to the outcomes from the outputs, the causality is not mutual in the present case).
References
Anghelache, G.V. (2004). The capital market. Features. Developments. Transition, Editura Economică, București
Germain, R. (1997). The International Organization of Credit, Cambridge University Press Lintner, J. (1965). „The valuation of risk assets and the selection of risky investments in stock
portofolios and capital budgets”, Review of Economics and Statistics, 47, pp. 13-27 Markowitz, H.M. (1952). „Portofolio Selection”, The Journal of Finance, 7, pp. 77-91.
Mossin, J. (1966). „Equilibrium in a Capital Asset Market”, Econometrica, Vol. 34, No. 4, pp. 768-783
Sharpe, W. (1964). „Capital asset prices: A theory of market equilibrium under conditions of risk”, Journal of Finance, 19, pp. 425-442
***World Bank (2002). Contagion of Financial Crises, february