E
VALUATIONO
FC
ONTAGIONO
RI
NTERDEPENDENCEI
NT
HEF
INANCIALC
RISESO
FA
SIAA
NDL
ATINA
MERICA,
C
ONSIDERINGT
HEM
ACROECONOMICF
UNDAMENTALSP
EDROL.
V
ALLSP
EREIRAJaneiro
de 2009
T
T
e
e
x
x
t
t
o
o
s
s
p
p
a
a
r
r
a
a
D
D
i
i
s
s
c
c
u
u
s
s
s
s
ã
ã
o
o
TEXTO PARA DISCUSSÃO 177 • JANEIRO DE 2009 • 1
Os artigos dos Textos para Discussão da Escola de Economia de São Paulo da Fundação Getulio Vargas são de inteira responsabilidade dos autores e não refletem necessariamente a opinião da
FGV-EESP. É permitida a reprodução total ou parcial dos artigos, desde que creditada a fonte.
Escola de Economia de São Paulo da Fundação Getulio Vargas FGV-EESP
EVALUATION OF CONTAGION OR INTERDEPENDENCE IN THE FINANCIAL CRISES OF ASIA AND LATIN AMERICA, CONSIDERING THE
MACROECONOMIC FUNDAMENTALS1. Emerson Fernandes Marçal
Universidade Presbiteriana Mackenzie (UPM) e-mail efmarç[email protected]
Pedro L. Valls Pereira2 EESP-FGV e-mail [email protected]
Diógenes Manoel Leiva Martin Universidade Presbiteriana Mackenzie (UPM)
e-mail [email protected]
Wilson Toshiro Nakamura
Universidade Presbiteriana Mackenzie (UPM) e-mail [email protected]
Abstract:
This article investigates the existence of contagion between countries on the basis of an analysis of returns for stock indices over the period 1994-2003. The economic methodology used is that of multivariate GARCH family volatility models, particularly the DCC models in the form proposed by Engle and Sheppard (2001). The returns were duly corrected for a series of country-specific fundamentals. The relevance of this procedure is highlighted in the literature by the work of Pesaran and Pick (2003). The results obtained in this paper provide evidence favourable to the hypothesis of regional contagion in both Latin America and Asia. As a rule, contagion spread from the Asian crisis to Latin America but not in the opposite direction.
Key-Words: Contagion, Interdependence, Financial Crisis JEL CODE: C10; C123; G10 e G15.
1 The second author would like to acknowledge the partial support from CNPq and Tematic Project
CNPq-FAPESP n0 03/10105-2.
2 Correspondent author: EESP-FGV, Rua Itapeva 474 r.1202, 01332-000 São Paulo, SP, BRAZIL. Phone:
Table of Contents
1 Introduction and objectives:...4
2 Theoretical Benchmark:...4
2.1 Interdependence (Spillover and Monsoon) and Contagion: ...6
2.2 Vectors of Contagion: ...8
3 Empirical Benchmark for Equity Markets:...12
4 Econometric Methodology: The Importance of Fundamentals in Modelling Contagion: ...14
5 Multivariate Models of Volatility and Contagion and Description of the Database: 16 6 Description of Results: ...18
6.1 Do the fundamentals add explanatory power to the returns?...18
6.2 Modelling the Volatility of Returns:...19
6.3 Did Contagion Genuinely Occur? ...19
7 Conclusions:...23
List of Tables:
1
Introduction and objectives:
This article shall concentrate on determining the degree to which it is possible to state that contagion arose from the financial events which occurred from the mid-1990s onwards. A series of simultaneous crises occurred, and given the synchronicity and intensity of the same, we may conjecture the existence of a breakdown in the traditional pattern of propagation of events. The crises hit a wide range of countries with such severity and simultaneity that the suggestion of a more systemic pattern to these crises is
a hypothesis that arises almost immediately.3
A brief historical summary shows that over a decade, some eight major events with significant repercussions on markets may be listed: a) the devaluation of the Mexican Peso in December 1994; b) the devaluation of the Thai Baht in July 1997; c) the collapse of Russia in August 1998; d) the recapitalisation of LTCM in September 1998; e) the collapse of the Hong Kong stock market in October 1998; f) the devaluation of the Brazilian Real in January 1999; g) the collapse of the Argentine currency board in December 2001 and h) the pre-electoral panic in Brazil in the second half of 2002.
The precise definition of contagion is an open question in the literature and a consensus remains to be reached. In this way, not only there is no consensus on the definition of contagion, but also there is no correct methodology for testing for the existence of contagion. This article is organised in the following way. In Section 2, we present the definitions of contagion present in the literature. In Section 3 we present a review of empirical studies. In Section 4, we present the econometric procedures. In Section 5, we describe the database. In Section 6, the principal results obtained are presented and discussed. Finally, we present our conclusions.
2
Theoretical Benchmark:
The complexity of crises and their consequences result from the multiplicity of causes and the interaction of the various mechanisms of propagation in time and in space. This is aggravated by the difference between countries due to the degree of institutional, economic and political development and the absence of mechanisms for international economic coordination. In this sense, a study of the crisis should begin by concentrating on a specific crisis and its consequences. This does not imply the impossibility of creating a theory on crises and contagion, so much as the existence of a multiplicity of models for explaining such phenomena.
It may be stated that the literature on contagion begins with the models of currency crises. In generic terms, these are split into three generations of models. The first model by Krugman (1979) explains a currency crisis in the context of a fixed exchange rate regime. The crisis occurs in the balance of payments due to a speculative attack against the fixed exchange rate with the exhaustion of reserves, thus altering the
3 This work does not aim to compare the gains from financial globalisation with the losses arising
currency regime. The rationality of agents and the macroeconomic fundamentals are relevant characteristics of this model, but the possibility of contagion does not exist. The second model by Flood and Garber (1984) and Obstfeld (1984) and Obstfeld and Rogoff (1995), considers the existence of multiple equilibria. The belief of economic
agents directed by irrelevant variables (sunspots), which are transformed into
self-fulfilling expectations during the crisis, implies multiple equilibria. The rationality of agents and the macroeconomic fundamentals (the inconsistency between short- and long-term government policies) continue to be relevant characteristics of this model, although the possibility of contagion exists. The third model by Krugman (1998) explains the exchange rate crisis in terms of the existence of speculative bubbles and moral risk. The first two generations of models are inadequate for explaining the crises which began during the 1990s.
Crises and contagion are not exclusively characteristic of emerging countries. As
an example, we may cite the crisis of the Exchange Rate Mechanism in 1992, conceived
as a currency stabilisation mechanism for a number of European countries, when countries such as the UK, Portugal and Spain among others suffered speculative attacks. With the liberation of credit in 1985 and 1986, Norway suffered an asset bubble process. At the end of the 1980s, Japan also implemented a financial liberalisation process, with an expansion of credit and a bubble in real assets.
Allen and Gale (2004a) define crises as a sharp fall in asset prices which affects the solvency of banks and their ability to meet their commitments to their clients. Hong
and Stein (1999), referring to the equity market, define crises (crash) as a strongly
negative change in share prices, unrelated to public information on recent events, implying contagion, i.e. it affects not only one asset but a set of assets. The 1990s were replete with financial crises which especially affected emerging countries, such as: the
Mexico crisis (Tequila crises) in 1994/95, the Asian crisis (Asia flu) in 1997 and the
Russian crisis (Russian virus) in 1998. Less severe for other emerging markets, we may
cite the devaluation of the Brazilian currency in 1999, and the abandoning of the parity
of the Argentine Peso against the U.S. dollar in 2001/02. Financial crises may be
considered to be banking crises, currency crises (balance of payments), twin crises (bank and currency crisis) and bubbles. In principle, crises originating from an increase
in international interest rates or the reduction in international commodity prices may be excluded from such events. Allen and Gale (2004b) defined financial vulnerability as being disproportionate effects which result in the insolvency of agents and the volatility of asset prices due to small aggregate shocks in demand for liquidity. Kaminsky and Reinhart (1999) analysed crises in 20 countries, including 15 emerging ones and identified financial liberalisation and credit expansion as their common precursors. The evidence from the last decade seems to indicate that financial systems that are more market-oriented are more susceptible to periodic crises following commercial liberalisation and especially after financial globalisation.
Schmukler, Zoido and Halac (2004) point out that the benefits for the receiving country are a) access to new sources of funds, b) greater supply of these, c) an improvement in the financial infrastructure, mitigating information asymmetry and reducing problems of adverse selection and moral risk, d) an increase in financial efficiency due to the competition of local banks with international ones. Bekaert, Harvey and Lundlad (2003) estimated that the liberalisation of capital markets raised
real annual per capita income by around 1% for five years. At the same time, the
intensification of commercial and financial relations also carries risk sharing with it. Allen and Gale (2004b) demonstrated theoretically that small shocks which impact the demand for liquidity may increase price volatility, bank insolvency or both. Bekaert, Harvey and Lundlad (2003) showed empirically that financial liberalisation reduces the volatility of growth in consumption but increases the volatility of GDP growth in emerging countries. Prasad, Rogoff, Wei and Kose (2003) mention that it is difficult to establish a strong causal relationship between financial integration and growth, since there is still no robust and clear empirical proof that is quantitatively significant. At the same time, for the same authors there is a “threshold” effect, for which the benefits are greater in emerging countries with more consistent macroeconomic policies, which, in a stable institutional environment, improve governance conditions, attracting less volatile capital and reducing vulnerability to external crises. The specificity of the country, in macroeconomic and institutional terms, appears to be the essential condition for benefits to occur, with Chile forming an example of this (Edwards (2005)).
As a consequence of the crisis, there was a reduction in economic activity in one or more countries. As a consequence of the shocks, there was: a reduction in asset prices; a reduction in liquidity, an increase in financing and fund raising costs in the international market or even a lack of access to the international capital market. With the eruption of the crises, the imperfections of the international financial system, the fragilities and vulnerability of the countries involved becomes evident.
It is thus in this context of financial globalisation that from 1997 onwards, the concept of contagion appears. Allen and Gale (2007) affirms that the classical theory of risk considers this to be exogenous, i.e. associated with conditions of nature, although what is observed is that the risks associated with globalisation is endogenous, i.e. they result from its own dynamics. There is no consensus on the concept and measure of contagion, but it may initially be stated that the term expresses the international transmission of financial crises. While this study focuses on the 1990s, crisis episodes are not a recent phenomenon. Bordo and Murshid (2000) and Kaminsky, Reinhart and Végh (2002) describe financial crises which began in 1825. Kindelberger (1989) presents a chronology of crises starting in the 17th century.
2.1 Interdependence (Spillover and Monsoon) and Contagion:
Masson (1998) analysing the Mexican and Asian crises, distinguishes three
country, without any relationship to the macroeconomic fundamentals of the latter, perhaps as a function of the change in market sentiment or in the evaluation of existing information. The first characteristic was termed the monsoon effect by Masson and Mussa (1995). The second characteristic was termed spillover by Calvo and Reinhart (1996), while the third was termed pure contagion by Sachs, Tornell and Velasco (1996), for which changes in the expectations of economic agents are not related to the change in fundamentals of the country in question. Masson (1999) characterised this as “market sentiment”, for which the expression in the economic literature is “sunspots”, i.e. irrelevant variables which direct the expectations of agents. In this category, the explanation of crises is related to the existence of multiple equilibria and self-realising expectations. As such, the first and second characteristics may be classified as being related to fundamentals and the third as unrelated to macroeconomic fundamentals. The first two, monsoon and spill-over, are termed interdependence (Forbes and Rigobon (2002) and Pesaran and Pick (2003))
Goldstein and Hawkins (1998) recall the fact that two important rating agencies did not succeed in monitoring the latent risks in the Asian crisis. At the same time, on analysing 18 measures of fundamentals considered important in the literature, the two countries indicated as the most vulnerable were indeed the most severely affected, namely Thailand and Indonesia.
Dornbush, Park and Claessens (2000) adopt the definition of contagion as being the dissemination of market disturbances, most of the time with negative consequences, from one emerging market to another, observed through co-movements in exchange rates, share prices, sovereign risk spreads and capital flows.
Pritsker (2001) defined contagion as the occurrence of a shock in one or more markets, countries or institutions that spread to other markets, countries or institutions. This definition of contagion is equivalent to the definition of spillover. The author distinguished between rational and irrational contagion. In the latter case, the shock is transmitted between countries as the result of market participants who follow portfolio
strategies which ex ante are not rational, i.e. agents do not maximise utility, given the
environment and behaviour of other agents. The existence of multiple equilibria differs from irrational contagion, in so far as in the former, the agents act rationally in each equilibrium situation, whether good or bad.
Pericoli and Sbracia (2001) list five definitions of contagion, namely: 1) when there is an increased probability of crisis in a country, given the existence of a crisis in another country; 2) when volatility is propagated as a proxy for uncertainty from the crisis of a country to the financial markets of other countries; 3) when there is an increase in co-movements in prices and quantities between markets, given the crises in one or more markets; 4) when there is a change in the transmission mechanism or channel for contagion, with the intensification of the same after the crisis and 5) when there are co-movements that are not explained by the fundamentals. According to the authors this implies two major theoretical groups, discriminated by whether or not there is a structural breakdown in the relationship between markets given the crisis. At the same time, from an empirical point of view, the determination of this breakdown remains highly controversial.
economic fundamentals of more than one country; 2) shocks in specific countries which affect the fundamentals of other countries and 3) shocks which are not explained by fundamentals and which they termed pure contagion. In the last case of pure contagion, the reasons may be: a) multiple equilibria as a function of the alteration in the expectations of investors; b) liquidity shocks in which the agents divest their assets in countries as a function of the crisis in another country; c) investor psychology in which investors, given a crisis in a country, associate it with previous crises, with a correlation of memories and not of fundamentals; d) results of economic policies which are intertemporally inconsistent. In all of these situations, there will be co-movements of share prices of the countries affected by the propagation of crises. They defined contagion as the increase in the probability of a crisis in a country, given that there has been a crisis in another country, discounting the effects of interdependence or fundamentals, i.e. the contagion refers to the residual character of the crisis which befalls countries in an unpredictable way. These authors analysed the impact of the Asian and Mexican crises and the 1987 crash of the New York Stock Exchange on the equity markets of emerging and developed countries and concluded that most of the changes were due to interdependence and that contagion increased the co-movement of prices during the propagation of crises.
There are important practical implications in the distinction between contagion and interdependence, as was highlighted by Pesaran and Pick (2003). If there is a high degree of correlation between markets after negative shocks, portfolio diversification may be of little effect. If there is a shift from a good equilibrium to a bad equilibrium as a function of market sentiment, the existence of an international lender of the last resort may reverse the equilibrium condition. At the same time, if there is a spillover effect which is aggravated by poor economic fundamentals, international aid mechanisms will be inadequate and will require conditionalities of countries.
2.2 Vectors of Contagion:
The literature on the theoretical causes of financial crises, especially for equities, may be divided into three categories: 1) the herd behaviour of the investor; 2) endogenous liquidity shocks and 3) multiple equilibria. Calvo and Mendoza (1998) describe two contagion mechanisms which provide incentives for herd behaviour: 1) if the relative weighting of shares in companies of a given country is relatively small in relation to the overall portfolio and the relative loss resulting from a shock is less than the cost of obtaining information, 2) if the marginal cost of being “led” by the market is less than the cost of reversing the process. Valdés (1997) and Goldfajn and Valdés (1997) consider that the reduction in liquidity of a country may cause the investor to divest his positions in other countries in order to meet his commitments (e.g. margin calls). Kaminsky and Reinhart (2000) highlight the importance of the existence of a major creditor, i.e. a bank or investors with significant amounts invested in a country, not only in terms of its investment or loan portfolio, but which is also relevant in terms of the local market.
Calvo and Reinhart (1996), evaluating resource flows to Latin America during the Mexican crisis, listed six sources of contagion: 1) when two neighbouring countries have a highly integrated capital markets; 2) when there are relatively significant foreign trade flows between countries; 3) when major institutional investors are present who divest their positions in emerging markets, with narrow and illiquid markets, causing a sharp and generalised fall in the prices of these assets; 4) when foreign investors transfer their resources from emerging markets to more accessible or reliable markets; 5) when technological factors related to local industry affect a country’s growth or when there is political instability; 6) when there is a ‘bandwagon’ effect, i.e. when the change in expectations or sentiment of agents, even if unrelated to fundamentals, causes the grouping or convergence of self-realising expectations.
Analysing the Asian crisis, Radelet and Sachs (1998) identify five types of financial crisis: 1) A crisis induced by macroeconomic policies (currency depreciation, loss of international reserves, collapse of a fixed exchange rate), taking Krugman (1979) model as an example; 2) financial panics, implying the existence of multiple equilibria, taking as example the model of Diamond and Dybvig (1983); 3) the collapse of speculative bubbles, taking as example, the model of Blanchard and Watson (1982); 4) moral risk, implying the collapse of financial institutions with an implicit or explicit guarantee, taking as an example the model of Akerlof, Romer and Looting (1994); 5) a disordered race to borrow in situations of insolvency or illiquidity, taking as example the model of Sachs, Tornell and Velasco (1996).
Analysing the Mexican and Asian crises, Lovell, Neu and Tong (1998) listed the coincidence of shocks affecting the financial conditions of a country, a common shock affecting fundamentals between countries and financial contagion that would be the transmission of international financial crises as possible explanations for the crises. The authors identify 4 models of contagion: 1) the economic linkage model, in which a financial crisis in one country provokes a series of crises in other countries, altering their economic fundamentals, e.g. Gerlach and Smets (1995); 2) the Heightened Awareness Model, in which due to lack of information, investors concentrate their investments in a small number of countries and when the crises occur in a given country, they divest their positions in other countries with possible similar problems and poor economic fundamentals, e.g. Calvo and Reinhart (1996) 3) The Portfolio Adjustment Model, in which leveraged investors honour their commitments in a given country by divest their investments in other countries, causing a financial crisis in these latter, e.g. Garber and Lall (1996) and 4) The Herd Behaviour Model, in which investors divest their investments in one or more countries that do not necessarily have poor fundamentals, due to the similar behaviour of other examples, e.g. Wolf (1997).
as a function of the problem in Thailand, investors re-evaluated their investments in similar countries and reallocated their resources or where possible, anticipated loan maturities.
Perry and Lederman (1998) analysed the impacts of the Asian crisis on Latin America, separating the causes and the symptoms of Latin American financial vulnerability and its consequences. They defined financial vulnerability as being a high probability of a successful speculative attack on national currencies. Different causes may imply the same kind of symptom. As causes, they listed the following: 1) rigid currency regimes, 2) moral risk in the banking system and among large corporations causing abundant credit and bubbles in the prices of real and financial assets, resulting in insolvency, after the bursting of the bubble; 3) a lack of transparency of transactions combined with a defective or non-existent governance structure, especially in large family-owned companies; 4) a lack of supervision and regulation of banks and companies, resulted in a low level of legal and market discipline; 5) financial and capital account liberalisation which fed credit expansion, asset bubbles and currency exposure. The symptoms of these causes which caused the insolvency of financial intermediaries, the liquidity crisis and the fall in reserves were: 1) vulnerability of the external sector (appreciation of the real exchange rate, a fall in export growth and high and growing current account deficits); 2) the risks of debt rollover (heavy short-term maturities of long-term debt relative to reserves); 3) uninsured currency risk of large international borrowers (a potential devaluation would have a severe impact on foreign currency borrowers, such as banks and large importers; 4) vulnerability of banks to increases in interest rates with a reduction in economic activity on account of their debts.
Perry and Lederman (1998) also considered that contagion leads to financial vulnerability, albeit that the same does not occur with spillover. The authors cited two types of effects of contagion of the Asian crisis in particular for Latin America; financial and real (non-financial). The financial effects consist of: 1) information shocks, where investors, due to the lack of information, evaluate the conditions of one country on the basis of a crisis in another similar country, with two consequences: a) flight to safety and b) a demonstration effect; 2) the effect of institutional investors liquidating investments in countries which have not yet suffered the effects of the crisis. The non-financial or real effects consist of: 1) a contraction in economic activity and 2) export substitution, which compromise the competitiveness of countries.
Frankel and Schmukler (1998) and Kaminsky, Lyons and Reinhart (2001) found evidence that U.S. mutual funds played a significant role in spreading the crisis in Latin America, due to the sake of their positions in a search for greater liquidity and security. Kaminsky, Lyons and Reinhart (2001) examined the relevant role of the Japanese commercial banks in propagating the Asian crisis throughout the countries of the region. Berg and Patillo (1998), testing predictive models for the Asian crisis on the basis of a set of fundamentals as explanatory variables, found evidence that only one of the three models analysed was capable of predicting the currency crisis in a modest way.
Kaminsky and Reinhart (2000) analysed contagion on the basis of fundamentals in twenty countries during the period 1970 to 1998, emphasising the role of commercial and financial relations between countries. The evidence suggests that contagion: 1) has historically been more regional than global; 2) is highly non-linear, i.e. the probability of a crisis in a given country increases if there is a group of “infected” countries; 3) there is a difficulty in distinguishing between channels of transmission involving commercial or financial relationships; 4) in some cases, financial transmission channels are more significant than commercial ones, as was the case, for example, of Argentina during the Mexican crisis.
Frankel and Schmukler (1998) analysed the spillover of the Mexican crisis in
relation to Latin America and Asia, in relation to investment funds and concluded that: 1) fund movements impacted the value of other investment funds in local Latin American markets and 3) countries with “poor” fundamentals were the worst affected by movements in investment funds.
Dornbush, Park and Claessens (2000) reviewed the literature on contagion, highlighting a number of points that until then had been little explored. They list as the fundamental causes of contagion and transmission vectors: 1) those related to fundamentals, such as: a) common shocks, e.g. changes in U.S. interest rates which determined capital flows to Latin America (Calvo and Reinhart (1996)); b) trade relations and competitive devaluation, e.g. Corsetti, Pesenti and Roubini (1998) and c) international financial relationships; 2) those unrelated to fundamentals, referring exclusively to the behaviour of investors, in function of a) restrictions on liquidity and incentive problems, b) asymmetric coordination and information problems, c) the existence of multiple equilibria and d) a change in the rules of the game.
Kaminsky, Reinhart and Végh (2002) used the term “holy trinity of crisis” to refer to three common characteristics of contagion, described as a rapid and violent
shock, as opposed to spillover or death by a thousand cuts.: 1) a sudden stop, 2) the
surprise effect and 3) the presence of a large provider of capital. Analysing data for 163 countries for the period 1970-2000, Edwards (2005) found no evidence to suggest that countries with high capital mobility had a higher incidence of crises than countries with lower capital mobility. At the same time, given the crisis, countries with higher capital mobility had higher costs in terms of a reduction in product.
markets (fixed income and currency) which is larger than that of the latter on equity markets.
3
Empirical Benchmark for Equity Markets:
Despite relatively extensive empirical literature on contagion in equity markets,
the empirical results are divergent.
Baig and Goldfajn (1998) considered daily exchange rate, interest rate, spreads
on external debt securities and stock indices for Thailand, Malaysia, Indonesia, South Korea and the Philippines. In relation to the original correlation coefficient for the spreads, interest and exchange rates, they noted the presence of contagion. With regard to the correlation coefficient obtained by regression with controls for fundamentals (stock indices and exchange rates) and dummies for good and bad news, with the above series as dependent variables, the authors noted that there was contagion between equity and currency markets.
Baig and Goldfajn (2000) examined whether there was contagion during the
Russian crisis with regard to Brazil through spreads on Brady bonds and stock indices, using Forbes and Rigobon (2002) adjusted correlation coefficient. The authors concluded that contagion occurred and that the mechanism of propagation was the debt securities market. They also noted the sudden halt in capital flows to Brazil and to Russia.
Forbes and Rigobon (2002) analysed the impact of the Asian and Mexican crises
and the 1987 crash of the New York stock exchange on the equity markets of emerging
and developed countries, and concluded, with adjusted correlation tests, that most of the changes (16 out of 17 countries) were due to interdependence. The high degree of co-movements of markets during the crises was due to the intensification of the relationship between markets since the unadjusted correlation would be a function of the variance which increased during the crises.
Corsetti, Pericoli and Sbracia (2005) used a factor model to estimate equity
returns during the Asian crisis, checking the relationship between returns from the Hong Kong stock exchange, and the stock markets for 10 emerging countries and the G7 countries. Contagion is a structural breakdown in the mechanisms for transmission of shocks, considering a) the correlation between markets due to common factors and b) the variance of returns in the country in which the crisis originated. According to the authors, the works which concluded in favour of evidence of interdependence made unrealistic and arbitrary assumptions on the variances of countries during the crises. The evidence suggested that in at least 5 of the 17 countries, there was evidence of contagion, so that there would be both contagion and interdependence.
Chiang, Jeon and Li (2007) applied the dynamic correlation model (DCC) to 9
strongly related to the ratings by the agencies which observed the sovereign credit risk of the countries in question.
Rigobon (2003) applied the dynamic correlation model (DCC) to the countries
involved in the Mexican, Asian and Russian crises. For the Mexican crisis, the mechanism for the transmission of crises remained relatively constant, providing evidence of interdependence. At the same time, for the Russian crisis, and especially for the Asian crisis, there was evidence of a structural breakdown. Capital flows between countries tends to be highly volatile during crises, which may imply contagion.
Caporale, Sipolini and Spagnolo (2003), in line with Rigobon (2003), after
adjusting the latter’s model (2001) for heteroscedasticity, endogeneity and omitted variables, concluded that there was evidence of contagion during the Asian crisis. At the same time, Billio, Lo Duca and Pellizzon (2003), analysing the Asian crisis and applying the determinant test for the change in Rigobon (2003) covariance matrix, concluded that this procedure is not adequate for detecting contagion, since a) there is a rejection of stability when there is a change in the parameter or a violation of the hypothesis of heteroscedasticity and b) there is a loss of power of the test when several markets or countries are analysed.
Longin and Solnik (2001) used the theory of extreme values to model the
multivariate distribution of tails of distributions of returns for the period 1958-1996 using monthly data. They observed that negatively correlated returns above a certain level did not converge to zero with an increase in this level and that the hypothesis of multivariate normality of the same was not verified. The contrary occurred with positive correlations, i.e. these tended to zero with an increase in the level and had a normal multivariate distribution. This implied that correlations increased during crises but not during periods of tranquillity.
Bae, Karolyi and Stulz (2003) used the theory of extreme values to analyse
contagion, since the phenomenon is non-linear. The authors considered the pre- and post-crisis periods for Mexico and Asia, concluding that: 1) contagion was more serious in Latin America than in Asia; 3) contagion from Latin America to other regions was more important than that originating in Asia; 3) the United States was not contaminated by the Asian crisis and 4) contagion is predictable, subject to prior information.
Dungey, Fry and Martin (2005) examined the empirical literature on contagion,
Boyer, Kumagai and Yuan (2005) analysed the impact of the Mexican, Asian and Russian crises on the equity markets of developed and emerging countries. The evidence suggests that the propagation of the crisis was due to the presence of international investors in the equity markets of different countries. Considering two groups of shares, those owned by international investors and those not owned by them, and controlling for the effect of exchange rates, the authors observed contagion, i.e., when international investors divested their positions, they contaminated the equity market as a whole. In developing countries, this was aggravated by the repositioning of local investors as a function of their losses, and in developed countries, this implied a rebalancing of portfolios.
Within Brazil, Lopes and Moura (2001) identified speculation and external
instability as the principal factors in speculative attacks on the Brazilian currency between 1994 and 1999. Castro and Leite (2003) estimated the probabilities of currency attacks during the same period and identified the elements of the first generation currency crisis model as relevant (fiscal situation of the public sector), albeit without discarding the elements of the second generation model. Prates (2005) drew up a critical review of conventional models of financial crises of the 1990s. In his doctoral thesis, Saraiva Leon (2002) applied the model of Cole and Kehoe (1996) to analyse speculative attacks on the Brazilian currency. Guidugli (2005) undertook a multivariate analysis, observing contagion during the speculative attack episode and currency crisis of 1998-99 involving Brazil, Russia and Argentina, in relation to equities, interest rates and the risk spreads of international securities.
4 Econometric Methodology: The Importance of Fundamentals in Modelling Contagion:
Dungey, Fry, Gonzalez-Hermozillio and Martin (2004) start from an initial model in the absence of contagion for the returns of the assets under analysis:
eq. 1: t t t t t t u w y u w y 2 ' 2 ' 2 2 1 ' 1 ' 1 1 δ λ δ λ + = + =
in which wit represents a term common to the two assets; uit are idiosyncratic shocks.
The terms wt and uit are independent, as are uit and ujt for any i≠j.
It may be demonstrated that:
eq. 2: 2 2 2 2 2 2 2 1 2 1 ) ( ) ( it i w i it w t t y E y y E σ δ σ λ σ λ λ + = =
Given that country 1 is in crisis and that there is contagion, this alters eq. 1 in the following way: eq. 3: t t t t t t t u u w y u w y 1 2 ' 2 ' 2 2 1 ' 1 ' 1 1 γ δ λ δ λ + + = + =
eq. 4: 2 1 2 2 2 2 2 2 2 2 2 2 1 2 1 2 2 1 2 1 2 1 1 2 2 1 2 1 ) ( ) ( ) ( t t w t t w t t w t t y E y E y y E γσ σ δ σ λ σ δ σ λ γσ λ σ λ λ + + = + = + =
In this way, in the event that the analyst has the information about crisis times, it is possible to test the hypothesis of contagion, comparing the structure of correlations between times. “In particular, contagion has the effect of causing a structural shift during the crisis period in the conditional covariance (…) and in conditional variance (…).” Dungey, Fry, Gonzalez-Hermozillio and Martin (2004). Pesaran and Pick (2003) criticise this kind of approach on the basis of three arguments: i) the analyst is required to have a priori information on the moment of the crisis; ii) the duration of the crisis is not sufficiently great to allow comparisons of correlations, principally when there are more than two assets in question; iii) there is a selection bias in the sample, since crisis
times are not known a priori.
Assume that the generating processes for the data described by the equations in the case of non-contagion (eq. 5) and contagion (eq. 6) are as follows:
eq. 5: it t t t it t t t u x z y u x z y + + = + + = 2 ' 2 2 ' 2 2 1 ' 1 1 ' 1 1 α δ α δ eq. 6: t t t L t t t t t t t t u u c y I x z y u x z y 2 1 1 , 1 1 2 2 ' 2 2 ' 2 2 1 1 ' 1 1 ' 1 1 ) ( − + + + = + + = − σ β α δ α δ
in which y represents some indicator variable for crises, such as the returns on stock indices, the change in the prices of a country’s debt securities or indices of currency pressure (Eichengreen, Rose and Wyplosz (1996)). Variable I() is an indicator with a value of unity when a negative shock of reasonable magnitude affects the asset under analysis and zero otherwise. In this way, this mechanism permits the propagation of volatility from a country by a mechanism that only operates in the presence of very strong negative shocks, altering the original structure of the model. This agrees with the literature on contagion, which views the concept as an above expected correlation during periods of tranquillity. The variable z consists of common factors which
influence all assets, such as the oil price, international interest rates, etc. The variables xi
contain fundamentals specific to the country with the property of explaining the behaviour of the variable indicating the crisis (y) and will be independent of
idiosyncratic shocks. The term σit denotes the standard deviation at time t of the term uit.
In the literature on contagion, the evaluation of the evolution on contagion has been seen as an important indicator for the analysis of contagion. An extensive literature has devoted its attentions to evaluating which are the determinants of the correlations in the case where contagion exists. After an intense debate, it was concluded that the existence of contagion cannot be considered to be a synonym of a high degree of correlation, but as some kind of structural instability associated with crisis events, with the implementation of such tests remaining an open question.
Wooldridge (1988)), BEKK (Engle and Kroner (1995)) and factorial (Lin (1992)) models are three examples of this. While major obstacle had to be overcome in order for these models to become minimally operational, a major advance was recently made in the literature with the proposal of two models in the DCC-GARCH family by Engle (2002), Engle and Sheppard (2001) and Tse (2000) and Tse and Tsui (2002). The great advantage of this model is that it has a rich structure in terms of generality and which is operationally easier to implement, even for a reasonable quantity of assets.
Under the null hypothesis of non-contagion, a DCC-GARCH structure may be seen as an approximation to the process generating the data in the form given by eq. 5. Where contagion exists, a DCC-GARCH structure is not capable in principle of taking account of a process such as the one formulated above. At the same time, the DCC-GARCH model must have some specific signals of misspecification. In eq. 6, the existence of contagion implies that volatility was ‘exported’ from the country of origin which suffered the contagion and also with the correlations when there was a negative
shock of major proportions.4
There is a literature on specification tests which allows the evaluation and testing of sources of possible misspecification, such as residual heteroscedasticity, the effects of asymmetry in the variance and instability in conditional and unconditional structures. These tests may be adapted to investigate whether the source of misspecification follows the pattern suggested in the case of contagion. The principal tests used in the literature are those of Wooldridge (1990) and Wooldridge (1991), applied by Engle and Sheppard (2001). Dungey, Fry, Gonzalez-Hermozillio and Martin (2004) review contagion tests.
5
Multivariate Models of Volatility and Contagion and
Description of the Database:
On the basis of multivariate models of volatility, we may test for the existence of structural breakdowns in the structure of volatility propagation and whether these may be attributed to moments of crisis. This approach was implemented, e.g. by Marçal and Valls Pereira (2005) and Paula (2006). The criticism that may be made of the methodology used in these studies is due to the non-correction of the fundamentals, which may bias the procedure in the direction of finding evidence for contagion, when this does not actually exist. The evidence for structural alterations may be due to alterations in the fundamentals which cause returns or alterations of a more general order, not foreseen by the same.
We collected daily stock index data for the following countries: Argentina, Brazil, South Korea, United States, Singapore, Malaysia, Mexico and Japan. The frequency of the data is daily and for the period January 1, 1994 to December 31, 2003. The sample does not include the years 2004 and 2005 since the data for some fundamentals for certain countries were not available in the researched sources. Since we chose to work with the largest possible number of countries, these years were not included. The absence of Russia is justified not by the importance of the country but by
4 The investigation could also concentrate on positive shocks. In this case, it would be a question
the fact that it was not possible to collect the fundamentals necessary for including this country in our analysis.
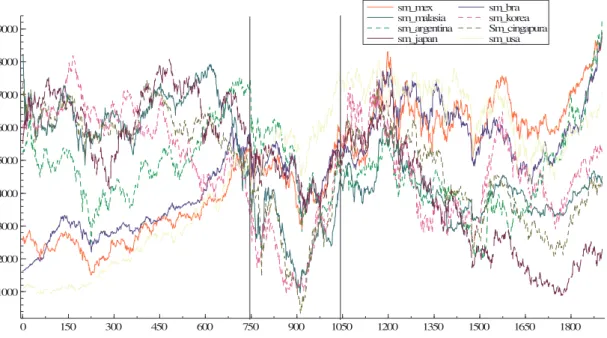
Figure 1 presents an interesting pattern. In a non-rigorous way, it is possible to identify a period of joint fall in all the indices concentrated during the highlighted period (from October of 1997 to June of 1999). Both before and afterwards, there is no defined pattern for all the equity markets, with the synchronised fall concentrated during the Asian and Russian crises.
0 150 300 450 600 750 900 1050 1200 1350 1500 1650 1800
1000 2000 3000 4000 5000 6000 7000 8000 9000
sm_mex sm_malasia sm_argentina sm_japan
sm_bra sm_korea Sm_cingapura sm_usa
Figure 1: Various stock indices: 1994-2003
Source: The authors
The fundamentals used are listed below in Table 1. Two principal sources were used: International Financial Statistics – IMF and the World Development Indicators (WDI) of the World Bank.
Table 1: Fundamentals Used Daily Fundamentals – FED and
National Central Banks: Monthly Fundamentals - IMF Annual Fundamentals - WDI
Oil price: Brent crude Interbank interest rates Growth in per capita GDP
Nominal exchange rate for national
currency against the dollar Export growth rate Degree of openness
Monthly and accumulated inflation
during previous year Foreign Direct Investment as a % of GDP
Change in level of reserves M2/Reserves
Current Account Deficit as a % of GDP
Source: The authors
6
Description of Results:
6.1 Do the fundamentals add explanatory power to the returns?
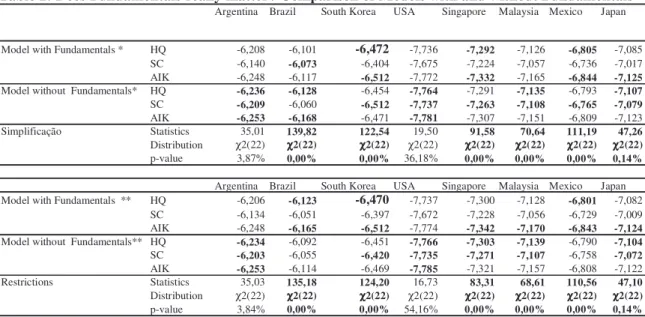
Table 2 presents of the models estimated for stock index returns for the various countries. The model with fundamentals consists of a regression of returns against the variables listed above. In the model without fundamentals, we exclude all models
corresponding to fundamentals, with only the lagged returns remaining.5 In general, the
fundamentals used in the analysis add explanatory power to the returns. The exception is the United States, and to a lesser degree, Argentina. In the other countries, there is good evidence that the model corrected for fundamentals is superior to the uncorrected
model.6
Table 2: Does Fundamentals really matter? Comparison of Models with and without Fundamentals Argentina Brazil South Korea USA Singapore Malaysia Mexico Japan
Model with Fundamentals * HQ -6,208 -6,101 -6,472 -7,736 -7,292 -7,126 -6,805 -7,085 SC -6,140 -6,073 -6,404 -7,675 -7,224 -7,057 -6,736 -7,017 AIK -6,248 -6,117 -6,512 -7,772 -7,332 -7,165 -6,844 -7,125 Model without Fundamentals* HQ -6,236 -6,128 -6,454 -7,764 -7,291 -7,135 -6,793 -7,107
SC -6,209 -6,060 -6,512 -7,737 -7,263 -7,108 -6,765 -7,079
AIK -6,253 -6,168 -6,471 -7,781 -7,307 -7,151 -6,809 -7,123
Simplificação Statistics 35,01 139,82 122,54 19,50 91,58 70,64 111,19 47,26 Distribution χ2(22) χχχχ2(22) χχχχ2(22) χ2(22) χχχχ2(22) χχχχ2(22) χχχχ2(22) χχχχ2(22) p-value 3,87% 0,00% 0,00% 36,18% 0,00% 0,00% 0,00% 0,14%
Argentina Brazil South Korea USA Singapore Malaysia Mexico Japan Model with Fundamentals ** HQ -6,206 -6,123 -6,470 -7,737 -7,300 -7,128 -6,801 -7,082
SC -6,134 -6,051 -6,397 -7,672 -7,228 -7,056 -6,729 -7,009 AIK -6,248 -6,165 -6,512 -7,774 -7,342 -7,170 -6,843 -7,124 Model without Fundamentals** HQ -6,234 -6,092 -6,451 -7,766 -7,303 -7,139 -6,790 -7,104
SC -6,203 -6,055 -6,420 -7,735 -7,271 -7,107 -6,758 -7,072
AIK -6,253 -6,114 -6,469 -7,785 -7,321 -7,157 -6,808 -7,122
Restrictions Statistics 35,03 135,18 124,20 16,73 83,31 68,61 110,56 47,10 Distribution χ2(22) χχχχ2(22) χχχχ2(22) χ2(22) χχχχ2(22) χχχχ2(22) χχχχ2(22) χχχχ2(22) p-value 3,84% 0,00% 0,00% 54,16% 0,00% 0,00% 0,00% 0,14% * Models with GJR (1,1) heteroskedastic errors.
** Models with GJR (2,2) heteroskedastic errors. Source: the authors
Following this, we collected the residuals from the regression for the returns on
the fundamentals7. These variables are used as a starting point for the volatility models.
This two-stage procedure is used in this literature on account of the complexity of the models used, although this procedure is only fully satisfactory if the returns are normal, which does not appear to be the case. In addition, the volatility models assume that the
5 We also inserted dummy variables for each weekday and in order to distinguish returns calculated using
data with a one-day interval from data with a greater interval.
6 We also calculated t-statistics on the basis of variance estimators robust to heteroscedasticity, and there
is good evidence that the fundamentals listed contain information to explain the analyzed returns.
7 We tested whether there is residual autocorrelation in the squares of the residues of the regressions and
data are an innovation and do not show serial autocorrelation. This was tested for all countries and the results were satisfactory.
6.2 Modelling the Volatility of Returns:
In modelling the volatility of returns, we used DCC-GARCH family models. Four specifications were estimated: I) GARCH-DCC (1,1); II) GARCH-DCC (2,2); III)
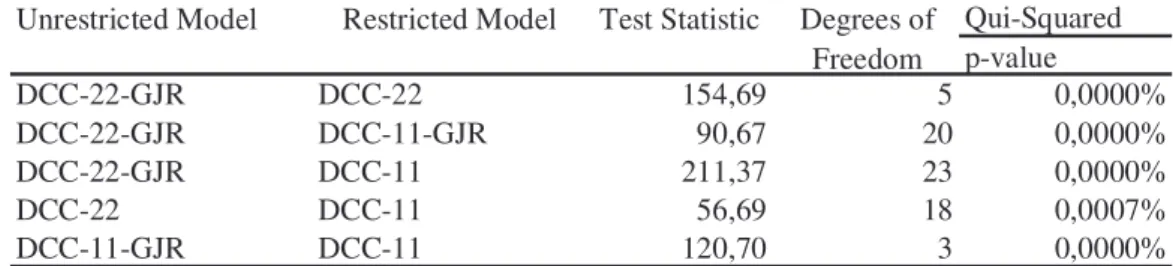
GARCH-DCC-GJR (1,1) and; IV) GARCH-DCC-GJR (2,2).8 Table 3 presents the
values of the different information criteria. The DCC-GJR models show better performance than the DCC models without asymmetry. We have a doubt as to whether to choose a model with one or two lags (DCC-11-GJR or DCC-22-GJR). Since all the models are nested, it is possible to carry out likelihood ratio tests. Table 4 presents the results of these tests and in this case, the preferred model is the DCC-22-GJR one. This model was utilised in the following analysis.
Table 3: DCC versus DCC GJR – (Glosten, Jagannathan, and Runkle )– Choosing the best model
SC HQ AIC
DCC-11 28.38 53861.45 26 1898 -56.653 -56.701 -56.729
DCC-22 28.39 53889.79 44 1898 -56.611 -56.692 -56.740
DCC-11-GJR 28.41 53921.80 29 1898 -56.704 -56.758 -56.789
DCC-22-GJR 28.43 53967.14 49 1898 -56.672 -56.763 -56.816
Source: the authors
Information Criteria
lnL(q)/T lnL(q) Number of
Parameters
Number of Observations
Table 4: Comparing the estimated DCC’s – Likelihood ratio tests.
Qui-Squared p-value
DCC-22-GJR DCC-22 154,69 5 0,0000%
DCC-22-GJR DCC-11-GJR 90,67 20 0,0000%
DCC-22-GJR DCC-11 211,37 23 0,0000%
DCC-22 DCC-11 56,69 18 0,0007%
DCC-11-GJR DCC-11 120,70 3 0,0000%
Source: the authors
Unrestricted Model Restricted Model Test Statistic Degrees of Freedom
6.3 Did Contagion Genuinely Occur?
In this section, we report the results of the specification tests to investigate sources of instability in the basic model (DCC-22-GJR) which could be attributed to
financial crises.9 It is necessary to construct dummy variables for sources of
misspecification. For the definition of a crisis we used the occurrence of negative shocks in returns which exceeded an absolute value of around 1.8 conditional standard
8 The GJR model was formulated in the article by Glosten, L.R., R. Jagannathan, and D. Runkle,
1993, On The Relation Between The Expected Value And The Volatility Of The Normal Excess Return On Stocks, Journal Of Finance 48, 1779-1801. and permits the introduction of asymmetric effects into
the volatility.
9 All of the procedures carried out for the DCC(2,2) model were done for a
deviations.10 In this way, an indicator variable for each of the countries was constructed
so that the candidate moments for the crisis were known. The indicator variables were constructed in the form suggested by the equations below:
eq. 7: 2 2 1 4 2 3 2 1 1 2 1 1 )] 8 , 1 ( )] 8 , 1 ( )] 8 , 1 ( ) 8 , 1 ( − − − − − − − < = − < = − < = − < = jt jt j jt j jt jt j jt j u I M u I M u I M u I M ε ε
in which ujt-1 represents the standard residue, ε2jt-1 represents the square of the
residue of the country equation corrected by the fundamentals and I represents an indicator variable with a value of unity when the residue is less than -1,8 and zero when it is not. The idea of the tests is to evaluate whether or not the estimated model under the null of no contagion has signs of misspecification suggested by eq. 6. The indicators functions were built up to evaluate whether or not there is evidence of misspecification suggested by contagion hypothesis as defined in section 4.
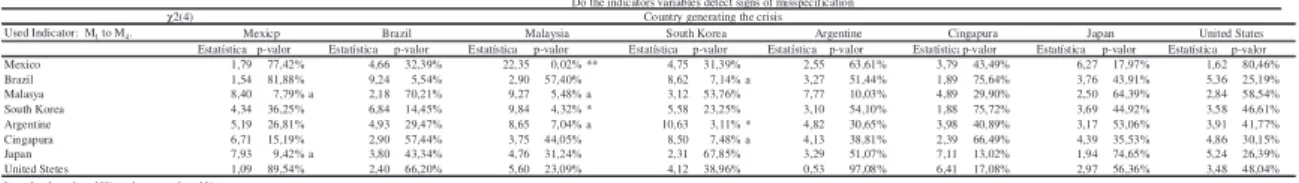
A first order of tests was carried out to evaluate whether the described indicator variables for each country are sources of misspecification in the equations of the other countries. The rejection of the null hypothesis of the test implies initial evidence in favour of contagion, since there would be two patterns of unconditional volatility. The results are presented in Table 5. There are rejections of the null hypotheses, which observe a certain pattern. There is no evidence that high intensity negative shocks represented by the indicator variables for Brazil, Mexico, Singapore, Japan and the United States caused changes in the conditional volatility pattern of the other countries. In the case of Malaysia, the shocks altered the volatility pattern for Mexico, South Korea and Argentina. In the case of South Korea, the countries affected were Brazil, Argentina and Singapore. These results suggest that the Asian crisis had perhaps generated more of a contagion effect than the Latin American crises. The negative shocks in the Mexican, Brazilian and Argentine markets do not appear to have generated significant repercussions in terms of structural alterations in the other countries.
Table 5: DCC – 22 – Is there evidence of changing in the volatility pattern? χ2(4)
Used Indicator: M1 to M4.
Estatística p-valor Estatística p-valor Estatística p-valor Estatística p-valor Estatística p-valor Estatísticap-valor Estatística p-valor Estatística p-valor Mexico 1,79 77,42% 4,66 32,39% 22,35 0,02% ** 4,75 31,39% 2,55 63,61% 3,79 43,49% 6,27 17,97% 1,62 80,46% Brazil 1,54 81,88% 9,24 5,54% 2,90 57,40% 8,62 7,14% a 3,27 51,44% 1,89 75,64% 3,76 43,91% 5,36 25,19% Malasya 8,40 7,79% a 2,18 70,21% 9,27 5,48% a 3,12 53,76% 7,77 10,03% 4,89 29,90% 2,50 64,39% 2,84 58,54% South Korea 4,34 36,25% 6,84 14,45% 9,84 4,32% * 5,58 23,25% 3,10 54,10% 1,88 75,72% 3,69 44,92% 3,58 46,61% Argentine 5,19 26,81% 4,93 29,47% 8,65 7,04% a 10,63 3,11% * 4,82 30,65% 3,98 40,89% 3,17 53,06% 3,91 41,77% Cingapura 6,71 15,19% 2,90 57,44% 3,75 44,05% 8,50 7,48% a 4,13 38,81% 2,39 66,49% 4,39 35,53% 4,86 30,15% Japan 7,93 9,42% a 3,80 43,34% 4,76 31,24% 2,31 67,85% 3,29 51,07% 7,11 13,02% 1,94 74,65% 5,24 26,39% United Stetes 1,09 89,54% 2,40 66,20% 5,60 23,09% 4,12 38,96% 0,53 97,08% 6,41 17,08% 2,97 56,36% 3,48 48,04%
a p-value less than 10% and greater than 1%
* p-value less than 5% and greater than 1%. ** p-value less than 1%.
Source: The authors
Country generating the crisis Do the indicators variables detect signs of misspecification
Japan United States Mexicp Brazil Malaysia South Korea Argentine Cingapura
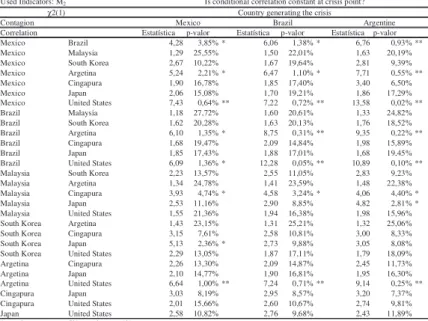
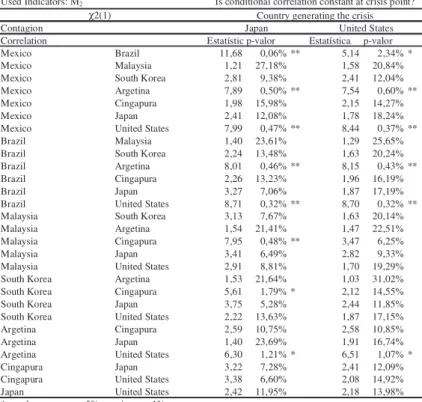
Table 6, Table 7, Table 8 present the results of evaluating whether the negative
shocks in one country affected 1) the correlations between this country and the others and 2) also the pairwise correlation of the other countries with each other. In the first case, this is a necessary part of the direct evaluation of contagion. In the second case,
10 The same procedures were also carried out using the value of 2 standard deviations without a
we evaluate whether a crisis transmitted from country A to country B generated collateral effects in another country C. By way of example, suppose that a crisis in country A could have generated contagion effects in B. This could have led to portfolio reallocations, leading to sell orders for shares in a third country. In this way, the correlation between countries B and C was affected even though the generator of the crisis was country A. The cited tables contain information on these two types of phenomena.
The results suggest that 1) crises generated in the countries of Latin America had a strong regional impact, but were propagated weakly to some Asian countries; 2) the crises generated in the Asian countries had a strong regional impact, being propagated strongly to Latin America. In all cases, the crisis affected the U.S. market. Given that the fundamentals were not available for Russia, this country had to be excluded from the analysis, even though the period studied includes the Russian crisis, and hence the changes in the indices may be portraying the indirect effects of the Russian crisis. It follows that part of the contagion detected between the United States and Asia may be due to the propagation of the Russian crisis.
As a conjecture, the ‘collateral’ effect was more intense in countries with more fragile fundamentals. In the case of the Asian crisis, Brazil and Argentina did not escape unscathed on account of more fragile fundamentals, in particular, because of a currency regime which maintained the exchange rate at a clearly overvalued level, and of poor fiscal fundamentals. An attempt to explain why the Asian countries succeeded in remaining immune to the Latin American crises perhaps lies in the temporal sequence of events. The Asian crisis occurred at a time when Brazil and Argentina had extremely fragile fundamentals with significant fiscal deficits and currency misalignments. The crises in these countries occurred at a point when the Asian countries were undergoing a clear recovery and already had more solid fundamentals which made them ‘immune’ to contagion. At the same time, this is a conjecture which remains to be demonstrated and which cannot be directly extracted from the analysis realised in this study.
Table 6: DCC - GJR – 22 – Latin America - Is there a change in the conditional correlation pattern?
Used Indicators: M2
χ2(1) Contagion
Estatística p-valor Estatística p-valor Estatística p-valor Mexico Brazil 4,28 3,85% * 6,06 1,38% * 6,76 0,93% ** Mexico Malaysia 1,29 25,55% 1,50 22,01% 1,63 20,19% Mexico South Korea 2,67 10,22% 1,67 19,64% 2,81 9,39% Mexico Argetina 5,24 2,21% * 6,47 1,10% * 7,71 0,55% ** Mexico Cingapura 1,90 16,78% 1,85 17,40% 3,40 6,50% Mexico Japan 2,06 15,08% 1,70 19,21% 1,86 17,29% Mexico United States 7,43 0,64% ** 7,22 0,72% ** 13,58 0,02% ** Brazil Malaysia 1,18 27,72% 1,60 20,61% 1,33 24,82% Brazil South Korea 1,62 20,28% 1,63 20,13% 1,76 18,52% Brazil Argetina 6,10 1,35% * 8,75 0,31% ** 9,35 0,22% ** Brazil Cingapura 1,68 19,47% 2,09 14,84% 1,98 15,89% Brazil Japan 1,85 17,43% 1,88 17,01% 1,68 19,45% Brazil United States 6,09 1,36% * 12,28 0,05% ** 10,89 0,10% ** Malaysia South Korea 2,23 13,57% 2,55 11,05% 2,83 9,23% Malaysia Argetina 1,34 24,78% 1,41 23,59% 1,48 22,38% Malaysia Cingapura 3,93 4,74% * 4,58 3,24% * 4,06 4,40% * Malaysia Japan 2,53 11,16% 2,90 8,85% 4,82 2,81% * Malaysia United States 1,55 21,36% 1,94 16,38% 1,98 15,96% South Korea Argetina 1,43 23,15% 1,31 25,21% 1,32 25,06% South Korea Cingapura 3,15 7,61% 2,58 10,81% 3,00 8,33% South Korea Japan 5,13 2,36% * 2,73 9,88% 3,05 8,08% South Korea United States 2,29 13,05% 1,87 17,11% 1,79 18,09% Argetina Cingapura 2,26 13,30% 2,09 14,87% 2,45 11,73% Argetina Japan 2,10 14,77% 1,90 16,81% 1,95 16,30% Argetina United States 6,64 1,00% ** 7,24 0,71% ** 9,14 0,25% ** Cingapura Japan 3,03 8,19% 2,95 8,57% 3,20 7,37% Cingapura United States 2,01 15,66% 2,60 10,67% 2,74 9,81% Japan United States 2,58 10,82% 2,76 9,68% 2,43 11,89% * p-valor menor que 5% e maior que 1%.
** p-valor menor que 1%. Source: The authors. Correlation
Argentine Country generating the crisis
Table 7: DCC – 22 – Asia - Is there a change in the conditional correlation pattern?
Used Indicators: M2 χ2(1) Contagion
Estatística p-valor Estatística p-valor Estatísticap-valor
Mexico Brazil 4,83 2,79% * 5,07 2,43% * 3,83 5,04%
Mexico Malaysia 1,42 23,41% 1,54 21,42% 1,20 27,32%
Mexico South Korea 2,51 11,28% 1,54 21,53% 2,08 14,88%
Mexico Argetina 7,37 0,66% ** 10,31 0,13% ** 3,71 5,41%
Mexico Cingapura 2,13 14,43% 2,56 10,96% 3,91 4,80% *
Mexico Japan 2,81 9,36% 1,95 16,28% 1,47 22,48%
Mexico United States 7,35 0,67% ** 6,62 1,01% * 10,84 0,10% **
Brazil Malaysia 1,88 16,99% 1,70 19,24% 1,30 25,45%
Brazil South Korea 1,93 16,52% 1,68 19,48% 2,38 12,26%
Brazil Argetina 6,75 0,94% ** 2,87 9,04% 5,35 2,07% *
Brazil Cingapura 2,63 10,47% 2,04 15,34% 3,90 4,83% *
Brazil Japan 2,51 11,34% 1,76 18,50% 1,92 16,60%
Brazil United States 7,21 0,72% ** 2,19 13,92% 9,48 0,21% **
Malaysia South Korea 2,27 13,19% 2,90 8,87% 3,76 5,24%
Malaysia Argetina 1,38 23,94% 2,09 14,86% 1,24 26,60%
Malaysia Cingapura 4,81 2,82% * 11,69 0,06% ** 7,02 0,81% **
Malaysia Japan 4,16 4,15% * 4,44 3,51% * 2,73 9,83%
Malaysia United States 1,85 17,37% 2,99 8,39% 1,96 16,20%
South Korea Argetina 1,77 18,35% 1,43 23,25% 1,17 27,87%
South Korea Cingapura 2,98 8,45% 3,73 5,36% 5,35 2,08% *
South Korea Japan 7,19 0,73% ** 4,69 3,03% * 5,46 1,95% *
South Korea United States 1,74 18,70% 2,08 14,90% 2,45 11,78%
Argetina Cingapura 2,19 13,92% 4,28 3,87% * 3,21 7,32%
Argetina Japan 2,14 14,37% 2,11 14,60% 1,40 23,67%
Argetina United States 5,65 1,74% * 5,88 1,53% * 7,57 0,59% **
Cingapura Japan 3,90 4,84% * 6,37 1,16% * 6,40 1,14% *
Cingapura United States 2,69 10,07% 3,20 7,34% 4,35 3,71% *
Japan United States 1,70 19,16% 2,61 10,61% 2,14 14,32%
* p-valor menor que 5% e maior que 1%. ** p-valor menor que 1%.
Source: The authors. Correlation
Cingapura Country generating the crisis
Is conditional correlation constant at crisis point?
Malaysia South Korea
Table 8: DCC – 22 – Japan and United States - Is there a change in the conditional correlation pattern? Used Indicators: M2
χ2(1) Contagion
Estatísticap-valor Estatística p-valor Mexico Brazil 11,68 0,06% ** 5,14 2,34% *
Mexico Malaysia 1,21 27,18% 1,58 20,84%
Mexico South Korea 2,81 9,38% 2,41 12,04% Mexico Argetina 7,89 0,50% ** 7,54 0,60% ** Mexico Cingapura 1,98 15,98% 2,15 14,27%
Mexico Japan 2,41 12,08% 1,78 18,24%
Mexico United States 7,99 0,47% ** 8,44 0,37% **
Brazil Malaysia 1,40 23,61% 1,29 25,65%
Brazil South Korea 2,24 13,48% 1,63 20,24% Brazil Argetina 8,01 0,46% ** 8,15 0,43% ** Brazil Cingapura 2,26 13,23% 1,96 16,19%
Brazil Japan 3,27 7,06% 1,87 17,19%
Brazil United States 8,71 0,32% ** 8,70 0,32% ** Malaysia South Korea 3,13 7,67% 1,63 20,14% Malaysia Argetina 1,54 21,41% 1,47 22,51% Malaysia Cingapura 7,95 0,48% ** 3,47 6,25%
Malaysia Japan 3,41 6,49% 2,82 9,33%
Malaysia United States 2,91 8,81% 1,70 19,29% South Korea Argetina 1,53 21,64% 1,03 31,02% South Korea Cingapura 5,61 1,79% * 2,12 14,55% South Korea Japan 3,75 5,28% 2,44 11,85% South Korea United States 2,22 13,63% 1,87 17,15% Argetina Cingapura 2,59 10,75% 2,58 10,85%
Argetina Japan 1,40 23,69% 1,91 16,74%
Argetina United States 6,30 1,21% * 6,51 1,07% *
Cingapura Japan 3,22 7,28% 2,41 12,09%
Cingapura United States 3,38 6,60% 2,08 14,92% Japan United States 2,42 11,95% 2,18 13,98% * p-valor menor que 5% e maior que 1%.
** p-valor menor que 1%. Source: The authors.
Japan United States Is conditional correlation constant at crisis point?
Country generating the crisis
7
Conclusions:
In this article, we have sought to test the hypothesis of contagion in the financial crises of Latin America and Asia. The approach used consists of using multivariate volatility models of the DCC-GARCH family in the version proposed by Engle and Sheppard (2001). The estimated models were corrected for country-specific fundamentals, with the need for correction by fundamentals given by Pesaran and Pick (2003).
The results obtained in this article show the evidence favourable to the hypothesis of regional contagion in both Latin America and in Asia. As a rule, there was contagion in the Asian crisis to Latin America, but not vice-versa. The United States and Japan played the role of vectors for contagion, with the first basically to Latin America and the second to both regions. An explanation for the role of these countries as contagion vectors lies in the strong trade and financial links between the United States and Latin America and the very deep trade links between Japan and Asia.
A conjecture to explain the vulnerability of Latin America to the financial crises lies in its poor economic fundamentals during the period, as well as the existence of a phase of transition to greater openness in trade and financial terms, through which Latin American countries were passing at the time.
As limitations of this work, we may highlight: the impossibility on the basis of the instrument used of clearly identifying the countries which generated the crisis. At most, as a function of the temporal sequence it is possible to identify the wave of propagation of the crises and whether these imply some kind of instability in the propagation mechanism over time.
8
References:
Akerlof, G. A. , P. Romer, and M. Looting, 1994, The Economic Underworld Of Bankrupcy For Profit, NBER Working Paper R1869 (NBER).
Allen, F. , and D. Gale, 2004a, Financial Fragility, Liquidity And Asset Prices, Wharton School Center fo Financial Institutions (University of Pensilvania).
Allen, F., and D. Gale, 2004b, From Cash-In-The-Market Pricing To Financial
Fragility., Journal of European Economics Association 3, 535-546.
Allen, F., and D. Gale, 2007. Understanding Financial Crises (Oxford University Press,
Oxford).
Bae, K. H., G. A. Karolyi, and R. Stulz, 2003, A New Approach To Measuring
Financial Contagion., Review Of Financial Studies Vol. 16,, 717-763.
Baig, T , and I. Goldfajn, 2000, The Russian Default And The Contagion To Brazil., Working Paper 00/160 (International Monetary Fund., Washington).
Baig, T, and I. Goldfajn, 1998, The Asian Crisis. , Working Paper 98/155 (International Monetary Fund., Washington).
Bekaert, G., C. Harvey, and C. Lundlad, 2003, Does Financial Globalization Spur
Growth? , Journal of Financial Research 85.
Billio, M., M. Lo Duca, and L. Pellizzon, 2003, The Dcc Test: Powerless Evidence Of No Contagion. , Working Paper N. 03.07 (Greta).
Blanchard, O. , and M. Watson, 1982, Bubbles, Rational Expectations And Financial
Markets., in Paul Wachtel, ed.: In The Economic And Financial Structure
(Lexington Books. ).
Bollerslev, T., R. F. Engle, and J. M. Wooldridge, 1988, A capital asset pricing model
with time varying covariances, Journal of Political Economy 96, 116--131.
Bollerslev, Tim, 1986, Generalized Autoregressive Conditional Heteroskedasticity,
Journal of Econometrics 31, 307-327.
Bordo, M. , and A. P. Murshid, 2000, Financial Crises Becoming Increasingly More Contagious? What Is The Historical Evidence On Contagion? , NBER Working Paper W790 (NBER).
Boyer, B. H., T. Kumagai, and K. Yuan, 2005, How Do Crises Spread, AFA 2003 Meetings (AFA, Washington).
Calvo, G. , and E. Mendoza, 1998, Rational Herd Behavior And The Globalization Of Securities Markets., Duke Economic Papers (Duke University).
Calvo, G. A. , and E Talvi, 2005, Sudden Stop, Financial Factors And Economic Colappse NBER Working Paper W11153 (NBER).
Calvo, G. A., A. Izquierdo, and E Talvi, 2003, Suden Stops, The Real Exchange Rate And Fiscal Sustainbility: Argentina´S Lessons., Nber Working Paper 9828 (Nber).
Calvo, S, and C. Reinhart, 1996, Is There Evidence Of Contagion Effects? , in
Guillermo Calvo, Morris Goldstein, and Eduard Hochreiter, eds.: In: Private
Capital Flows To Emerging Markets.
Caporale, G. M., A. Sipolini, and N. Spagnolo, 2003, Testing For Contagion: A
Conditional Correlation Análisis., Journal Of Emprical Finance. 12, 776-489.
Castro, I. S. B., and C. L. Leite, 2003, Estimando Probabilidade de Ocorrência de Crises Cambiais no Brasil (1994-1999), Anais do XXXI Encontro Nacional de Economia da ANPEC.
Chiang, T. C., B. N. Jeon, and H. Li, 2007, Dynamic Correlation Analysis Of Financial
Contagion: Evidence From Asian Markets., Journal of International Money and
Finance forthcoming.
Cole, Harold, and J. Kehoe, 1996, A self-fulfilling model of Mexico 1994-1995 debt
crisis Journal Of International Economics 41, 309-330.
Corsetti, G., M. Pericoli, and M. Sbracia, 2005, Some Contagion, Some
Interdependence: More Pitfalls In Tests Of Financial Contagion., Journal Of
International Money And Finance, 24, 1177-1199.
Corsetti, G., P. Pesenti, and N. Roubini, 1998, What Caused The Asian Currency And Financial Crises? Part I: A Macroeconomic Overview., Nber Working Paper 6833. (Nber).
Diamond, D. , and P. Dybvig, 1983, Bank Uns, Liquidity, And Deposit Insurance.,
Journal of political economy 91, 401-419.
Dornbush, R., Y. C. Park, and S. Claessens, 2000, Contagion: Understanding How it
Spreads, The World Bank Observer 15, 177-197.