__________________________________
1 Agrônomo, Pós Graduando Do PPG Em Produção Vegetal, FCAV/UNESP, [email protected].
2 Prof. Adjunto, Departamento De Engenharia Rural, FCAV/UNESP, [email protected]. Bolsista de Produtividade do CNPq. 3 Prof. Adjunto, Departamento De Ciências Exatas, FCAV/UNESP, [email protected]. Bolsista de Produtividade do CNPq.
REDUCED TILLAGE DESCRIBED BY AN EXPONENTIAL DECAY IN TIME MODEL
LUIS G. TEIXEIRA1, AFONSO LOPES2, NEWTON LA SCALA JR.3
ABSTRACT: To study Assessing the impact of tillage practices on soil carbon losses dependents it is necessary to describe the temporal variability of soil CO2 emission after tillage. It has been
argued that large amounts of CO2 emitted after tillage may serve as an indicator for longer-term
changes in soil carbon stocks. Here we present a two-step function model based on soil temperature and soil moisture including an exponential decay in time component that is efficient in fitting intermediate-term emission after disk plow followed by a leveling harrow (conventional), and chisel plow coupled with a roller for clod breaking (reduced) tillage. Emission after reduced tillage was described using a non-linear estimator with determination coefficient (R2) as high as 0.98. Results indicate that when emission after tillage is addressed it is important to consider an exponential decay in time in order to predict the impact of tillage in short-term emissions.
KEYWORDS: soil respiration, soil CO2 emission, soil tillage, greenhouse effect.
VARIABILIDADE TEMPORAL DA EMISSÃO DE CO2 DO SOLO APÓS PREPARO
CONVENCIONAL E REDUZIDO DESCRITO POR MODELO EXPONENCIAL DECRESCENTE NO TEMPO
RESUMO: A quantificação do impacto das práticas de preparo sobre as perdas de carbono do solo é dependente da habilidade de se descrever a variabilidade temporal da emissão de CO2 do solo
após preparo. Tem sido sugerido que as grandes quantidades de CO2 emitido após o preparo do solo
podem servir como um indicador das modificações nos estoques de carbono do solo em longo termo. Neste trabalho é apresentado um modelo de duas partes baseado na temperatura e na umidade do solo e que inclui um termo exponencial decrescente do tempo que é eficiente no ajuste das emissões intermediárias após preparo: arado de disco seguido de uma passagem com a grade niveladora (convencional) e escarificador de arrasto seguido da passagem com rolo destorroador (reduzido). As emissões após o preparo do solo são descritas utilizando-se estimativa não linear com um coeficiente de determinação (R2) tão alto quanto 0.98 após preparo reduzido. Os resultados indicam que nas previsões da emissão de CO2 após o preparo do solo é importante considerar um
termo exponencial decrescente no tempo após preparo.
PALAVRAS-CHAVE: respiração do solo, emissão de CO2 do solo, preparo do solo, efeito estufa.
INTRODUCTION
There has been a great deal of interest in studying soil CO2 emission of agricultural areas,
especially when the use and management of soils are considered. Due to the high spatial and temporal variability of soil CO2 emission the uncertainty on this topic is significant; however, it is
already accepted that reductions in tillage intensity and frequency could help achieving soil carbon recovery (BRONICK & LAL, 2005). Tillage causes higher rates of soil CO2 emission in short and
frequency of conventional tillage events have declined over the last years (REICOSKY & ALLMARAS, 2003).
When tillage is applied, the protected organic matter becomes unprotected, in practice increasing the labile organic matter available to microbial activity (SIX et al., 1999). In addition, changes in soil carbon decay rate are expected with decreases in soil bulk density and increases in soil pore volume. Recently, based on these assumptions, conceptual models have been proposed to describe the tillage induced emission. LA SCALA et al. (2008) used no-till emission as a reference in order to model emission after tillage. REICOSKY & ARCHER (2007) suggested that the process is described by an initially rapid decline in CO2 flux followed by a slower flux, requiring the use of
a two-step function.A new two-step model is presented in order to fit emissions after tillage. The main hypothesis is that soil CO2 emission after tillage is modulated by two components: the first
directly related to soil temperature and soil moisture, and the second related to an expected rapid dynamics of the additional labile carbon induced by tillage. Thus, it is suggested the following function to describe the temporal variability of soil CO2 emissions after tillage (FCO2):
)) t ( C ( F )) t ( ), t ( T ( F ) t (
FCO2 = I θ + II labile (1)
The first term of equation 1 (FI) incorporates soil temperature and soil moisture variability.
The second term (FII) is related to the rapid changes due to the additional labile carbon (Clabile) made
available to microbes by tillage. When this term is taken into account, it is considered that the labile carbon dynamics is governed by first-order decay equation:
T T kC dt dC − =
In the equation above k (day-1) is the so-called decay constant and CT is the labile carbon
made available to microbial activity (in g m-2) by tillage. The increase of labile carbon could be due to the crop residuals incorporated into the soil by tillage or the break of aggregates and exposition of protected fresh organic carbon to microbial activity. The labile carbon was modeled by the following exponential decay equation:
kt T 0
T C e
C −
=
Where C0T is the labile carbon available at the initial time and induced by tillage (g CO2 m-2),
k is the decay rate, and t is the time (hours). One reasonable assumption is that soil CO2 losses is
proportional to the soil carbon decayed after tillage. Mathematically, this can be written as:
kt T 0 T
II dt C ke
dC ) t ( F − = − α (2) Considering the efficiency of microbial activity to convert soil carbon in CO2 as β, equation 2
is converted to:
kt T 0 kt T 0
II(t) (C ke ) C ke
F − −
β = β
−
= (3)
Making a3=βC0Tk e a4= k, leads to:
) t ( FII =
t a 3e 4
a − (4)
The dependence of soil CO2 emission on soil temperature and soil moisture has been studied
by several authors. Linear, exponential, and logarithmic models have been proposed in vegetated and bare soils (JABRO et al., 2008). In this work a linear dependence of emission on soil moisture and soil temperature is considered in a semi-empirical model. Therefore, the first term of equation 1 can be written as:
θ
2 1T a a
FI = + (5)
And the two-term proposed model written as:
t a
CO aT a a e
F 4
3 2 1 2
− + +
= θ (6)
Two tillage systems are mainly used in Southern Brazil: disk plow followed by a leveling harrow (conventional) or chisel plow coupled with a roller for clod breaking (reduced). The objective of this study is to apply equations 4 and 5 separately to describe emission after tillage, and the two-step model (equation 6) to assess soil CO2 emission in a two-week time frame.
MATERIAL AND METHODS
The experiment was conducted in the experimental station of the FCAV/UNESP, located at 21o14´S and 48o17´W, in the State of São Paulo, Brazil. The climate of the region is classified as Cwa, according to Köppen, having rainy summers and dry winters. Trials started on December 15, 2005, in two adjacent plots measuring 10 x 2 meters each. On a bare Latosol (pH around 5) previously cultivated with maize (Zea mays, L.) two tillage systems were applied: disk plow
followed by a leveling harrow (conventional), and chisel plow coupled with a roller for clod breaking (reduced). The tillage depth in both plots was 30 cm, and the roller for clod breaking worked at a 6 cm depth. Soil was kept bare during the two week study as no seedling occurred. For those operations, it was used a Valtra tractor (140 cv) running at 4 km h-1 and coupled to a harrow or a chisel.
Just after tillage, six PVC soil collars having 10 cm diameter each were installed in each plot, inserted 3 cm inside the soil. Measurements of soil CO2 emission, soil temperature and soil
moisture started few minutes after tillage during a period of nine days, from the 15th to the 17th,
from the 19th to the 22nd , and at the 28th and the 29th of December 2005, always in the mornings. Emissions were measured using a LI-6400 system (Li-Cor, NE, USA) coupled with a soil temperature probe (LI-8100-102 model, thermistor based) that was inserted into the soil in all studied point at a 0-20 cm depth. This system uses infrared sensors to compute the time changes of CO2 concentration inside a chamber, and calculates emission in each of the studied points. One
single measurement takes around 1.5 minutes, based on raw measurements of CO2 concentration
changes inside the chamber every 3 seconds. Soil moisture (% volume) was monitored (0-20 cm depth) in each studied point by using TDR probes (Campbell Scientific, Utah, USA). The sofware Statistica (StatSoft, Inc.) was used for fitting soil CO2 emission after conventional and reduced
tillage using equations 4 to 6. Model parameters were estimated using non-linear least square estimation with the Gauss-Newton algorithm.
RESULTS AND DISCUSSION
Results of modeling soil CO2 emission after conventional and reduced tillage by using FI and
FII functions (equations 5 and 4) separately can be found in Table 1. Function FI is a simple linear
dependence on soil temperature and soil moisture and explains 9 and 2% of emission variability in the reduced and conventional treatments. When FII only is applied to data, around 30% of emission
variability is explained with just one non-significant (p>0.10) parameter (a4). It can be noticed that
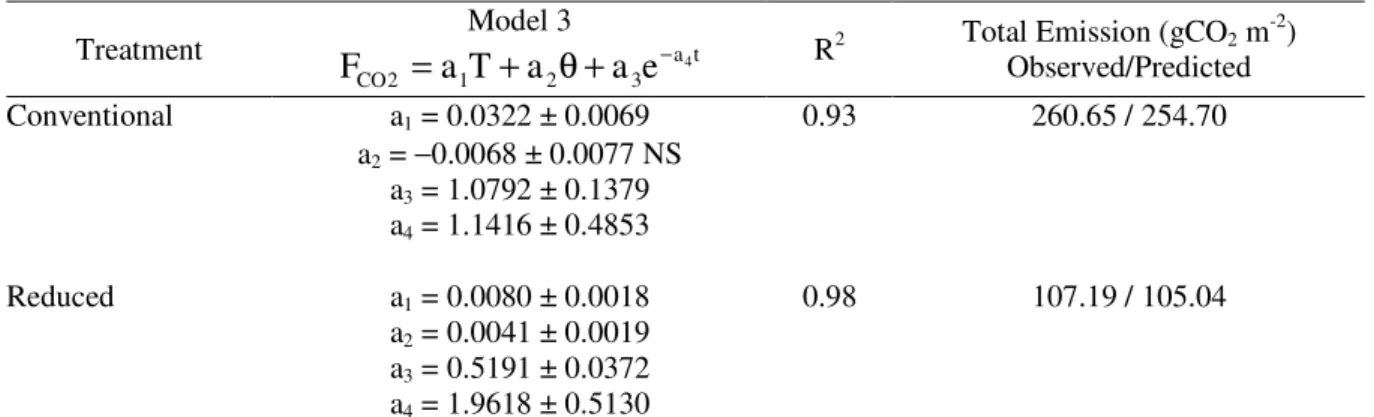
When the two-step function is applied to the data set from both treatments, fitting parameters are significantly improved (Table 2). The coefficients of determination (R2) for the
fittings were 0.93 e 0.98, for conventional and reduced treatments, respectively. Therefore, the exponential decay in time after tillage coupled with a model for linear dependence on soil temperature and soil moisture is a more adequate model to describe, in this case, emission after conventional and reduced tillage. Extracted parameters (a1-a4) of model proposed by Equation 6
were significant (p<0.10) with an exception made to a2 parameter for conventional treatment. The a1
and a2 parameters were mostly positive as expected for the dependence of soil CO2 emission on soil
temperature and soil moisture (LIU et al., 2008; SAVAGE & DAVIDSON, 2003; SALOKHE & RAMALINGAM, 2001). In addition, values of a4 were positive, therefore, a typical exponential
decay is adequate for describing soil emission after tillage as has been reported in many studies conducted at different soil and climate conditions (LA SCALA et al., 2001, 2005, 2006; REICOSKY, 2002; ROCHETTE & ANGERS, 1999; FORTIN et al., 1996).
Despite all the efforts, only a few authors have proposed models that have considered soil moisture and temperature in modeling CO2 soil emission after tillage using an exponential decay in
time model. The coefficients of determination found here are superior to the ones found by ELLERT & JANZEN (1999) when simple decay in time function was applied to fitting observed data. Also, it is noticeable that total emissions predicted (by integrating the area bellow the curves of Figure 1) show good agreement with observed data. Deviations between predicted and observed values were around 2% in both treatments: 260.65/254.70 gCO2 m-2 and 107.19/105.04
(observed/predicted) gCO2 m-2 after conventional and reduced tillage, respectively (Table 2).
TABLE 1. Estimated parameters ± standard error and R2 for the studied treatments after model adjustments.
Treatment Model:
θ +
= 1 2
I a T a
F R2
Model: t a 3
II ae 4
F =+ − R2
Conventional a1 = 0.0409 ± 0.0209 0.02 a3 = 1.1712 ± 0.2100 0.34
a2 = −0.0091 ± 0.0226 NS a4 = 0.0715 ± 0.0371
Reduced a1 = 0.0196 ± 0.0083 0.09 a3 = 0.4998 ± 0.0954 0.31
a2 = −0.0062 ± 0.0094 NS a4 = 0.0724 ± 0.0397 NS
NS: non-significant p>0.10. a1 in gCO2 m-2 h-1oC-1 and a2 in gCO2 m-2 h-1 %vol-1 a4 in gCO2 m-2 h-1 and a4 in day-1. R2: determination
coefficient.
TABLE 2. Estimated parameters ± standard error and R2 for the studied treatments after models adjustment.
Treatment Model 3 at
3 2 1 2
CO
a
T
a
a
e
4F
−+
θ
+
=
R2Total Emission (gCO2 m-2)
Observed/Predicted
Conventional a1 = 0.0322 ± 0.0069 0.93 260.65 / 254.70
a2 = −0.0068 ± 0.0077 NS
a3 = 1.0792 ± 0.1379 a4 = 1.1416 ± 0.4853
Reduced a1 = 0.0080 ± 0.0018 0.98 107.19 / 105.04
a2 = 0.0041 ± 0.0019
a3 = 0.5191 ± 0.0372 a4 = 1.9618 ± 0.5130
NS: non-significant p>0.10. a1 in gCO2 m-2 h-1oC-1 and a2 in gCO2 m-2 h-1 %vol-1 a4 in gCO2 m-2 h-1 and a4 in day-1. R2: determination
0 2 4 6 8 10 12 14 0,4
0,8 1,2 1,6
S
o
il
C
O
2e
m
is
s
io
n
(
g
C
O
2m
-2
h
-1)
Day after tillage
Conv (obs)
Conv (pred)
Red (obs)
Red (pred)
FIGURE 1. Observed (blue symbols and solid lines) and predicted (dashed lines) soil CO2 emission
after conventional and reduced tillage.
Figure 1 presents the observed (solid lines) and predicted (dashed lines) soil CO2 emission in
conventional (triangles) and reduced (squares) tillage treatments during the studied period. In the first studied day, some hours after tillage, emissions were as high as 1.74 and 0.78 g CO2 m-2 h-1 in
the conventional and reduced treatments, respectively. It is possible to observe an exponential decay-like aspect of emissions that, in our model, is modeled by the exponential in time function. Small fluctuations throughout experiment were presumably due to the changes in soil temperature and soil moisture. Rainfall occurred in this experiment in the days 1, 3 to 5, 10 and 12, with daily precipitations as high as 10 mm. Changes in soil moisture (% volume) and soil temperature (oC) can be observed in Figures 2a and 2b, respectively. Soil temperature was as low as 22 oC in the 5th day
and as high as 31 oC in the 13th day after tillage (Figure 2a). Changes in soil moisture were also large in time, as in reduced treatments they were as low as 14%, just after tillage, and as high as 29% (Figure 2b). Soil moisture was kept higher in conventional then in the reduced treatments during almost the whole studied period, reaching highest values in the 4th day after tillage (31.2%). By comparing predicted (dashed lines) to observed values (solid lines) in Figure 1, it is possible to notice that our model was able to capture minor fluctuations of emission in both plots during the experiment.
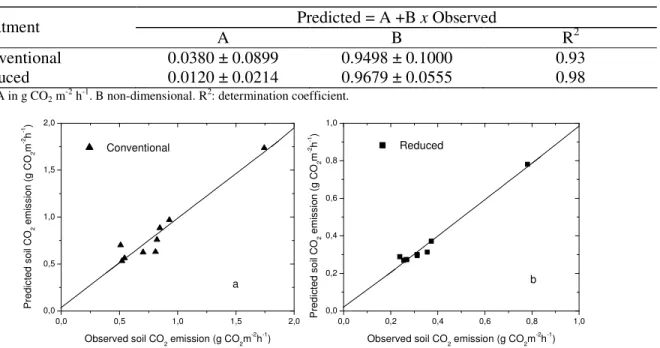
Table 3 and Figure 3a and 3b present parameters and regression adjustments (p<0.001) between predicted and observed soil CO2 emission after tillage. As one can notice, both adjustments
(conventional and reduced). It can be sustained that time after tillage is an important variable defining emission after tillage events. This is probably associated to the additional labile carbon induced after tillage event and how it decays over time.
0 2 4 6 8 10 12 14
22 24 26 28 30 32 a S o il te m p e ra tu re ( 0 C )
Day after tillage
TConventional TReduced
0 2 4 6 8 10 12 14
16 20 24 28 32 b S o il m o is tu re ( % v o lu m e )
Day after tillage
θConventional θReduced
FIGURE 2. Soil temperature (a) and soil moisture (b) in reduced (red square and dotted line) and conventional (black triangle and solid line) tilled plots.
TABLE 3. Parameters ± standard error of regressions between predicted and observed data for studied treatments.
Predicted = A +B x Observed
Treatment
A B R2
Conventional 0.0380 ± 0.0899 0.9498 ± 0.1000 0.93 Reduced 0.0120 ± 0.0214 0.9679 ± 0.0555 0.98
A in g CO2 m-2 h-1. B non-dimensional. R2: determination coefficient.
0,0 0,5 1,0 1,5 2,0
0,0 0,5 1,0 1,5 2,0 a P re d ic te d s o il C O2 e m is s io n ( g C O2 m -2h -1)
Observed soil CO2 emission (g CO2m-2
h-1
) Conventional
0,0 0,2 0,4 0,6 0,8 1,0
0,0 0,2 0,4 0,6 0,8 1,0 b P re d ic te d s o il C O2 e m is s io n ( g C O2 m -2 h -1 )
Observed soil CO2 emission (g CO2m-2
h-1
) Reduced
FIGURE 3. Observed versus predicted values of soil CO2 emission (a) after conventional, and (b)
reduced tillage.
CONCLUSION
A model including an exponential decay in time part was able to better describe short-term emissions after tillage. The model that takes into account temperature, moisture coupled with an exponential in time decay function is better suitable to describe CO2 emission over time than a
simple model that considers only soil temperature and moisture.
REFERENCES
BRONICK, C.J.; LAL, R. Soil structure and management: a review. Geoderma, Amsterdam, v.124,
p.3-22, 2005.
ELLERT, B.H.; JANZEN, H.H. Short-term influence of tillage on CO2 fluxes from a semi-arid soil
on the Canadian prairies. Soil & Tillage Research, Amsterdam, v.50, p.21-32, 1999.
FORTIN, M.C.; ROCHETTE, P.; PATTEY, E. Soil carbon dioxide fluxes from conventional and no-tillage small-grain cropping systems. Soil Science Society of America Journal, Madison, v.60,
p.1.541-1.547, 1996.
JABRO, J.D.; SAINJU, U.; STEVENS, W.B.; EVANS, R.G. Carbon dioxide flux as affected by tillage and irrigation in soil converted from perennial forages to annual crops. Journal of
Environmental Management, Amsterdam, v.88, n.4, p.1.478-1.484, 2008.
LAL, R. Soil carbon sequestration to mitigate climate change. Geoderma, Amsterdam, v. 123,
p.1-22, 2004.
LA SCALA, N.; BOLONHEZI, D.; PEREIRA, G.T. Short-term soil CO2 emission after
conventional and reduced tillage of a no-till sugar cane area in southern Brazil. Soil & Tillage Research, Amsterdam, v.91, p.244-248, 2006.
LA SCALA, N.; LOPES, A.; MARQUES JR., J.; PEREIRA, G.T. Carbon dioxide emissions after application of tillage systems for a dark red latosol in souther Brazil. Soil & Tillage Research,
Amsterdam, v.62, p.163-166, 2001.
LA SCALA, N.; LOPES, A.; PANOSSO, A.R.; CÂMARA, F.T.; PEREITA, G.T. Soil CO2 efflux
following rotary tillage of a tropical soil. Soil & Tillage Research, Amsterdam, v.84, p.222-225,
2005.
LA SCALA, N.; LOPES, A.; SPOKAS, K.; ARCHER, D.; REICOSKY, D.C. First-order decay models to describe soil C-CO2 loss after rotary tiller. Scientia Agricola, Piracicaba, v.66, p.650-657,
2009b.
LA SCALA, N.; LOPES, A.; SPOKAS, K.; ARCHER, D.; REICOSKY, D.C. Short-term temporal changes of bare soil CO2 fluxes after tillage described by first-order decay models. European Journal of Soil Science, Edinburgh, v.60, p.258-264, 2009a.
LA SCALA, N.; LOPES, A.; SPOKAS, K.; BOLONHEZI, D.; ARCHER, D.; REICOSKY, D.C. Short-term temporal changes of soil carbon losses after tillage described by a first-order decay model. Soil & Tillage Research, Amsterdam, v.99, p.108-118, 2008.
LIU, H.; ZHAO, P.; LU, P.; WANG, Y.S.; LIN, Y.B.; RAO, X.Q. Greenhouse gas fluxes from soils of different land-use types in a hilly area of south China. Agriculture, Ecosystems and Environment,
Amsterdam, v.124, n.1-2, p.125-135, 2008.
REICOSKY, D.C. Long-term effect of moldboard plowing on tillage-induced CO2 loss. In:
KIMBLE, J.M.; LAL, R. Agricultural practices and policies for carbon sequestration in soil. Boca
Raton: CRC Press, 2002. p.87-97.
REICOSKY, D.C.; ALLMARAS, R.R. Advances in tillage research in North American cropping systems. In: SHRESTHA, A. Cropping systems: trends and advances. New York: Haworth Press,
2003. p.75-125.
REICOSKY, D.C.; ARCHER, D.W. Moldboard plow tillage depth and short-term carbon dioxide release. Soil & Tillage Research, Amsterdam, v.94, p.109-121, 2007.
ROCHETTE, P.; ANGERS, D.A. Soil surface carbon dioxide fluxes induced by spring, summer and fall moldboard plowing in a sandy loam. Soil Science Society of America Journal, Madison,
SALOKHE, V.M.; RAMALINGAM, N. Effects of direction of rotation of a rotary tiller on properties of Bangkok clay soil. Soil Tillage Research, Amsterdam, v.63, p.65-74, 2001.
SAVAGE, K.E.; DAVIDSON, E.A. A comparison of manual and automaged systems for soil CO2
flux measurements: trade-offs between spatial and temporal resolution. Journal of Experimental Botany, Oxford, v.54, p.891-899, 2003.
SIX, J.; ELLIOTT, E.T.; PAUSTIAN, K. Aggregate and soil organic matter dynamics under conventional and no-tillage systems. Soil Science Society of America Journal, Madison, v.63,
p.1.350-1.358, 1999.