HESSD
6, 5537–5563, 2009Modelling field scale water partitioning
using on-site observations
H. Makurira et al.
Title Page
Abstract Introduction
Conclusions References
Tables Figures
◭ ◮
◭ ◮
Back Close
Full Screen / Esc
Printer-friendly Version
Interactive Discussion Hydrol. Earth Syst. Sci. Discuss., 6, 5537–5563, 2009
www.hydrol-earth-syst-sci-discuss.net/6/5537/2009/ © Author(s) 2009. This work is distributed under the Creative Commons Attribution 3.0 License.
Hydrology and Earth System Sciences Discussions
Papers published inHydrology and Earth System Sciences Discussionsare under open-access review for the journalHydrology and Earth System Sciences
Modelling field scale water partitioning
using on-site observations in
sub-Saharan rainfed agriculture
H. Makurira1,2,3, H. H. G. Savenije2,3, and S. Uhlenbrook2,3
1
Dept. of Civil Engineering, University of Zimbabwe. P. O. Box MP 167, Mt Pleasant, Harare, Zimbabwe
2
Water Resources Section, Delft University of Technology, P. O. Box 5048, 2600 GA Delft, The Netherlands
3
UNESCO-IHE, Institute for Water Education, P. O. Box 3015, 2601 DA Delft, The Netherlands
Received: 13 July 2009 – Accepted: 17 July 2009 – Published: 20 August 2009
Correspondence to: H. Makurira ([email protected])
HESSD
6, 5537–5563, 2009Modelling field scale water partitioning
using on-site observations
H. Makurira et al.
Title Page
Abstract Introduction
Conclusions References
Tables Figures
◭ ◮
◭ ◮
Back Close
Full Screen / Esc
Printer-friendly Version
Interactive Discussion
Abstract
Smallholder rainfed farming systems generally realise sub-optimal crop yields which are largely attributed to dry spell occurrences during crop growth stages. However, with improved farming practices, it seems possible to significantly increase yield levels even with little and highly variable rainfall. The presented results follow research
con-5
ducted in the Makanya catchment in northern Tanzania where gross rainfall amounts to less than 400 mm/season which is insufficient to support staple food crops (e.g. maize). Alternative cultivation techniques such as runoffharvesting and in-field micro-storage structures are compared. These techniques aim to reduce soil and nutrient loss from the field but, more importantly, promote in-field infiltration and water retention.
Wa-10
ter balance components have been observed in order to study water partitioning pro-cesses under different cultivation techniques. Based on rainfall, soil evaporation, tran-spiration, runoff and soil moisture measurements, a water balance model has been developed to simulate soil moisture variations over the growing season. It appears that about 50% of the diverted water leaves the root zone through deep percolation.
15
Modelling shows that during the field trials the average productive transpiration flow ranged between 1.1–1.4 mm d−1 in the trial plots compared to 0.7–1.0 mm d−1under
traditional tillage practice. Productive transpiration processes accounted for 23–29% while losses to deep percolation accounted for 33–48% of the available water. Conclu-sions from the research are that the innovations tested are effective in enhancing soil
20
HESSD
6, 5537–5563, 2009Modelling field scale water partitioning
using on-site observations
H. Makurira et al.
Title Page
Abstract Introduction
Conclusions References
Tables Figures
◭ ◮
◭ ◮
Back Close
Full Screen / Esc
Printer-friendly Version
Interactive Discussion
1 Introduction
The impact of climate variability and climate change is felt differently at different scales. In relation to food security, the effect of dry spell occurrences during critical cropping seasons as a result of erratic rainfall patterns results in severe yield reductions in farm-ing systems. In semi-arid environments, water is a major constraint to agricultural
5
production (e.g. Ngigi, 2003). This implies that farmers need to improve on current yield levels by adopting innovative rainwater harvesting and soil water conservation techniques (Rockstr ¨om, 2003; Rockstr ¨om et al., 2004). The big challenge now is that current levels are generally too low for existing food demands and average less than 1 t ha−1for maize in some semi-arid environments (Bhatt et al., 2006). Irrigation is
per-10
ceived to be the solution to the challenge of dry spells. Interestingly, irrigation is often viewed in the light of large scale organised systems with less attention paid to simple and cheap supplemental facilities for smallholder farming operations.
Rainwater harvesting systems with storage facilities are not common in Eastern and Southern Africa with the few micro-dams and ponds identified in arid and semi-arid
15
areas being poorly located for effective irrigation or, alternatively, being used for multi purposes (Rockstr ¨om, 2000). On the other hand, large scale and seemingly organised irrigation schemes require substantial investment costs and tend to benefit only few participating members. This means that the majority of the population, who, inciden-tally, rely mostly on rainfed subsistence agriculture, need to resort to simple and
inno-20
vative agricultural techniques for soil moisture retention in order to bridge the dry spells. In the past, when more unoccupied land was available, communities practiced shifting agriculture by relocating to less stressed and more fertile land resources (e.g. Fischer, 2008). Nowadays, local solutions which aim to optimize available resources are re-quired. Such solutions exist (Temesgen et al., 2007; Ngigi, 2007; Rockstr ¨om et al.,
25
HESSD
6, 5537–5563, 2009Modelling field scale water partitioning
using on-site observations
H. Makurira et al.
Title Page
Abstract Introduction
Conclusions References
Tables Figures
◭ ◮
◭ ◮
Back Close
Full Screen / Esc
Printer-friendly Version
Interactive Discussion different environments. However, the adoption of these solutions is not often
guaran-teed as social and traditional preferences tend to influence community behaviour. Rainfall variability in sub-Saharan Africa is very high with a diffrence of as much as 60 mm d−1 in rainfall recorded within a spatial distance of 10 km (Mul et al., 2008).
With the increasing climate variability which has seen an increasing trend in dry spells
5
in some parts of semi-arid Sub-Saharan Africa (Enfors and Gordon, 2007; Fischer, 2008) it is becoming a bigger challenge to improve or, at least, maintain the current crop yield levels. Instead, smallholder farmers, who constitute the greater proportion of the population, will increasingly rely on food imports as a result of these seasonal low yields. Given these challenges, it is important to assist smallholder farmers to break
10
the poverty cycle by relying less on food imports and encouraging them to adopt more efficient farming techniques which result in improved crop productivity under harsh climatic challenges. A number of improved agricultural techniques have been tested throughout the region with promises of success but the uptake by farmers has not been encouraging (Ngigi et al., 2005). One possible explanation for the poor adoption
15
by farmers could be that scientists themselves do not have full understanding of the water partitioning processes at field scale to explain how the tried techniques work.
However, it seems very well possible to improve crop productivity even under these challenging conditions. Many different techniques can be applied to achieve improved results and these largely depend on site conditions. An example of more efficient
20
improved techniques is thefanya juu cultivation method which, if used in combination with runoffharvesting, results in improved soil moisture availability. Thefanya juushave been researched before as soil conservation structures (Tenge et al., 2005; Mwangi et al., 2001; Gichuki, 2000) but the hydrological impacts on cropping systems have not been investigated in detail.
25
HESSD
6, 5537–5563, 2009Modelling field scale water partitioning
using on-site observations
H. Makurira et al.
Title Page
Abstract Introduction
Conclusions References
Tables Figures
◭ ◮
◭ ◮
Back Close
Full Screen / Esc
Printer-friendly Version
Interactive Discussion
2 Materials and methods
2.1 Research site
The research has been conducted in the Makanya catchment in northern Tanzania (Fig. 1) at two sites. These sites, Site 1 (Iddi farm) and Site 2 (Walter farm) are located in the Mwembe village within the Makanya catchment. The Makanya catchment is
5
part of the Pangani Basin and covers a catchment area of about 300 km2 (Mul et al., 2007). The rainfall variability is high and ranges between 500–800 mm a−1 and is
heavily influenced by altitude. Two rainfall seasons are experienced in a year with the long rainfall season (Masika) occurring between March and May while the short rainfall season (Vuli) occurs anytime between October and December. The annual rainfall
10
received is thus split over two agricultural seasons which implies that, on average, seasonal rainfall alone cannot support the common crops grown in the area such as maize, beans and coffee (Mutiro et al., 2006). An analysis of the rainfall patterns at a nearby station suggests a steady mean in the total amount of rainfall received but an increasing trend in dry spell occurrences especially in theMasikaseason (Enfors and
15
Gordon, 2007).
The local communities in the catchment rely on subsistence agriculture for food pro-duction. The terrain changes dramatically from mountainous in the upper part of the catchment to midlands and, finally, flatter lowlands at the downstream end of the catch-ment. The population settled in higher altitudes enjoy a wetter climate hence have more
20
food security. The midland area is drier with farming activities relying on stream flow diversions either directly into cultivated plots or, as is often the case, into micro dams for temporary storage and into micro dams for supplemental irrigation. More than 100 diversion canals and 70 micro-dams have been identified in the Makanya catchment. However, where supplemental irrigation facilities exist, especially at community scales,
25
HESSD
6, 5537–5563, 2009Modelling field scale water partitioning
using on-site observations
H. Makurira et al.
Title Page
Abstract Introduction
Conclusions References
Tables Figures
◭ ◮
◭ ◮
Back Close
Full Screen / Esc
Printer-friendly Version
Interactive Discussion an organised water sharing scheme from a common river (Komakech et al., 2008).
The lowlands hardly receive any rains. Inconsistent and low river flows and the ab-sence of a water allocation arrangement with upstream users imply that the lowlands rely mainly on extreme flood events which cannot be absorbed upstream. Such flood events, though few in a season, usually last a few days and bring with them nutrient
5
rich water which the lowland farmers share as spate irrigation only during the events. A variety of soil and water conservation practices is observed within the study area and these include hand-hoeing, terracing, inter-cropping, rainwater harvesting (par-ticularly flow diversions) and irrigation from micro-dams. Groundwater exploitation is low with substantial amounts of surface water infiltrating into the ground and, possibly,
10
draining out of the catchment as sub-surface flow (Mul et al., 2007).
2.2 Experimental setup
The research compares current farming practices of hand-hoe cultivation against newly introduced conservation tillage practices in combination with water harvesting, in par-ticular thefanya juu and flood water diversion. The fanya juus are basically trenches
15
constructed across the cultivated fields. The soil from the excavation is thrown upslope of the trench to form a bund upstream of the trench. The trenches therefore act as temporary storage structures after rainfall events while the bunds create a ponding en-vironment. Infiltration potential is enhanced in the trenches and at the ponding zones as a result of increased residence time of water. In addition, the reduction in runoff
20
velocity within the cultivated field implies increased potential for deposition of nutrient rich finer material within the cultivated plots.
The research took a participatory approach with selected resident smallholder farm-ers. This approach is more sustainable from an uptake point of view as well as sharing science and indigenous knowledge systems with locals (Mirghani and Savenije, 1995).
25
HESSD
6, 5537–5563, 2009Modelling field scale water partitioning
using on-site observations
H. Makurira et al.
Title Page
Abstract Introduction
Conclusions References
Tables Figures
◭ ◮
◭ ◮
Back Close
Full Screen / Esc
Printer-friendly Version
Interactive Discussion
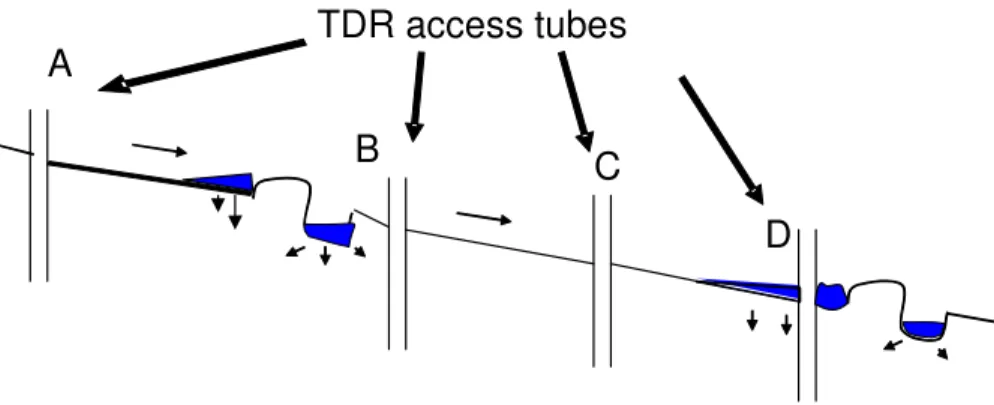
2.3 Soil moisture measurements
To evaluate the effect of different treatment techniques, soil moisture has been mea-sured by use of time domain reflectometry (TDR). Four access tubes have been in-serted into the ground using a hand auger. Tube A was placed in the control plot i.e. the section within the same file but upstream of the diversions which is supplied
5
by rainfall only. The other three tubes have been placed within one cultivated strip but located such that Tube B is closest to the trench, Tube C in the middle of the cultivated strip and Tube C at the lower end of the strip and closest to the bunds. From Fig. 2 it can be seen that Tube B monitors the impact to the root zone of water stored in the trench while Tube D monitors the effect of ponded water as a result of the bund. Tube
10
C monitors if there is uniformity in the moisture distribution across the cultivated strip. Soil moisture observations were made twice a week during the growing and once in two weeks during the dry seasons.
2.4 Water balance modelling
Soil moisture storage has been modelled using a spreadsheet based water balance
15
model (based on Savenije, 1997). The model is defined by the following equation: d Su
d t + d Ss
d t =P −ET −EI−Es−Rg−Qs (1) where (all in mm d−1),
P is the precipitation received on the system,
ET is the transpiration,
20
EI is the evaporation from interception i.e. from canopy cover and soil surface,
Esis the evaporation from the soil,
Qs is the net surface flow runoff,
Rgis the recharge into the groundwater, d Su
d t is the rate of change of water storage in the root zone, and
HESSD
6, 5537–5563, 2009Modelling field scale water partitioning
using on-site observations
H. Makurira et al.
Title Page
Abstract Introduction
Conclusions References
Tables Figures
◭ ◮
◭ ◮
Back Close
Full Screen / Esc
Printer-friendly Version
Interactive Discussion d Ss
d t is the rate of change of surface water storage.
The components in the above equation can be determined from direct observations or, alternatively, from empirical relationships.
During the field trials,PandQs were measured on site. At the daily time scale used, d Ss
d t is considered to be negligible compared to the other fluxes. The transpiration and
5
soil evaporation (ET andEs,) have been modelled as a function of the soil moistureSu. The interception,EI, has been determined on the basis of the daily rainfall following the method by De Groen and Savenije (2006). These methods are described below. As a result, the soil moisture storage in the unsaturated zone,Su, remains the only unknown in the equation. The calculated soil moisture storage is subsequently compared with
10
the observed soil moisture variations.
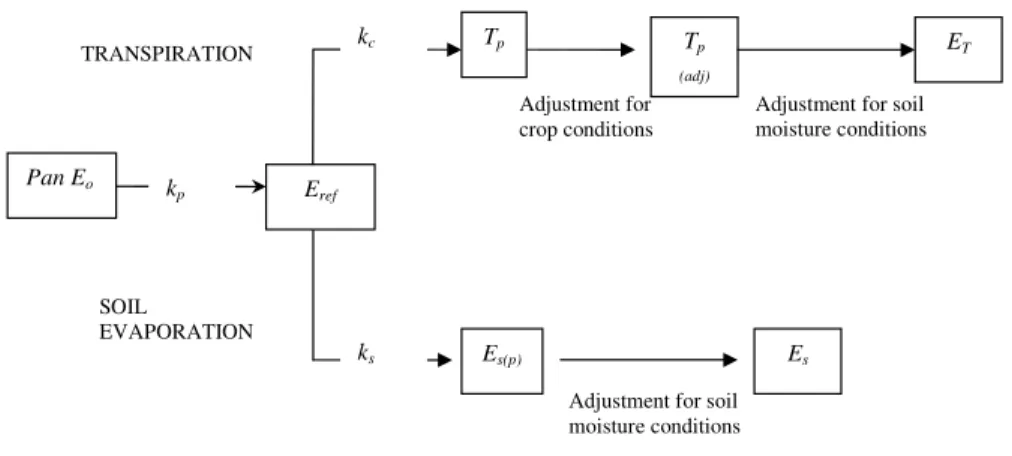
2.4.1 Estimation of model inputs
The modelling approach taken is based on the FAO-56 dual crop coefficient method which separates evaporation and transpiration processes. Figure 3 shows a flow chart illustrating the adapted method.
15
Input parameters have been estimated according to the processes explained below (Temesgen et al., 2007; Allen et al., 2005; Allen et al., 1998; Savenije, 1997).
Precipitation (P) has been measured using a tipping bucket rain gauge on site and the data was aggregated to daily time intervals.
Estimation of runoffcontribution(Qs)
20
Runoff has been directed onto the experimental plots through one point and has been allowed out through one exit point. Tipping bucket loggers have been installed to measure surface flow into and out of the study plot. The difference between inflow and outflow is the net surface flow contribution,Qs.
Estimation of interception(EI)
25
Interception has been calculated as
HESSD
6, 5537–5563, 2009Modelling field scale water partitioning
using on-site observations
H. Makurira et al.
Title Page
Abstract Introduction
Conclusions References
Tables Figures
◭ ◮
◭ ◮
Back Close
Full Screen / Esc
Printer-friendly Version
Interactive Discussion where (all in mm d−1)
EI evaporation from interception,
P rainfall
Dinterception threshold determined by calibration (ranges between 2–5 mm d−1)
Open water evaporation
5
Daily open water evaporation,Eo, was measured using a Class A pan located at a nearby meteorological station. The evaporation was determined from the measured volume required to top up the water level at a set time every day.
Reference evaporation
The reference evaporation,Eref, was estimated from the FAO recommended
meth-10
ods of estimating transpiration (Allen et al., 1998) i.e.
Eref =Eokp (3)
where
Erefreference evaporation (mm d− 1
)
Eoopen water evaporation (mm d−1)
15
kp pan coefficient (–), ranges between 0.6–0.8 for the conditions in study the area (according to FAO-56)
Transpiration
Potential transpiration, Tp
A growing crop under optimum conditions transpires at the potential transpiration
20
rate,Tp. This potential transpiration is related to the reference transpiration by a crop transpiration factor,kc, which is a function of the crop type and its development stage.
The potential transpiration for any crop is therefore calculated as
Tp=(Erefkc) (4)
where
25
Tppotential transpiration (mm d−
1
HESSD
6, 5537–5563, 2009Modelling field scale water partitioning
using on-site observations
H. Makurira et al.
Title Page
Abstract Introduction
Conclusions References
Tables Figures
◭ ◮
◭ ◮
Back Close
Full Screen / Esc
Printer-friendly Version
Interactive Discussion
kc crop factor (–) and ranges between 0.15–1.15 for maize crop (according to FAO-56)
Equation 4 applies to a crop growing under ideal conditions. The natural environment necessitates a further adjustment of kc to suit local conditions (Allen, 2000). When there is no moisture stress transpiration is assumed to be related to the leaf area index,
5
ILA, (Temesgen et al., 2007). The modified potential transpiration is hence calculated as
Tp=max ((Trefkc−EI),0) min (1, ILA) (5) where
Tppotential transpiration (mm d−
1
)
10
ILAleaf area index (m
2
m−2)
Actual transpiration from a crop, ET
Tp described in Eq. (5) assumes unlimited water availability within the root zone. In practice, however, soil moisture varies within the available water content (AWC) range described as the difference between the field capacity and the permanent wilting
15
point. Potential transpiration occurs between saturated moisture conditions until the moisture content drops to a fractionp (taken as 0.6) of AWC when stress conditions start to occur. Transpiration stops when the soil moisture level drops to the permanent wilting point. Within the soil moisture range (1−p)(Sf c−Swp) transpiration is reduced according to proportions defined by the gradientkdefined as
20
k= 1
(1−p) Sf c−Swp
(6)
where
k moisture stress gradient (mm−1)
Sf csoil moisture at field capacity (mm)
Swp soil moisture at wilting point (mm)
HESSD
6, 5537–5563, 2009Modelling field scale water partitioning
using on-site observations
H. Makurira et al.
Title Page
Abstract Introduction
Conclusions References
Tables Figures
◭ ◮
◭ ◮
Back Close
Full Screen / Esc
Printer-friendly Version
Interactive Discussion The moisture stress factor limiting transpiration can therefore be expressed as
fmt=kmin Su−Swp
,1
(7) where
fmt moisture stress factor (-)
Susoil moisture within the root zone (mm)
5
The actual transpiration,ET(mm d−
1
),is given by the relationship
ET =Tpfmt (8)
Soil evaporation,Es
The energy available at the soil surface is shared between transpiration and direct soil evaporation (Allen, 2000). Where water is in abundance climatic influences play a
10
less significant role towards transpiration rates (Nov ´ak et al., 2005). As canopy cover increases more energy is used for transpiration at the expense of direct soil evapora-tion. Similar to transpiration, soil evaporation only occurs at the potential rate under ideal conditions including sufficient soil moisture. However, unlike transpiration pro-cesses where transpiration occurs at reduced rates up to the wilting point, the cut-off
15
level for soil evaporation occurs before the wilting point due to capillary forces of the soil matrix.
The soil moisture stress factor can be described by an exponential function involving
Suand the maximum water available within the root zone (Smax) with a reduction scale
b(mm):
20
fms =min
exp
S
u−Smax
b
,1
where
fms moisture stress reduction factor (-)
HESSD
6, 5537–5563, 2009Modelling field scale water partitioning
using on-site observations
H. Makurira et al.
Title Page
Abstract Introduction
Conclusions References
Tables Figures
◭ ◮
◭ ◮
Back Close
Full Screen / Esc
Printer-friendly Version
Interactive Discussion The evaporation from the soil is given by
Es =max(1−ILA,0) max (ksEref−EI,0)fms where
Essoil evaporation (mm d−
1
)
ks soil evaporation factor (equivalent to crop factor in cropped areas) (–)
5
In Eq. (9), interception is subtracted from reference evaporation because both are evaporation processes with evaporation from interception occurring immediately after a rainfall event as canopy interception or evaporation from the top soil.
Estimation of infiltration,F
At daily time steps, whered Ss
d t is considered negligible, the infiltration into the soil
10
F(mm d−1) is calculated as
F =P +Qs−EI
The soil moisture balance at any given time-steptis hence calculated as
St=St
−1+(F −ET −Es−R)∆t
where deep percolation,R (mm d−1), is calculated as
15
R=max
S
t−Sf c
kR ,0
HESSD
6, 5537–5563, 2009Modelling field scale water partitioning
using on-site observations
H. Makurira et al.
Title Page
Abstract Introduction
Conclusions References
Tables Figures
◭ ◮
◭ ◮
Back Close
Full Screen / Esc
Printer-friendly Version
Interactive Discussion
3 Results
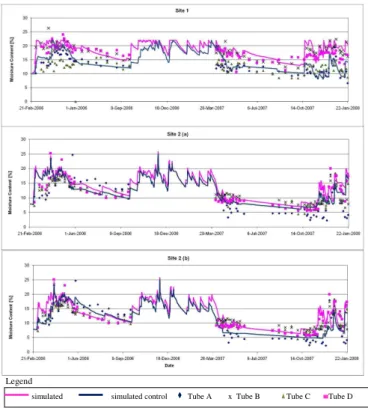
3.1 Soil moisture observations
Soil moisture measurements over four seasons are shown in Fig. 3 and have been used as a measure of the performance of the water balance model. The observed soil moisture shows a clear trend where the tube located on the most downstream part and
5
next to the bund (Tube D) records the highest moisture levels. The control tube (Tube A) records the least moisture levels which are also comparable to the middle tube (Tube C). Tube B records values in between. This trend is more distinct at Site 1 where the terrain is gentler and the soils are deeper. Site 2 has steeper slopes and shallower soil depths. The moisture distribution at Site 2 exhibits a similar trend described above
10
although the control tube and Tube B appear to respond more quickly to rainfall and diversion events. The middle tube, Tube C, also records better response to events at Site 2 than at Site 1.
3.2 Soil moisture modelling
The spreadsheet based water balance model has been developed as described above.
15
The model simulates soil moisture on a daily time step. Each simulation calculates soil moisture for the control and the experimental site with the difference being that the experimental site allows extra water from diversions while the control is strictly rainfed. The output is plotted in Fig. 4 where the solid lines indicate the simulated soil mois-ture. The results show a good relationship with the observed soil moisture for both the
20
control and the site benefitting from diverted water. The modelled results for diverted flow correspond well with the downstream tube (Tube D), while the simulation with no diversion corresponds well with the control (Tube A). The difference between the con-trol and experimental lines indicates the impact of the diversion technique. The biggest difference occurs at the beginning of the season and is lowest when enough rainfall is
25
HESSD
6, 5537–5563, 2009Modelling field scale water partitioning
using on-site observations
H. Makurira et al.
Title Page
Abstract Introduction
Conclusions References
Tables Figures
◭ ◮
◭ ◮
Back Close
Full Screen / Esc
Printer-friendly Version
Interactive Discussion shows that the soil reaches field capacity much earlier than the control section at the
onset of the rainy season. This is important since it allows the growing season to start earlier.
3.2.1 Improving model performance
In Figure 3, Site 1 shows better agreement between observed and simulated soil
mois-5
ture levels. Site 2 (a) however shows some disagreement especially at the onset of the experiment where simulated values are much higher than the observed. This is ex-plained by the fact that the experimental plot may not have been prepared well enough hence less infiltration actually occurred. The model was improved by lowering the field capacity during the first few days of experimentation thereby restricting infiltration
af-10
ter rainfall events. Thereafter, and for the rest of the season, the control plot recorded higher moisture levels as it benefitted from lateral flows from upstream. Similarly, during the dry season prior to November 2007, a few rainfall events were observed which were translated into infiltration in the simulation. Consequently, simulated results were much higher than the observed. However, since the previous rainfall season had recorded
15
extended dry spells towards the end, the soils were in fact much drier hence, again, the rainfall could not practically be translated into infiltration. The model was corrected by draining this infiltrated water during the dry season.
The improved model is shown as Site 2 (b) in Fig. 4 and shows a much better corre-spondence between modelled and observed values.
20
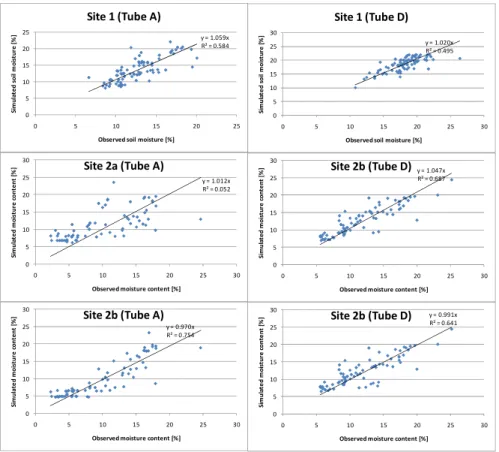
3.2.2 Test of model efficiency
Figure 5 shows a comparison of the modelled and observed results with the graph forced to pass through the origin. In all cases, the simulation for Tube D shows a better fit than the control. This is also confirmed by the Root Mean Square Error (RMSE) calculation of 3.3 and 1.9 at Site 1 for Tube A and Tube D, respectively. At Site 2
25
HESSD
6, 5537–5563, 2009Modelling field scale water partitioning
using on-site observations
H. Makurira et al.
Title Page
Abstract Introduction
Conclusions References
Tables Figures
◭ ◮
◭ ◮
Back Close
Full Screen / Esc
Printer-friendly Version
Interactive Discussion increased from 2.3 to 2.4 for Tube D. This also shows that the model improvement was
most efficient in the control plot.
3.3 Water balances
The total amount of water received at field scale is due to the rainfall (P) and runoff
diversion (Qs).This water is partitioned into transpiration (ET), interception (EI), soil
5
evaporation (Es), deep percolation (R) and soil moisture storage variation (dSu/dt). Table 1 shows the average daily water partitioning for the combined cropping seasons At Site 1, the volume of water diverted surpasses the rainfall received while at Site 2, the runoffcontribution is about 30% of rainfall received. Deep percolation accounts for the largest proportion of the partitioned water.
10
For the combined seasons, at Site 1, transpiration increased from an average of 1 mm d−1 to 1.4 mm d−1 (range 0.86–1.9 mm d−1) as a result of the improved
agri-cultural techniques. At Site 2, the average transpiration increased from 0.7 mm d−1to
1.1 mm d−1 (range 0.37–1.26 mm d−1). Despite an increase in transpiration values,
deep percolation accounts for almost 50% of the diverted water at both sites.
15
4 Analysis and discussion of results
The findings prove that the introduced techniques result in increased moisture avail-ability in the study plots and, hence, successfully serve their purpose of demonstrating that there is, indeed, scope for improved productivity if dry spell management is im-proved. More moisture in the root zone leads to increased potential for transpiration
20
and, hence, biomass production. The lower moisture levels in the control section can be explained by the fact that the control section, because it is entirely rainfed, has less water available to infiltrate. The traditional cultivation technique of using the hand hoe does not promote infiltration and, on the contrary, creates a hard pan on the soil in the long run and opens the soil for evaporation (Rockstr ¨om et al., 2001). On the other
HESSD
6, 5537–5563, 2009Modelling field scale water partitioning
using on-site observations
H. Makurira et al.
Title Page
Abstract Introduction
Conclusions References
Tables Figures
◭ ◮
◭ ◮
Back Close
Full Screen / Esc
Printer-friendly Version
Interactive Discussion hand, the trenches created improve the potential for infiltration. In the section with
the “improved” techniques, the moisture distribution varies over the plot. The highest soil moisture levels are observed near the soil bunds (around Tube D) where more residence time for water allows more infiltration to occur. This ponding effect also in-creases the chances of deposition of nutrient-rich fine sediment which also benefits the
5
crop, and protects downstream systems from too high nutrient inputs. The difference in moisture levels at Tubes B, C and D can further be attributed to the effect of slope. At Site 1, where the slope is flatter and the soils are deeper, more infiltration and vertical drainage occurred resulting in the tube next to the trench (Tube B) not responding as much to the diversion as at Site 2. At Site 2 the middle tube, Tube C, recorded soil
10
moisture values which are similar to the control tube suggesting that the moisture that infiltrates in thefanya juus does not reach the centre of the plot, but is evacuated later-ally by sub-surface drainage. This suggests that the spacing between trenches should be further reduced in steeper slopes to values much less than those recommended for soil conservation.
15
The model results show the positive effects of the tested diversions. The diversions and temporary in-field storage structures shorten the time it takes to attain sufficient moisture levels for germination, thus effectively lengthening the growing season. This means that crops grown under the adjusted farming conditions have a longer growing season, less chance of suffering from moisture stress during dry spells and, hence,
20
stand a better change of obtaining higher yields compared to traditional practice. Grain yield increases of more than threefold have been recorded under these improved farm-ing systems (Makurira et al., 2009). At Site 1, the difference in moisture availability between control conditions and tested techniques is much higher than at the other site due to the fact that the diversion potential is much higher at Site 1 and, also, the gentler
25
slope at Site 1 promotes more water retention than at Site 2.
HESSD
6, 5537–5563, 2009Modelling field scale water partitioning
using on-site observations
H. Makurira et al.
Title Page
Abstract Introduction
Conclusions References
Tables Figures
◭ ◮
◭ ◮
Back Close
Full Screen / Esc
Printer-friendly Version
Interactive Discussion season crops have proved a success and provide additional food in the dry season.
The water balance analysis shows that the effect of the diversion is also a function of slope and soil depth. Steeper slopes result in more runofffrom the system through lateral flow. Diversions result in more water available for productive purposes but the proportion of water attributed to deep percolation also demonstrates the fact that in
5
these situations, where rainfall and runoffevents are of short duration, the generated flow cannot all be absorbed in the root zone within such short periods. In this case, the trenches obviously do not offer sufficient storage to regulate the release of water into the root zone when required. Rockstr ¨om et al. (1998) also showed that non-productive purposes (evaporation and deep percolation) can easily account for more than 50% of
10
the available water.
5 Conclusions
With rainfall of less than 400 mm/season it is very clear that rainfall alone is not suffi -cient to support common food crops (e.g. maize) in the study area. The existing cultiva-tion techniques are not efficient enough to cope with the frequent dry spells hence the
15
need for more efficient approaches is obvious. The tested techniques offanya juus in combination with storm water diversion have demonstrated the potential to significantly improve the soil moisture availability within cultivated plots.
The tested techniques have been modelled successfully and it has been shown that the advantage of the tested technique is that it allows for the growing season to start
20
early and contributes towards dry spell mitigation by raising soil moisture levels. It has also been demonstrated that the biggest impact of thefanya juuterracing in combina-tion with diversions is through ponded water around the soil bunds. Where soils are not deep and with steeper slopes, the findings show that the water in the trenches is trans-ferred to sub-surface lateral flow which is not available to the crop. Since the trenches
25
HESSD
6, 5537–5563, 2009Modelling field scale water partitioning
using on-site observations
H. Makurira et al.
Title Page
Abstract Introduction
Conclusions References
Tables Figures
◭ ◮
◭ ◮
Back Close
Full Screen / Esc
Printer-friendly Version
Interactive Discussion spacing between the bunds and the trenches should be less than that recommended
for soil conservation purposes.
The tested techniques allow for higher moisture levels even in the dry season which is an advantage especially for the longer season alternative crops (such as bananas, pawpaws, fodder and cassava) which are grown in the trench and at the bunds.
How-5
ever, the general decline in soil moisture levels throughout the dry season as a result of soil evaporation implies that valuable soil moisture is lost through soil evaporation during the dry season. If conserved, the moisture level at the close of the growing season could provide a better starting point at the beginning of the following season. A way of minimising dry season evaporation can significantly benefit the performance
10
of the subsequent season. Future research should focus on investigating different land management techniques (e.g. different ploughing techniques, or reducing bare soil evaporation by introducing a canopy, Wallace, 1999) to reduce moisture losses through soil evaporation during the dry seasons.
The high proportion of water entering the deep percolation zone suggests that there
15
is still inefficient utilisation of harvested water at the investigated field plots. In hydrolog-ical terms this is not a loss as this water would most likely be used further downstream. However, at local scales, this demonstrates that the in-field temporary storages cre-ated cannot cope with the genercre-ated volumes of water and do not allow for regulcre-ated release of water into the root zone when required. This suggests the tested techniques
20
can perform even better when used in combination with storage systems for more eff ec-tive dry spell management. Future investigation should focus on the tested techniques in combination with micro dams and/or storage tanks from rainwater harvesting. Acknowledgements. The work reported here was undertaken as part of the Smallholder Sys-tem Innovations in Integrated Watershed Management (SSI) Programme funded by the Nether-25
HESSD
6, 5537–5563, 2009Modelling field scale water partitioning
using on-site observations
H. Makurira et al.
Title Page
Abstract Introduction
Conclusions References
Tables Figures
◭ ◮
◭ ◮
Back Close
Full Screen / Esc
Printer-friendly Version
Interactive Discussion
References
Allen, R., Pereira, L., Smith, M., Raes, D., and Wright, J.: Crop Evapotranspiration: Guidelines for computing crop water requirements, FAO Irrigation and Drainage Paper No 56., Rome, Italy, 1998.
Allen, R., Pereira, L., Smith, M., Raes, D., and Wright, J.: FAO-56 Dual Crop Coefficient Method 5
for Estimating Evaporation from Soil and Application Extensions, J. Irrig. Drain. E., Jan/Feb 2005.
Allen, R.G.: Using the FAO-56 dual crop coefficient method over an irrigated region as part of evapotranspiration intercomparison study. J. Hydrol., 229 pp, 27–41, 2000.
Bhatt, Y., Bossio, D., Enfors, E., Gordon, L., Kongo, V., Kosgei, J. R., Makurira, H., Masuki, 10
K., Mul, M., Tumbo, S. D.: Smallholder System Innovations in Integrated Watershed Man-agement (SSI): Strategies of water for food and environmental security in drought-prone tropical agro-ecosystems: Colombo, Sri Lanka: International Water Management Institute, 59p., IWMI working paper 1009; SSI Working Paper 1, 2006.
De Groen, M. M. and Savenije, H. H. G.: A monthly interception equation based on the statisti-15
cal characteristics of daily rainfall, Water Resour. Res., 42, W12417, 1–10, 2006.
Enfors, E. and Gordon, L.: Analyzing resilience in dryland agro-ecosystems: A case study of the Makanya catchment in Tanzania over the past 50 years, Land degradation and develop-ment, 18, 680–696, 2007.
Fischer, B. M. C.: Spatial variability of dry spells – A spatial and temporal rainfall analysis of 20
the Pangani Basin and Makanya catchments, Tanzania, MSc Thesis, TU Delft, 2008. Gichuki, F. N.: Mokueni District Profile: Soil Management and Conservation, Drylands
Re-search Working Paper No. 4, 2000.
Komakech, C.H, Van der Zaag, P., Jonoski, A., and Van koppen, B.: Can actor-network the-ory help to understand water-sharing practices in Makanya catchment, Tanzania? Paper 25
presented at WaterNet conference Johannesburg, South Africa, October 2008.
Makurira, H., Mul, M. L., Vyagusa, N. F., Uhlenbrook, S., Savenije, H. H. G.: Evaluation of community-driven smallholder irrigation in dryland South Pare Mountains, Tanzania: A case study of Manoo micro dam, Phys. Chem. Earth, 32, 1090–1097, 2007.
Makurira, H., Savenije, H. H. G., Uhlenbrook, S., Rockstr ¨om, J., Senzanje, A.: The effect of 30
HESSD
6, 5537–5563, 2009Modelling field scale water partitioning
using on-site observations
H. Makurira et al.
Title Page
Abstract Introduction
Conclusions References
Tables Figures
◭ ◮
◭ ◮
Back Close
Full Screen / Esc
Printer-friendly Version
Interactive Discussion
Mirghani, M. M. O. and Savenije, H. H. G.: “Incorporation of People’s Participation in Planning and Implementation of Water Resources Projects”, Phys. Chem. Earth, Vol. 20, No.3–4, 229–236, Elsevier Science Ltd., Pergamon, Exeter, UK, 1995.
Mul, M. L, Mutiibwa, R. K., Foppen, J. W. A., Uhlenbrook, S., Savenije, H. H. G.: Identification of groundwater flow systems using geological mapping and chemical spring analysis in South 5
Pare Mountains, Tanzania, Phys. Chem. Earth, 32, 1015–1022, 2007.
Mul, M. L., Savenije, H. H. G., and Uhlenbrook, S.: Spatial rainfall variability and runoffresponse during an extreme event in a semi-arid catchment in the South Pare Mountains, Tanzania, Hydrol. Earth System Sci. Discuss., 5, 2657–2685, 2008.
Mutiro, J., Makurira, H., Senzanje, A., and Mul, M. L.: Water productivity analysis for small-10
holder rainfed systems: a case study of Makanya catchment, Tanzania, Phys. Chem. Earth, 31, 901–909, 2006.
Ngigi, S. N., Savenije, H. H. G., and Gichuki, F. N.: Land use changes and hydrological impacts related to up-scaling of rainwater harvesting and management in upper Ewasco Ng’rio river basin, Kenya, Land use Policy, 24, 129–140, 2007.
15
Ngigi, S. N., Savenije, H. H. G., Thome, J. N., Rockstrom, J., and Penning de Vries, F. W. T.: Agro-hydrological evaluation of on-farm rainwater storage systems for supplemental irrigation in Laikipia district, Kenya, Agric. Water Manage., 73, 21–41, 2005.
Rockstr¨om, J.: Water resources management in smallholder farms in Eastern and Southern Africa: An overview, Phys. Chem. Earth, 25, 275–283, 2000.
20
Rockstr ¨om, J., Kaumbutho, P., Mwalley, P., and Temesgen, M. Conservation farming among smallholder farmers in E.Africa: Adapting and adopting innovative land management options. 1st World Congress on Conservation Agriculture, 363–373, 2001.
Rockstr ¨om, J.: Water for food and nature in drought-prone tropics: vapour shift in rainfed agri-culture, The Royal Society, 1997–2009, 2003.
25
Rockstr ¨om, J., Folke, C., Gordon, L., Hatibu, N., Jewitt, G., de Vries, F.P., Rwehumbiza, F., Sally, H., Savenije, H., Schulze, R.: A watershed approach to upgrade rainfed agriculture in water scarce regions through Water System Innovations: an integrated research initiative on water for food and rural livelihoods in balance with ecosystem functions, Phys. Chem. Earth, 29 (15–18), 1109–1118, 2004.
30
Savenije, H. H. G.: “Determination of evaporation from a catchment water balance at a monthly time scale”, Hydrol. Earth Syst. Sci, Vol 1, No. 1, 93–100, 1997.
HESSD
6, 5537–5563, 2009Modelling field scale water partitioning
using on-site observations
H. Makurira et al.
Title Page
Abstract Introduction
Conclusions References
Tables Figures
◭ ◮
◭ ◮
Back Close
Full Screen / Esc
Printer-friendly Version
Interactive Discussion
tillage systems for maize production in semi-arid Ethiopia: effects on grain yield and water balance. Hydrol. Earth Syst. Sci. Dis., 4, 2229–2271, 2007.
Tenge, A. J. M., De Graaff, J., and Hella, J. P.: Financial efficiency of major soil and wa-ter conservation measures in West Usambara highlands, Tanzania, Applied Geography, 25, 348–366, 2005.
5
Wallace, J. S., Jackson, N. A., and Ong, C. K.: Modelling soil evaporation in an agroforestry system in Kenya, Agricultural and Forestry Meteorology (94). Pp 189-202.Nov ´ak, V., Hur-talov ´a, T., and Matejka, F., 2005. Predicting the effects of soil water content and soil water potential on transpiration of maize. J. Agr. Water Manage., 76, 211–223, 1999.
HESSD
6, 5537–5563, 2009Modelling field scale water partitioning
using on-site observations
H. Makurira et al.
Title Page
Abstract Introduction
Conclusions References
Tables Figures
◭ ◮
◭ ◮
Back Close
Full Screen / Esc
Printer-friendly Version
Interactive Discussion
Table 1.Water partitioning for “with” and “without” diversion (mm d−1).
P Qs Total ET EI Es Rg d Su
d t Total
inflows outflows
Site 1
with 2.1 2.7 4.8 1.4 0.7 0.2 2.3 0.2 4.8
without 2.1 0 2.1 1.0 0.7 0.1 0.2 0.1 2.1
Site 2
with 2.8 1.0 3.8 1.1 0.7 0.2 1.6 0.2 3.8
HESSD
6, 5537–5563, 2009Modelling field scale water partitioning
using on-site observations
H. Makurira et al.
Title Page
Abstract Introduction
Conclusions References
Tables Figures
◭ ◮
◭ ◮
Back Close
Full Screen / Esc
Printer-friendly Version
Interactive Discussion
Fig. 1. Location of the study areas in the Mwembe sub-catchment of the Makanya catchment
HESSD
6, 5537–5563, 2009Modelling field scale water partitioning
using on-site observations
H. Makurira et al.
Title Page
Abstract Introduction
Conclusions References
Tables Figures
◭ ◮
◭ ◮
Back Close
Full Screen / Esc
Printer-friendly Version
Interactive Discussion
TDR access tubes
A
C
D
B
HESSD
6, 5537–5563, 2009Modelling field scale water partitioning
using on-site observations
H. Makurira et al.
Title Page
Abstract Introduction
Conclusions References
Tables Figures
◭ ◮
◭ ◮
Back Close
Full Screen / Esc
Printer-friendly Version
Interactive Discussion Adjustment for soil
moisture conditions Adjustment for
crop conditions
SOIL
EVAPORATION
kp Eref
kc Tp Tp
(adj)
ET
TRANSPIRATION
ks Es(p)
Pan Eo
Adjustment for soil moisture conditions
Es
HESSD
6, 5537–5563, 2009Modelling field scale water partitioning
using on-site observations
H. Makurira et al.
Title Page
Abstract Introduction
Conclusions References
Tables Figures
◭ ◮
◭ ◮
Back Close
Full Screen / Esc
Printer-friendly Version
Interactive Discussion Legend
simulated simulated control Tube A x Tube B Tube C Tube D
HESSD
6, 5537–5563, 2009Modelling field scale water partitioning
using on-site observations
H. Makurira et al.
Title Page Abstract Introduction Conclusions References Tables Figures ◭ ◮ ◭ ◮ Back Close
Full Screen / Esc
Printer-friendly Version
Interactive Discussion
y = 1.012x R² = 0.052
0 5 10 15 20 25 30
0 5 10 15 20 25 30
S im u la te d m o is tu re c o n te n t [% ]
Observed moisture content [%]
Site 2a (Tube A) y = 1.047x
R² = 0.687
0 5 10 15 20 25 30
0 5 10 15 20 25 30
S im u la te d m o is tu re c o n te n t [% ]
Observed moisture content [%]
Site 2b (Tube D)
y = 0.970x R² = 0.754
0 5 10 15 20 25 30
0 5 10 15 20 25 30
S im u la te d m o is tu re c o n te n t [% ]
Observed moisture content [%]
Site 2b (Tube A) y = 0.991x
R² = 0.641
0 5 10 15 20 25 30
0 5 10 15 20 25 30
S im u la te d m o is tu re c o n te n t [% ]
Observed moisture content [%]
Site 2b (Tube D)
y = 1.020x R² = 0.495
0 5 10 15 20 25 30
0 5 10 15 20 25 30
S im u la te d s o il m o is tu re [ % ]
Observed soil moisture [%]
Site 1 (Tube D)
y = 1.059x R² = 0.584
0 5 10 15 20 25
0 5 10 15 20 25
S im u la te d s o il m o is tu re [ % ]
Observed soil moisture [%]
Site 1 (Tube A)