Generation and Standardized, Systemic
Phenotypic Analysis of
Pou3f3
L423P
Mutant
Mice
Sudhir Kumar1, Birgit Rathkolb1, Elisabeth Kemter1, Sibylle Sabrautzki2,3, Dian Michel2, Thure Adler2,4, Lore Becker2, Johannes Beckers2,3,5, Dirk H. Busch4, Lillian Garrett6,
Wolfgang Hans2,3, Sabine M. Hölter6, Marion Horsch2, Martin Klingenspor7,
Thomas Klopstock8,9, Ildikó Rácz10, Jan Rozman2,3,7, Ingrid Liliana Vargas Panesso2,8,9,
Alexandra Vernaleken2,8, Andreas Zimmer10, Helmut Fuchs2,3, Valérie Gailus-Durner2,3, Martin Hraběde Angelis2,3,5,9, Eckhard Wolf1, Bernhard Aigner1
*
1Chair for Molecular Animal Breeding and Biotechnology, and Laboratory for Functional Genome Analysis (LAFUGA), Gene Center, LMU Munich, 81377, Munich, Germany,2German Mouse Clinic, Institute of Experimental Genetics, Helmholtz Zentrum München, German Research Center for Environmental Health, 85764, Neuherberg, Germany,3Member of German Center for Diabetes Research (DZD), 85764, Neuherberg, Germany,4Institute of Medical Microbiology, Immunology, and Hygiene, TU Munich, 81675, Munich, Germany,5Chair of Experimental Genetics, Center of Life and Food Sciences Weihenstephan, TU Munich, 85350, Freising-Weihenstephan, Germany,6Institute of Developmental Genetics, Helmholtz Zentrum München, German Research Center for Environmental Health, 85764, Neuherberg, Germany, 7Molecular Nutritional Medicine, Else Kröner-Fresenius Center, TU Munich, 85350,
Freising-Weihenstephan, Germany,8Department of Neurology, Friedrich-Baur-Institut, LMU Munich, 80336, Munich, Germany,9German Center for Vertigo and Balance Disorders, University Hospital Munich, Campus Grosshadern, 81377, Munich, Germany,10 Laboratory of Molecular Neurobiology, Department of Psychiatry, University of Bonn, 53105, Bonn, Germany
Abstract
Increased levels of blood plasma urea were used as phenotypic parameter for establishing novel mouse models for kidney diseases on the genetic background of C3H inbred mice in the phenotype-driven Munich ENU mouse mutagenesis project. The phenotypically recessive mutant line HST011 was established and further analyzed. The causative mutation was detected in the POU domain, class 3 transcription factor 3 (Pou3f3) gene,
which leads to the amino acid exchangePou3f3L423Pthereby affecting the conserved homeobox domain of the protein.Pou3f3homozygous knockout mice are published and show perinatal death. LinePou3f3L423Pis a viable mouse model harboring a homozygous
Pou3f3mutation. Standardized, systemic phenotypic analysis of homozygous mutants was carried out in the German Mouse Clinic. Main phenotypic changes were low body weight and a state of low energy stores, kidney dysfunction and secondary effects thereof including low bone mineralization, multiple behavioral and neurological defects including locomotor, vestibular, auditory and nociceptive impairments, as well as multiple subtle changes in immunological parameters. Genome-wide transcriptome profiling analysis of kidney and brain ofPou3f3L423Phomozygous mutants identified significantly regulated genes as com-pared to wild-type controls.
OPEN ACCESS
Citation:Kumar S, Rathkolb B, Kemter E, Sabrautzki S, Michel D, Adler T, et al. (2016) Generation and Standardized, Systemic Phenotypic Analysis of
Pou3f3L423P
Mutant Mice. PLoS ONE 11(3): e0150472. doi:10.1371/journal.pone.0150472
Editor:Vincenzo Coppola, Ohio State University Comprehensive Cancer Center, UNITED STATES
Received:November 20, 2015
Accepted:February 14, 2016
Published:March 22, 2016
Copyright:© 2016 Kumar et al. This is an open access article distributed under the terms of the
Creative Commons Attribution License, which permits unrestricted use, distribution, and reproduction in any medium, provided the original author and source are credited.
Data Availability Statement:Phenotypic analysis of mutant mice in the German Mouse Clinic includes the aim to collect and deliver by free access systemic phenome data of a high number of mutant mouse lines in a standardized manner. The complete phenotype reports are deposited online (http://146. 107.6.187/phenomap/jsp/annotation/public/ phenomap.jsf). Pou3f3 L423P homozygous mutant mice were analyzed under the preliminary line name HST011.
Introduction
Biomedical research with mice as animal models includes the search for and the analysis of alleles that predispose for or protect against specific diseases. A strategy for the search of novel disease-related alleles consists of the random chemical mutagenesis of a large number of ani-mals followed by the systematic screening for clinically relevant disease phenotypes. The alkyl-ating agentN-ethyl-N-nitrosourea (ENU) is mutagenic for premeiotic spermatogonial stem cells and allows the production of a large number of randomly mutagenized offspring from treated males. ENU predominantly induces point mutations [1]. In the phenotype-driven Munich ENU mouse mutagenesis project using C3HeB/FeJ (C3H) inbred mice as genetic back-ground, a standardized screening profile of clinical chemical blood plasma parameters was established for the analysis of the offspring of the mutagenized mice in order to detect pheno-typic variants [2,3]. Several mutant lines were established showing increased plasma urea levels as a parameter that is indicative of kidney diseases [4].
Pou3f3(POU domain, class 3 transcription factor 3, also denominated asBrn1) is an intron-less gene and is GC rich (74%) throughout the coding region [5,6]. It encodes a 497 amino acid protein that carries a common DNA binding motif called POU domain (aa 403–462). The amino acid sequence of POU3F3 is highly conserved in mouse and human thereby showing no differences in the POU domain but two amino acid exchanges as well as two sites harbouring glycine stretches with different length in the rest of the sequence (http://www.ensembl.org). POU transcription factors regulate a variety of developmental processes. POU3F3 plays a role in neuronal development and is expressed in the developing neocortex, both in the late precur-sor cells and in the migrating neurons (http://www.uniprot.org). The MGI database (http:// www.informatics.jax.org) harbouring knockout as well as mutant mouse alleles includes two complete POU3F3 knockouts.Pou3f3homozygous knockout mice show neonatal mortality. One-day-old homozygous knockout mice have increased plasma urea and potassium levels with renal hypoplasia and show developmental defects in the forebrain and the loop of Henle [7,8].
The ENU mutagenesis-derived recessive mutant mouse line HST011 showing increased plasma urea levels was analyzed for the causative mutation. After the identification of the caus-ative mutation inPou3f3, a standardized, systemic phenotypic analysis ofPou3f3L423P homozy-gous mutant mice was carried out in the German Mouse Clinic (http://www.mouseclinic.de) to examine organ systems and/or pathways that may be affected by thePou3f3mutation as pri-mary or secondary effects.
Materials and Methods
Animals, Linkage Analysis, and Detection of the Causative Mutation
The recessive mutant line HST011 (= UREHR2) was established in the clinical chemical screen of the phenotype-based Munich ENU mouse mutagenesis project [9] on the C3HeB/FeJ (C3H) inbred genetic background by showing increased plasma urea values at the age of three months (cut-off level: 70 mg/dl = 11.7 mmol/l). Mouse husbandry, breeding, linkage analysis, and genome-wide mapping were performed as described previously [4]. All mice had free access to drinking water and a standard rodent diet (V1124; Ssniff, Soest, Germany)ad libitum.
For linkage analysis of the causative mutation, automated DNA extraction from the lysates was performed using the AGOWA Mag Maxi DNA Isolation Kit (AGOWA, Berlin, Germany). A genome-wide, evenly distributed mapping panel consisting of 158 single nucleotide poly-morphism (SNP) markers was applied. The markers used are available upon request. Genotyp-ing usGenotyp-ing this panel was performed by MassExtend, a MALDI-TOF high-throughput
German Center for Vertigo and Balance Disorders (grant 01 EO 0901) and to the GMC (NGFN-Plus grants No. 01GS0850, 01GS0851, 01GS0853, 01GS0854, 01GS0869; Infrafrontier grant 01KX1012), and by the Initiative and Networking Fund of the Helmholtz Association in the framework of the Helmholtz Alliance for Mental Research in an Ageing Society (HA-215).
genotyping system supplied by Sequenom (San Diego, CA, USA). Additional fine mapping was performed using further SNP and microsatellite markers. Chromosomal positions of markers and genes are according to the GRCm38 mouse assembly (http://www.ensembl.org). All genes which are located in the identified defined chromosomal region were analyzed for published data about their wild-type and mutant function with respect to their potential impact on renal function and renal diseases.
Immunohistochemical Analysis
For immunohistochemical analysis, kidneys were fixed with 4% paraformaldehyde in PBS (pH 7.4) via orthograde vascular perfusion, postfixed by immersion in the same fixative for one day and embedded in paraffin. 3μm thick paraffin sections were dewaxed and rehydrated, and heat induced antigen retrieval using Citrate buffer (pH 6.0) was performed. Immunohistochemistry was performed with a polyclonal guinea pig anti-POU3F3 antiserum (generous gift from Michael Wegner) [10] and HRP-labeled rabbit anti-guinea pig antibody (Dako, Hamburg, Ger-many). Immunoreactivity was visualized using 3,3-diaminobenzidine tetrahydrochloride dihy-drate (DAB) (brown color) and nuclear counterstaining was done with haemalum (blue color).
Phenotypic Analysis in the German Mouse Clinic
Maintenance of the recessive mutant mouse linePou3f3L423Pcomprised the repeated backcross to C3H wild-type mice for more than ten generations leading to the subsequent loss of essen-tially all non-causative ENU mutations that were not linked to thePou3f3mutation. The com-prehensive phenotypic analysis was carried out in the German Mouse Clinic at the Helmholtz Zentrum München by using standardized examination protocols (http://www.mouseclinic.de). The analysis covers several hundred parameters in the areas of allergy, behavior, cardiovascular analysis, clinical chemistry, dysmorphology including bone and cartilage, energy metabolism, eye analysis and vision, immunology, lung function, molecular phenotyping, neurology, noci-ception, steroid analysis, and pathology. The complete protocols of the examinations are described underhttp://www.mouseclinic.de[11–13].
Pou3f3L423Phomozygous mutant mice were analyzed with an age of 8–24 weeks. 27 homo-zygous mutants and 32 wild-type control littermates were used for phenotypic analyses. The number of animals analyzed was 13–16 animals per sex and genotype (except of otherwise stated in the text of the respective Results section).
Mouse husbandry was done under a continuously controlled specific pathogen free (SPF) hygiene standard according to the FELASA recommendations [14] (http://www.felasa.eu). All tests were carried out under the approval of the responsible animal welfare authority (Regier-ung von Oberbayern).
Data are shown as mean ± standard deviation. If not otherwise stated, data were analyzed using R, a language and environment for statistical computing. Tests for genotype effects were made by usingt-test, Wilcoxon rank sum test, linear models, or ANOVA depending on the assumed distribution of the parameter and the questions addressed to the data. Significant dif-ferences are indicated forP<0.05, 0.01, and 0.001.
Results
Generation of Line
Pou3f3
L423Pand Identification of the Causative
Mutation
urea values at the age of three months (cut-off level: 70 mg/dl = 11.7 mmol/l) in homozygous mutant mice. Homozygous mutants of both sexes were viable and fertile. They exhibited a smaller size but no other grossly apparent phenotype compared to wild-type controls.
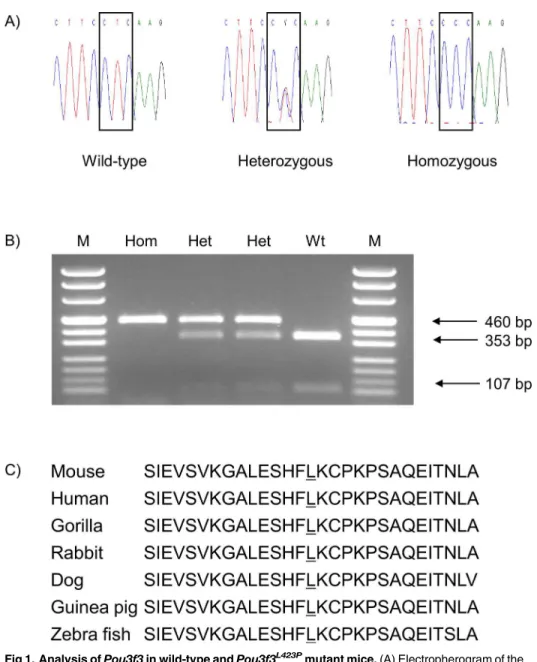
Genome-wide linkage analysis of the causative mutation was carried out with phenotypi-cally homozygous mutant G2 animals derived from the mating of phenotypiphenotypi-cally homozygous mutant animals on the inbred C3H genetic background with BALB/c inbred mice and the sub-sequent intercross of the phenotypically inconspicuous heterozygous mutant G1 mice. Using a panel of 116 genome-wide polymorphic markers, the mutant phenotype was mapped to a sin-gle locus on MMU1. Further fine mapping showed the highest linkage for the polymorphic marker D1Mit212 (40.0 Mb) (http://www.ensembl.org). The candidate genePou3f3was selected for the sequence analysis, as it is located at 42.7 Mb on chromosome 1, and a published mutant phenotype has been described with increased plasma urea and potassium levels associ-ated with renal hypoplasia (http://www.informatics.jax.org).Pou3f3consists of a single exon coding for a 497 aa polypeptide. Sequence analysis ofPou3f3revealed a T!C point mutation at nt 1268 (ENSMUST00000054883) which leads to the amino acid exchange from leucine to proline at aa position 423. Therefore, the name of line HST011 was designated asPou3f3L423P. The mutation affects the highly conserved DNA binding domain of the protein including aa 403–462. Allelic differentiation of thePou3f3L423Pmutation was carried out by PCR-RFLP as the point mutation abolished the restriction site for the enzymeSmlI (Fig 1).
To evaluate the impact of the amino acid changing mutation POU3F3L423Pon cellular local-ization and abundance, immunohistochemical locallocal-ization of POU3F3 in kidneys was per-formed (Fig 2). In wild-type controls, the transcription factor POU3F3 was immunostained in nuclei of numerous but not all tubule profiles in weak up to strong staining intensity. The kid-neys ofPou3f3L423Phomozygous mutant mice exhibited similar staining pattern and staining intensity of POU3F3 compared to wild-type control kidneys.
Phenotypic Analysis in the German Mouse Clinic
Phenotypic analysis of mutant mice in the German Mouse Clinic includes the aim to collect and deliver by free access systemic phenome data of a high number of mutant mouse lines in a standardized manner. The complete phenotype reports will be deposited online (http://146. 107.6.187/phenomap/jsp/annotation/public/phenomap.jsf).Pou3f3L423Phomozygous mutant mice were analyzed under the preliminary line name HST011. Compared to wild-type controls,
Pou3f3L423Pheterozygous mutant mice showed no differences in the guiding primary symp-toms of plasma urea value and relative kidney weight. Thus,Pou3f3L423Phomozygous mutant mice were examined in the German Mouse Clinic with wild-type littermates as controls (S1 Table).
Behavioral and Neurological Analysis
Pou3f3L423Phomozygous mutant mice were tested at the age of eight weeks in the open field as a test of spontaneous unconditioned reactions to a novel environment allowing an evaluation of exploratory drive, reactivity to novelty and emotionality. Compared to controls, mutant mice generally showed an increased locomotor activity in this environment with increased distance moved forward and increased average speed of movement. They spent more time in the aversive zone of the center and less time in the periphery, however, this may be secondary due to their increased locomotor activity. In addition, female mutant mice exhibited a decreased rearing activity (Table 1) that is likely due to the balance and vestibular deficits described below.
Significantly altered parameters of the SHIRPA analysis (at 8 weeks) were presence of lacrima-tion, presence of pelvic elevation during walking, and especially mutant mice showed trunk curl upon tail suspension and an impaired contact righting reflex when the mice were turned on their back. The other SHIRPA parameters (locomotor activity, body position, tremor, pal-pebral closure, defecation and urination during observation, transfer arousal, gait, tail eleva-tion, startle response, touch escape, positional passivity, limb grasping, pinna reflex, corneal reflex, evidence of biting and vocalization in and above the arena) were without significant alterations (Table 2).
Fig 1. Analysis ofPou3f3in wild-type andPou3f3L423P
mutant mice.(A) Electropherogram of the
Pou3f3L423P
mutation. The box shows the T!C point mutation at nt 1268 (ENSMUST00000054883) from the wild-type codon leucine (L) to the mutant codon proline (P) at amino acid position 423. (B) Genotyping of mice by allele-specific PCR-RFLP reaction.SmlI restriction digest of the 460 bp PCR product results in 353 bp and 107 bp fragments of the wild-type allele. Hom,Pou3f3L423P
homozygous mutant; Het,Pou3f3L423P
heterozygous mutant; Wt, wild-type; M, pUC Mix 8 marker, MBI Fermentas. (C) Partial protein sequence alignment of the homeobox domain of murine POU3F3 with other species. The underlined amino acid residue shows the position of thePou3f3L423Pmutation.
Subsequent measurement of the grip strength (g) for two paws and four paws to evaluate muscle performance revealed decreased values in the mutants (mean force for 2 paws: 101 ± 19 vs. 120 ± 20 in males, 84 ± 16 vs. 119 ± 16 in females (P= 0.09); mean force for 4 paws: 184 ± 28 vs. 207 ± 17 in males, 152 ± 8 vs. 198 ± 16 in females (P= 0.03); n = 12–16 per geno-type and sex) which was attributed mainly to the decreased body weight.
Evaluation of motor coordination and balance in three consecutive trials on the accelerating rotarod at the age of 9 weeks revealed a tendency to increased latencies (sec) on the rod in the light-weight mutants (127 ± 53 vs. 103 ± 35 in males, 113 ± 55 vs. 97 ± 32 in females (P= 0.89); n = 12–16 per genotype and sex) and significantly increased passive rotations (45 in three trials of 27 mutants vs. 35 in three trials of 32 controls (P= 0.02)). The usual improvement in the performance of the task over the three trials was observed in both genotypes. Since the mutants showed movement deficits hinting towards coordination or balance deficits, additional tests especially sensitive to balance impairments were carried out with the same group of mice at the age of 19 weeks. Balance beam, beam ladder, swim ability as well as gait analysis were per-formed (n = 10–16 per sex and genotype) with alterations detected in all tests (Table 3).
Fig 2. Immunohistochemical localization of POU3F3 in kidneys.POU3F3 was detected in nuclei of numerous but not all tubule segments with weak up to strong staining intensity in a wild-type kidney. The immunostaining pattern and staining intensity of POU3F3 in the kidney of aPou3f3L423Phomozygous mutant mouse was similar to the findings observed in the wild-type control kidney. DAB (brown color); nuclear staining: haemalum (blue color). Age of mice analyzed: 22 months. Bars represent 100μm.
doi:10.1371/journal.pone.0150472.g002
Table 1. Open field behavioral analysis of line Pou3f3L423P
.
Males Females Genotype:P-value
Parameter Homozygous mutant Wild-type Homozygous mutant Wild-type
Distance traveled–total (cm) 11382±5683 8013±2754 12443±5374 9987±3127 a
Number of rearings—total 6.7±11.0 16.4±23.9 2.3±6.6 47.9±45.3 c
Percent distance in the center—total 18.3±13.0 5.1±5.7 20.3±11.1 9.9±7.0 c
Percent time spent in the center—total 15.0±10.9 3.5±3.8 16.7±9.6 7.0±4.9 c
Whole arena—resting time (sec) 11.1±15.1 24.6±33.8 3.3±4.9 68.5±62.6 c Whole arena—average speed (cm/sec) 9.6±4.9 6.9±2.6 10.4±4.5 8.9±3.1 a Latency to enter in the center (sec) 37±59 203±347 89±133 115±129
Number of entries in the center 131±123 26±30 142±92 54±38 c
8-week-old mice were tested in the openfield for 20 min. No. per genotype and sex: n = 12–16. Data are presented as mean±standard deviation.
Significance vs. wild-type controls: a,P<0.05; c,P<0.001.
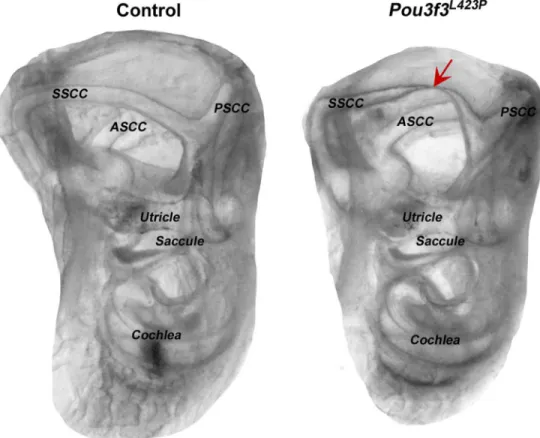
Morphological analysis of the inner ears using the whole mount clearing method (n = 6 per genotype) showed abnormal superior semi-circular canal formation of the vestibular organ of the mutants (Fig 3). The canals appear intact on both sides but the thickness and the curvature of the superior semi-circular canal is impaired. The side of the superior semi-circular canal that meets the common crus presents an irregular curvature of the canal that might be respon-sible for the balance deficits in the mutants.
The prepulse inhibition (PPI) of the acoustic startle reflex test assessed the sensorimotor gating. Acoustic startle reactivity and prepulse inhibition were significantly decreased in mutant mice at all sound pressure levels, i.e. startle amplitude at 70, 80, 85, 90, 100, 110 and 120 dB, and prepulse inhibition at 4, 8 and 12 dB prepulse sound pressure level above back-ground (P<0.001 for all). The clear reduction of the acoustic startle amplitude suggested
either impaired hearing ability or impaired neuromuscular recruitment. By measuring the auditory brain stem response (ABR), hearing sensitivity was assessed in a subset of mice (7 male and 3 female mutants as well as 9 male and 5 female controls; 16 weeks of age) by record-ing the minimum sound pressure required to elicit a physiological response to different audi-tory stimuli. There were significant (P0.001) differences at all tone frequencies (6, 12, 18, 24
Table 2. Neurology analysis by modified SHIRPA of linePou3f3L423P
.
Males Females Genotype:P-value
Parameter Homozygous mutant Wild-type Homozygous mutant Wild-type
Body weight (g) 22.4±1.7 27.7±2.2 18.9±1.8 24.9±2.8 c
Locomotor activity (floor squares crossed) 11.1±10.2 7.4±5.8 10.8±7.9 16.4±7.1
Lacrimation 5 of 14 0 of 16 6 of 12 0 of 16 c
Pelvic elevation (more than 5) 4 of 14 0 of 16 3 of 12 0 of 16 b
Tail elevation: horizontal extension 4 of 14 0 of 16 5 of 12 4 of 16 0.06
Trunk curl: present 8 of 14 3 of 16 9 of 12 4 of 16 b
Urination: absent 12 of 14 7 of 16 6 of 12 7 of 16 0.07
Contact righting reflex: absent 11 of 14 2 of 16 8 of 12 1 of 16 c
8-week-old mice were tested. No. per genotype and sex: n = 12–16. Data are presented as mean±standard deviation (body weight, locomotor activity) and as exact numbers. Significance vs. wild-type controls: b,P<0.01; c,P<0.001.
doi:10.1371/journal.pone.0150472.t002
Table 3. Additional locomotor analysis requiring balance maintenance of linePou3f3L423P.
Males Females Genotype:P-value
Test Parameter Homozygous mutant Wild-type Homozygous mutant Wild-type
Balance beam Square,Ø20 mm (sec) 28.8±8.4 14.0±7.7 24.5±8.8 10.8±4.8 c
Square,Ø12 mm (sec) 25.6±8.5 13.5±7.7 24.0±12.2 12.1±5.5 c Round,Ø22 mm (sec) 22.2±8.2 10.6±5.3 18.6±6.2 9.7±5.4 c Round,Ø15 mm (sec) 23.1±8.4 14.6±7.5 21.3±9.7 15.0±7.7 b
Beam ladder Time (sec) 22.6±4.4 17.8±6.1 23.1±3.8 17.1±4.4 c
Fore paw slips (n) 0.5±0.5 0.3±0.5 0.4±0.4 0.2±0.2 a
Hind paw slips (n) 6.6±2.3 3.4±1.5 5.1±1.8 2.4±1.7 c
Stops (n) 4.2±1.1 3.3±1.5 4.1±0.9 2.9±1.0 b
Swim ability Normal (%) 46 100 10 93 c
Irregular (%) 54 0 90 7 c
Analysis was done at the age of 19 weeks. No. per genotype and sex: n = 10–16. Data are presented as mean±standard deviation (balance beam, beam ladder). For the swim ability test, the percentages of the mice are shown. Significance vs. wild-type controls: a,P<0.05; b,P<0.01; c,P<0.001.
and 30 kHz) as well as for the broadband click. Sound pressure thresholds were clearly increased in both sexes, indicating decreased hearing sensitivity.
Nociception
Analysis of nociception was carried out in 10-week-old mice by using the hot plate assay at 52°C for the detection of altered pain response. The reactions due to thermal pain by shaking and licking of the hind paws were measured in the mutants and controls (latency in seconds for shacking of hind paws: 15.4 ± 7.5 vs. 14.3 ± 4.1 in males, 18.8 ± 6.7 vs. 12.5 ± 4.3 in females (P= 0.02); latency in seconds for licking of hind paws: 24.6 ± 7.4 vs. 23.8 ± 5.7 in males, 28.0 ± 2.9 vs. 21.0 ± 5.7 in females (P= 0.01); n = 13–16 per genotype and sex). Thus, the female mutants showed a significant hypoalgesia.
Clinical Chemistry and Hematology Analysis
LinePou3f3L423Pwas established based on increased plasma urea levels in the homozygous mutant animals. Clinical chemical analysis of blood plasma at the age of 15 weeks revealed sig-nificantly increased values for creatinine, urea, chloride, potassium as well as alkaline phospha-tase, aspartate aminotransferase and lactate dehydrogenase activity, and decreased values for glucose, albumin, total protein, cholesterol and triglycerides in the mutants (Table 4). In view of the lower body weight and increased locomotor activity, the plasma parameters with the
Fig 3. Morphological analysis of the inner ears of linePou3f3L423P.Morphological analysis of the inner ears using the whole mount clearing method showed abnormal superior semi-circular canal formation in the homozygous mutants of linePou3f3L423P
. Left picture shows a control inner ear with normal semi-circular canals. Right picture shows the smaller inner ear of aPou3f3L423P
homozygous mutant animal with abnormal superior semi-circular canal formation. Red arrow shows the constriction of the superior semi-circular canal. SSCC: superior semi-circular canal, PSCC: posterior semi-circular canal, ASCC: anterior semi-circular canal.
decreased values might indicate a state of low energy stores in the mutants. In the hematology analysis, mutants showed decreased values for red blood cell count, hemoglobin, hematocrit, mean corpuscular volume and mean corpuscular hemoglobin. Thus, they showed erythropenic anemia with a trend towards microcytosis. This might be a secondary effect of the azotemia. In addition, platelets were also decreased, whereas white blood cells were increased in the mutants (Table 5).
Table 4. Clinical chemical analysis of linePou3f3L423P
.
Males Females Genotype:P-value
Parameter Homozygous mutant Wild-type Homozygous mutant Wild-type
Na+(mmol/l) 153±1 153±1 151±3 150±4
K+(mmol/l) 5.1±0.4 4.6±0.3 4.7±0.3 3.9±0.3 c
Ca2+(mmol/l) 2.4±0.1 2.5±0.1 2.5±0.1 2.4±0.1
Cl-(mmol/l) 109±1 108±2 112±3 110±3 b
Fe (μmol/l) 38.0±3.4 36.8±3.8 40.5±8.8 37.6±3.8
Pi(mmol/l) 1.5±0.3 1.5±0.2 1.7±0.3 2±0.4
Total protein (g/l) 53.2±1.4 56.1±1.8 52.7±1.3 53.5±2.4 c
Albumin (g/l) 29.7±3.4 31.5±1 30.5±2.5 32±1.6 b
Creatinine (μmol/l) 16.5±1.3 15.9±1.0 16.5±2.8 11.1±2.4 c
Urea (mmol/l) 20.8±1.8 10.7±0.9 18.7±2.1 8.7±1.3 c
Cholesterol (mmol/l) 3.5±0.2 4.3±0.4 3.1±0.2 3.3±0.4 c
Triglycerides (mmol/l) 2.2±0.6 3.4±0.8 2.1±0.6 3.0±1.0 c
ALT (U/l) 45±50 33±7 27±5 28±6
AST (U/l) 72±30 51±8 72±22 48±7 c
AP (U/l) 132±14 111±9 148±25 132±14 c
α-Amylase (U/l) 717±86 726±55 694±59 623±59
Glucose (mmol/l) 9.4±1.8 10.6±2.2 10.4±2.0 11.5±1.8 a
LDH (U/l) 250±104 178±38 239±53 181±39 c
Creatinine, plasma creatinine analyzed by the enzymatic method; ALT, alanine aminotransferase; AST, aspartate aminotransferase; AP, alkaline phosphatase; LDH, lactate dehydrogenase.
15-week-old mice were tested. No. per genotype and sex: n = 13–16. Data are presented as mean±standard deviation. Significance vs. wild-type
controls: a,P<0.05; b,P<0.01; c,P<0.001.
doi:10.1371/journal.pone.0150472.t004
Table 5. Hematological analysis of linePou3f3L423P
.
Males Females Genotype:P-value
Parameter Homozygous mutant Wild-type Homozygous mutant Wild-type
WBC (103/μl) 8.7±1.5 7.4±1.3 8.7±2.2 7.1±1.4 b
RBC (106/μl) 8.9±0.3 9.5±0.6 9.2±0.3 9.6±0.3 c
PLT (103/μl) 972±74 1093±107 1006±111 1168±93 c
HGB (g/dl) 14.5±0.5 15.6±0.9 15.1±0.5 16.0±0.4 c
HCT (%) 50.2±1.7 54.0±3.3 52.5±1.5 55.6±1.5 c
MCV (fl) 56.2±0.4 56.9±0.7 57.0±0.6 57.8±0.7 c
MCH (pg) 16.2±0.3 16.5±0.4 16.4±0.4 16.6±0.2 a
MCHC (g/dl) 28.8±0.4 28.9±0.6 28.8±0.6 28.8±0.4
WBC, white blood cell count; RBC, red blood cell count; PLT, platelet count; HGB, hemoglobin; HCT, hematocrit; MCV, mean corpuscular volume; MCH, mean corpuscular hemoglobin; MCHC, mean corpuscular hemoglobin concentration.
15-week-old mice were tested. No. per genotype and sex: n = 13–16. Data are presented as mean±standard deviation. Significance vs. wild-type controls: a,P<0.05; b,P<0.01; c,P<0.001.
Clinical chemical analysis of the plasma parameters of an additional group of homozygous mutant and wild-type control mice (n = 5–10 per genotype and sex) not transferred to the Ger-man Mouse Clinic at the age of 12–14 weeks confirmed the results of the GMC analysis at the age of 15 weeks. Moreover, heterozygous mutants (17 males, 8 females) were also included in this analysis and showed no significant differences compared to the wild-type controls (data not shown). In addition, metabolic cage analysis was carried out in these mice at the age of 14–
15 weeks (n = 4–10 per genotype and sex). The mutant mice harbored a lower body weight and showed an increased urine volume in the males as well as decreased urinary uric acid levels indicating kidney dysfunction, also together with the other parameters showing altered urine levels by tendency in both sexes when compared to the controls (Table 6).
In addition, an intraperitoneal glucose tolerance test (IpGTT) was carried out at the age of 12 weeks after food withdrawal overnight (n = 13–16 per genotype and sex). Relative body mass loss induced by overnight food withdrawal showed no clear genotype effect. In the food-deprived condition, mutants showed a higher glucose clearance from 30 min after the start of the test com-pared to the wild-type controls (basal glucose level (mmol/l): 6.1 ± 0.6 vs. 6.2 ± 0.6 in males, 4.9 ± 0.5 vs. 5.0 ± 0.7 in females (P= 0.6); area under the curve (AUC) for the first 30 min: 321 ± 50 vs. 290 ± 64 in males, 219 ± 42 vs. 245 ± 54 in females (P= 0.9); AUC for the remaining 90 min: 447 ± 148 vs. 911 ± 197 in males, 261 ± 73 vs. 422 ± 208 in females (P<0.001)).
Table 6. Urine analysis of linePou3f3 (in an additional group of mice not transferred to the German Mouse Clinic).
Males Females
Parameter Homozygous mutant Controls Homozygous mutant Controls
Body weight (g) 20.4±1.4c 26.3±3.6 18.2±2.2b 23.3±2.7
Waterad libitum
Water intake (ml/day) 5.9±3.0 4.3±0.7 5.5±1.7 4.9±2.3
Food intake (g/day) 3.5±1.2 3.9±0.6 3.6±0.7 4.2±0.7
Urine volume (ml/day) 1.5±0.7a 0.9±0.3 1.6±0.5 1.0±0.6
Na+(μmol/day) 125±47 169±36 170±69 231±67
K+(μmol/day) 375±114 422±149 505±117 600±232
Ca2+(μmol/day) 1.5±0.5 1.4±0.6 3.0±0.8 2.0±0.9
Cl-(μmol/day) 217±78 274±73 315±112 395±118
Mg2+(μmol/day) 9±7 15±9 23±13 22±9
Pi(μmol/day) 50±54 63±47 77±71 99±59
Creatinine-J (μmol/day) 3.5±1.0 4.0±1.0 3.8±1.1 4.9±1.3
Creatinine-E (μmol/day) 2.1±0.5 2.5±0.6 2.5±0.7 3.1±0.9
Urea (mmol/day) 1.2±0.3 1.3±0.4 1.6±0.4 1.8±0.6
Uric acid (nmol/day) 329±94b 587±154 522±84b 977±208
Glucose (μmol/day) 1.5±1.1 2.1±1.1 5.0±2.5a 3.1±0.8
Total protein (mg/day) 5.0±1.7 7.3±3.7 0.9±0.3 2.9±2.1
Albumin (nmol/day) 1.4±0.3 1.9±0.6 2.0±0.2 2.2±0.7
Deprivation of water for 24 h
Loss of body weight (%) 13.2±2.2b 9.6±1.4 13.4±1.2c 9.7±1.3
Food intake (g/day) 1.2±0.4c 2.3±0.3 1.8±0.2b 2.3±0.3
Urine volume (ml/day) 0.6±0.3 0.5±0.2 0.7±0.1 0.5±0.2
Creatinine-J, creatinine analyzed by Jaffe’s kinetic method; Creatinine-E, creatinine analyzed by the enzymatic method.
The analysis was done under basal conditions and after deprivation of drinking water for 24 h in metabolic cages. 14-15-week-old mice were tested. Heterozygous mutant and wild-type littermates were used as controls. No. per group and sex: n = 4–10. Data are presented as mean±standard
deviation. Student’st-test vs. controls:aP<0.05,bP<0.01,cP<0.001.
Dysmorphology, Bone and Cartilage
Pou3f3L423Phomozygous mutant mice were tested at the age of 10 (morphological analysis), 11 (click box test) and 19 (dual energy X-ray absorption (DXA) and X-ray analysis) weeks. The systematic morphological investigation via visual inspection (overall body shape, eye, coat, skin, vibrissae, extremities including limbs, digits and tail, teeth, ears, musculature, skeleton, neurology/behavior, respiratory system, reproductive system, other aberrant phenotype) found no genotype-specific differences. Analysis of the hearing ability in 11-week-old mice was exam-ined by the click box test using a sound of 20 kHz, and the reaction of the animals (n = 13–16 per genotype and sex) was classified into six categories. We observed a decreased hearing reac-tion in the mutants by trend (P= 0.1 for males,P= 0.3 for females).
DXA (dual energy X-ray absorption) analysis detected significantly decreased values for bone mineral density (BMD) in male mutants, bone mineral content (BMC) in all mutants, and bone content in male mutants compared to controls. This might be a secondary effect of the renal dysfunction leading to the impaired electrolyte balance in the mutant mice which was revealed in the clinical chemistry analysis. Concurrently body length, body weight, and fat mass were significantly decreased in mutants (Table 7). X-ray analysis of the skeleton (skull shape, mandibles, maxilla, teeth, orbit, number of vertebrae, vertebrae shape, number of ribs, rib shape, scapula, clavicle, pelvis, femur diameter, femur shape, tibia, fibula, humerus, ulna, radius, number of digits, completeness of digits, joints) found no genotype-specific differences between mutants and wild-type controls.
Energy Metabolism
Analysis of the energy metabolism was done on 11-week-old mice underad libitumconditions. Indirect calorimetry revealed that mutants were considerably underweight and showed a marked reduction in rectal body temperature. The other effects on energy turnover were con-founded by the difference in body weight. When adjusted for body weight, significant genotype effects on residual mean, minimum and maximum oxygen consumption were observed espe-cially in the female mutants showing a slight hypometabolism. Despite lower metabolic rate, we observed a mild increase of locomotor activity but not rearing behavior. We could not detect a significant difference in the respiratory exchange ratio (RER) but the relation between the levels of oxygen consumption and metabolic fuel utilization indicated that metabolic flexi-bility may be impaired in mutant mice. At higher levels of VO2, the controls showed a wider
range of respiratory exchange ratios than the mutant mice (not shown). In the determination
Table 7. Dual energy X-ray absorption (DXA) analysis of bone- and weight-related parameters in linePou3f3L423P
.
Males Females
Parameter Homozygous mutant Wild-type Homozygous mutant Wild-type
BMD (mg/cm2) 54±6b 63±5 54±5 61±6
BMC (mg) 548±79c 883±246 522±196a 804±249
Bone content (%) 2.0±0.3a 2.4±0.6 2.0±0.4 2.3±0.4
Body length (cm) 9.9±0.2b 10.3±0.2 9.9±0.4a 10.3±0.4
Body weight (g) 28.1±2.7c 36.3±3.3 25.2±4.8c 33.8±6.3
Fat mass (g) 5.8±1.8c 15.1±5.5 6.6±4.7b 14.7±7.3
Lean mass (g) 16.0±1.2 14.0±4.0 12.9±1.3 12.7±3.2
BMD, bone mineral density; BMC, bone mineral content.
Analysis was done at the age of 19 weeks. No. per genotype and sex: n = 8–16. Data are presented as mean±standard deviation. Significance vs.
wild-type controls:aP<0.05,bP<0.01,cP<0.001.
of body composition by time domain nuclear magnetic resonance (TD-NMR), mutant mice also showed a significantly lower body weight than control mice. The statistical analysis did not reveal significant genotype related main effects on body fat content or lean mass when adjusted for body mass but it was evident that the relation between body weight and fat mass respectively lean mass was different between control and mutant mice (Table 8).
Immunology
The mice were tested at 15 weeks of age for leukocyte populations in peripheral blood and immu-noglobulin levels (IgM, IgG1, IgG2a, IgG2b, IgG3, and IgA) as well as rheumatoid factor and anti-DNA antibodies in blood plasma. Flow cytometry observed a higher frequency of granulocytes as well as a lower frequency of CD8+ T cells resulting in the tendency of a higher CD4:CD8 ratio in female mutants. Furthermore, we found higher frequencies of CD44 expressing cells within both (CD4+ and CD8+) T cell clusters. Only in female mutants we found lower frequencies of B cells and NK cells and an increased frequency of CD25 expressing cells within the CD4+ T cell cluster (Table 9). The frequency of granulocytes in blood showed changes which have been described for various pathological conditions (e.g. tumor development, infection, stress). Thus, the increased frequency of granulocytes might be a major factor for the changes in the main leukocyte popula-tions in the mutants. The T cells showed differences in the frequencies of CD44 expressing cells. The high-surface expression of the CD44 is assigned to activated T cells; alternatively, these cells might represent cells that arise via physiological homeostatic proliferation [15].
For the immunoglobulin levels, slightly lower levels of immunoglobulins were found in male mutants compared to controls. Especially, the levels of IgG3 were significantly lower (data not shown).
Table 8. Analysis of energy metabolism in linePou3f3L423P
.
Males Females Genotype:
P-value
Test Parameter Homozygous
mutant
Wild-type Homozygous mutant
Wild-type
Indirect calorimetry
Body weight (g) 24.3±1.3 30.7±2.5 20.9±2.1 28.4±3.3 c
Body temperature (°C) 35.7±0.7 36.2±0.4 36.4±0.3 36.8±0.3 b
Food intake (g) 2.8±0.3 3.2±0.8 2.8±0.4 3.6±0.6
Average VO2consumption (ml/h
animal)
85±4 95±6 81±6 99±7 a
Average RER (VCO2/VO2) 0.89±0.01 0.90±0.04 0.90±0.02 0.92±0.03
Adjusted mean MR (mW) 507±21 508±21 515±23 556±50 0.05
Adjusted RMR (mW) 375±17 383±23 392±11 492±24 c
Average distance (cm/20 min) 843±213 658±86 958±400 810±298 0.06
Average rearings (counts/20 min) 144±59 119±20 144±71 149±69
TD-NMR Body weight (g) 24.8±1.6 30.5±2.6 20.1±2.8 27.4±3.2 c
Fat mass (g) 5.4±0.6 7.8±1.4 4.9±1.1 8.0±1.9
Lean mass (g) 15.8±1 18.9±1.3 12.2±1.5 16.1±1.5 0.06
RER, respiratory exchange ratio; adjusted mean MR, metabolic rate (MR) was adjusted for body mass by subtracting residual MR from modeled mean expected MR; adjusted RMR, adjusted resting metabolic rate (i.e. lowest MR during the measurement); TD-NMR, time domain nuclear magnetic resonance.
Analysis was done on 11-week-old mice underad libitumconditions. No. per genotype and sex: n = 9–16. Substrate utilization rates during indirect
calorimetry were calculated as described [27]. Data are presented as mean±standard deviation. Significance vs. wild-type controls: a,P<0.05; b, P<0.01; c,P<0.001.
In total, we found multiple changes in the frequencies of leukocyte subset proportions in peripheral blood. Most of the observed changes were subtle, however, the accumulation of the immunological findings may suggest a primary or secondary influence of the mutation on the immune system.
Molecular Phenotyping
Based on the results of the analysis in the German Mouse Clinic as well as on the published results ofPou3f3knockout mice [7,8,16], the pathogenic effects of thePou3f3mutation were evaluated in brain, kidney and spleen by genome-wide transcriptome profiling analysis using Illumina MouseRef8 v2.0 Expression Bead Chips. Samples of the three selected organs of four mutant males were compared to four wild-type males as controls at the age of 24 weeks (in total 23 experiments as the RNA isolation of one control kidney sample failed).
Statistical analysis of the gene expression patterns [17,18] in the brain identified 104 signifi-cantly regulated genes in mutants vs. wild-type controls (false discovery rate (FDR) = 0.6%, fold change>1.4). The range of the mean log2ratios was 1.6 to 2.0 for the 7 up-regulated
genes as well as -2.0 to -1.4 for 96 down-regulated genes and -5.0 forTshb(thyroid stimulating hormone, beta subunit) as additionally down-regulated gene. The genes are functionally associ-ated with movement disorders, Huntington’s disease, necrosis and RNA transcription.
Table 9. Immunology analysis of linePou3f3L423P.
Males Females Genotype:P-value
Parameter Homozygous mutant Wild-type Homozygous mutant Wild-type
CD45+/T cells 33.9±4.4 36.4±3.2 36.6±4.4 39.2±5.2 a
CD45+/CD3+CD4+ 22.0±3.1 23.5±2.5 23.5±2.8 25.1±4.0 0.07
CD45+/CD3+CD8+ 8.9±1.1 9.7±1.0 10.2±1.6 11.4±1.2 b
CD45+/B cells 28.7±3.5 28.7±2.7 28.3±5.0 33.1±5.8 a
CD45+/CD5-NK+ 6.3±1.4 6.9±1.6 4.4±1.0 5.7±1.2 b
CD45+/CD11b+Gr1+ 28.6±6.1 25.6±3.7 28.0±6.1 17.5±5.7 c
CD45+/NK-Gr1-CD11b+ 2.2±0.9 2.7±0.6 2.3±0.7 2.6±1.4
CD45+/CD3+γδTCR+ 0.99±0.2 0.94±0.3 0.99±0.3 0.98±0.3
CD45+/CD5+NK+ 0.06±0.05 0.05±0.03 0.02±0.01 0.02±0.02
CD45+/CD3+CD4+CD25+ 0.89±0.17 0.89±0.14 1.03±0.25 0.94±0.11
CD3+CD4+/CD25+ 4.1±0.6 3.8±0.5 4.4±1.2 3.8±0.4 a
CD3+CD4+/CD62L+ 90.0±3.9 91.3±2.6 85.5±8.5 86.2±5.3
CD3+CD4+/CD44+ 2.5±0.4 2.0±0.3 3.1±0.7 2.3±0.5 c
CD3+CD8+/CD62L+ 97.6±1.0 97.5±0.9 97.2±1.7 97.4±1.1
CD3+CD8+/CD44+ 3.5±0.9 3.3±0.9 2.3±0.8 1.6±0.8 a
B cells/IgD+ 89.3±2.8 88.1±2.8 87.4±2.9 86.6±3.2
B cells/CD5+ 5.3±1.7 5.3±1.0 5.2±2.0 5.1±1.5
B cells/ B220+MHCclassII+ 97.9±1.0 98.2±0.6 93.6±5.1 95.4±3.1
NK+/CD11b+ 9.5±6.3 12.9±6.5 3.4±1.9 3.0±2.4
CD3+ rest 2.9±0.5 3.1±0.4 2.8±0.7 2.7±0.5
ratio CD4: CD8 2.5±0.1 2.4±0.2 2.3±0.2 2.2±0.2
ratio granulocytes: (T cells + B cells) 0.46±0.13 0.40±0.07 0.44±0.13 0.25±0.10 c
ratio T cells: B cells 1.20±0.24 1.28±0.18 1.33±0.29 1.22±0.27
Data are frequencies of main leukocyte subpopulations in peripheral blood (%) measured byflow cytometry.
15-week-old mice were tested. No. per genotype and sex: n = 13–16. Data are presented as mean±standard deviation. Significance vs. wild-type
controls: a,P<0.05; b,P<0.01; c,P<0.001.
Statistical analysis of the gene expression patterns in the kidney identified 292 significantly regulated genes in mutants vs. wild-type controls (FDR = 1.5%, fold change>1.4). The range
of the mean log2ratios was 2.0 to 3.4 for the 22 up-regulated genes and -22.8 to -1.7 for the 270
down-regulated genes (with -22.8 to -5.0 for the genesSycn,Wfdc15b,Cldn10,Shd,Higd1c,
Gpx6,Popdc3,Slc6a12, andMettl7a2). The genes are functionally associated with concentration of metal ions, lipids, proteins and steroids as well as renal impairment and failure.
Statistical analysis of gene expression patterns in the spleen identified 124 significantly regu-lated genes (FDR = 0%, fold change>1.4), all of them were down-regulated. The range of the
mean log2ratios was -3.9 to -1.5. The genes are functionally associated with inflammatory
response including proliferation/migration/movement of leukocytes, phagocytes, granulocytes and lymphocytes.
The genesAsah1,Cnot2,Ctps2,Ddx5,Lgsn,Lypla1,Mtmr2andRcan1were down-regulated in all three organs examined, the genesArmc 8,Atp6ap2,Dars,Hsd11b1,Sh3gl2,Snx14,
Tmem49,Wdr37andYme1l1were down-regulated in both brain and kidney, the geneSec22a
was down-regulated in both brain and spleen, and the genesCav2,Cd9,Cyp2b10,Mal,Pira11,
Stap1,Thbs1andVps41were down-regulated in both kidney and spleen. The genes showed a range of their mean log2ratios between -2.8 to -1.4. Despite this overlap of differential gene
expression in the organs, necrosis was found as the only gene-specific functional annotation over-represented in brain and kidney. The other enriched terms were associated with organs-specific functions.
Discussion
The recessive mutant line HST011 was established on the C3H inbred genetic background based on increased plasma urea levels, and the causative mutation was identified asPou3f3L423P
thereby affecting the highly conserved homeobox domain of the protein.Pou3f3is a transcrip-tion factor that is expressed in the central nervous system [7,19], the inner ear and some other organs like the kidney [8] during embryonic development. POU3F3 acts synergistically with SOX11 and SOX4 (http://www.uniprot.org).
Two complete POU3F3 knockout mutant mouse lines have been described to date. The first knockout mouse line was established by replacing the gene sequences which encode the first 476 amino acids with a PGK-neo cassette via homologous recombination on an unspecified genetic background [7]. The second knockout line was also established by using a PGK-neo cassette for replacing 1.2 kb of the coding region. Functional studies were performed on the mixed genetic background of 129S4/SvJae × C57BL/6J mice [8]. Heterozygous mutant mice were reported to be phenotypically normal in both knockout lines. Our heterozygous mutant mice also showed a grossly normal phenotype.Pou3f3homozygous knockout mice showed neonatal mortality. In contrast,Pou3f3L423Phomozygous mutant mice are viable and fertile; however they exhibit a reduced body weight that was about 20–25% less than that of wild-type controls.
postnatal stages. NeonatalPou3f3homozygous knockout mice did not exhibit any abnormality in the cochlea [21]. The observed morphological alterations of the canals of the vestibular organ inPou3f3L423Phomozygous mutant mice indicate thatPou3f3is important for the proper development of the vestibular organ. The observed hearing impairment also might be attributed to alterations in the postnatal functional development or maintenance of the inner ear. Thus, the observed deficits in behavioral and neurological parameters ofPou3f3L423P
homozygous mutant mice might be the consequence of the morphological alterations and neu-ronal disorganization in the forebrain described previously as well as of the vestibular
dysfunction.
One-day-oldPou3f3homozygous knockout mice have been described to show a severe retardation of the normal development of Henle’s loop, the distal convoluted tubule and the macula densa. They exhibited increased plasma urea and potassium levels with renal hypopla-sia, and died within 24 hours of birth because of renal failure. In the kidneys of heterozygous knockout mice, the expression of a number of genes that are specific for the thick ascending limb of Henle’s loop was reduced includingUmod,Nkcc2/Slc12a1,Bsnd,Kcnj1andPtger3. These results demonstrate the crucial role forPou3f3in distal tubule formation and function in the mammalian kidney [8]. We already described the appearance of lower relative kidney weights inPou3f3L423Phomozygous mutants [4].Pou3f3L423Phomozygous mutant mice showed impaired renal function indicated by increased plasma levels of urea and creatinine, alterations in plasma potassium, chloride and protein levels, as well as an increased urine vol-ume and altered renal excretion of uric acid. X-ray imaging did not reveal skeletal abnormali-ties, besides decreased body size and body weight, but bone mineral density was found to be decreased in homozygous mutants. The low bone mineralization may be a secondary effect due to kidney dysfunction. Altered bone mineralization was already found in previously described mouse lines showing impaired kidney function due to ENU induced mutations in the genes
Slc12a1[22] andUmod[23,24]. The observation of erythropenic anemia also may be a second-ary effect due to kidney dysfunction.
The analysis of energy metabolism inPou3f3L423Phomozygous mutant mice indicated reduced body temperature and reduced metabolic rate compared to wild-type controls. The results of the analysis of energy metabolism were supported by the changes of clinical chemical parameters associated with fat metabolism in homozygous mutants, namely blood lipid levels and possibly also protein concentrations. A lower body fat content was already found in previ-ously described mouse lines showing impaired kidney function due to ENU induced mutations in the genesSlc12a1[25] andUmod[23,24]. In addition, bothUmodmutant mouse lines also showed a reduced body temperature [24,26].
The multiple subtle changes in immunological parameters may be caused by a primary or secondary effect of the mutation on the immune system. Genome-wide transcriptome profiling analysis of brain, kidney and spleen ofPou3f3L423Phomozygous mutants identified signifi-cantly regulated genes as compared to wild-type controls. They have to be examined in detail in further analyses. In addition, allergy, cardiovascular and steroid analyses of the German Mouse Clinic revealed no obvious differences of mutant and control mice (data not shown). Also the histological analysis (HE staining) of the organs of 24-week-old animals showed no genotype-specific differences (data not shown).
Supporting Information
S1 Table. Time points of the phenotypic analyses for linePou3f3L423Pin the German Mouse Clinic (GMC).
(DOCX)
Acknowledgments
We thank Michael Wegner for the generous gift of anti-POU3F3 antibody. We would like to thank Reinhard Seeliger, Anke Bettenbrock, Jan Einicke, Michael Färberböck, Ralf Fischer, Tommy Fuchs, Corinne Graf, Christine Hollauer, Elfi Holupirek, Maria Kugler, Sören Kundt, Simon Orth, Florian Schleicher, Ann-Elisabeth Schwarz, Nadine Senger, Yvonne Sonntag, Bet-tina Sperling, Alida Theil, and Anja Wohlbier as well as the GMC animal caretaker team for expert technical assistance.
Author Contributions
Conceived and designed the experiments: SK BR EK SS DM TA LB JB DHB LG WH SMH MH MK TK IR JR ILVP AV AZ HF VGD MHdA EW BA. Performed the experiments: SK BR EK SS DM TA LB LG WH SMH MH IR JR ILVP AV. Analyzed the data: SK BR EK SS DM TA LB LG WH SMH MH IR JR ILVP AV. Contributed reagents/materials/analysis tools: SK BR EK SS DM TA LB JB DHB LG WH SMH MH MK TK IR JR ILVP AV AZ HF VGD MHdA EW BA. Wrote the paper: SK BA.
References
1. Hrabé de Angelis M, Michel D, Wagner S, Becker S, Beckers J (2007) Chemical mutagenesis in mice. In: Fox JG, Barthold SW, Davisson MT, Newcomer CE, Quimby FW et al., editors. The mouse in bio-medical research—v1 History, wild mice, and genetics. 2 ed. Burlington, MA: Academic Press. pp. 225–260.
2. Gailus-Durner V, Fuchs H, Becker L, Bolle I, Brielmeier M, Calzada-Wack J, et al. (2005) Introducing the German Mouse Clinic: open access platform for standardized phenotyping. Nat Methods 2: 403– 404. PMID:15908916
3. Rathkolb B, Decker T, Fuchs E, Soewarto D, Fella C, Heffner S, et al. (2000) The clinical-chemical screen in the Munich ENU Mouse Mutagenesis Project: screening for clinically relevant phenotypes. Mamm Genome 11: 543–546. PMID:10886020
4. Aigner B, Rathkolb B, Herbach N, Kemter E, Schessl C, Klaften M, et al. (2007) Screening for increased plasma urea levels in a large-scale ENU mouse mutagenesis project reveals kidney disease models. Am J Physiol Renal Physiol 292: F1560–1567. PMID:17264314
5. Hara Y, Rovescalli AC, Kim Y, Nirenberg M (1992) Structure and evolution of four POU domain genes expressed in mouse brain. Proc Natl Acad Sci U S A 89: 3280–3284. PMID:1565620
6. Sumiyama K, Washio-Watanabe K, Saitou N, Hayakawa T, Ueda S (1996) Class III POU genes: gener-ation of homopolymeric amino acid repeats under GC pressure in mammals. J Mol Evol 43: 170–178. PMID:8703082
7. McEvilly RJ, de Diaz MO, Schonemann MD, Hooshmand F, Rosenfeld MG (2002) Transcriptional regu-lation of cortical neuron migration by POU domain factors. Science 295: 1528–1532. PMID:11859196 8. Nakai S, Sugitani Y, Sato H, Ito S, Miura Y, Ogawa M, et al. (2003) Crucial roles of Brn1 in distal tubule
formation and function in mouse kidney. Development 130: 4751–4759. PMID:12925600 9. Hrabé de Angelis M, Flaswinkel H, Fuchs H, Rathkolb B, Soewarto D, Marschall S, et al. (2000)
Genome-wide, large-scale production of mutant mice by ENU mutagenesis. Nat Genet 25: 444–447. PMID:10932192
10. Friedrich RP, Schlierf B, Tamm ER, Bosl MR, Wegner M (2005) The class III POU domain protein Brn-1 can fully replace the related Oct-6 during schwann cell development and myelination. Mol Cell Biol 25: 1821–1829. PMID:15713637
12. Fuchs H, Gailus-Durner V, Neschen S, Adler T, Afonso LC, Aguilar-Pimentel JA, et al. (2012) Innova-tions in phenotyping of mouse models in the German Mouse Clinic. Mamm Genome 23: 611–622. doi: 10.1007/s00335-012-9415-1PMID:22926221
13. Gailus-Durner V, Fuchs H, Adler T, Aguilar Pimentel A, Becker L, Bolle I, et al. (2009) Systemic first-line phenotyping. Methods Mol Biol 530: 463–509. doi:10.1007/978-1-59745-471-1_25PMID:19266331 14. Nicklas W, Baneux P, Boot R, Decelle T, Deeny AA, Fumanelli M, et al. (2002) Recommendations for
the health monitoring of rodent and rabbit colonies in breeding and experimental units. Lab Anim 36: 20–42. PMID:11831737
15. Haluszczak C, Akue AD, Hamilton SE, Johnson LD, Pujanauski L, Teodorovic L, et al. (2009) The anti-gen-specific CD8+ T cell repertoire in unimmunized mice includes memory phenotype cells bearing markers of homeostatic expansion. J Exp Med 206: 435–448. doi:10.1084/jem.20081829PMID: 19188498
16. Sugitani Y, Nakai S, Minowa O, Nishi M, Jishage K, Kawano H, et al. (2002) Brn-1 and Brn-2 share cru-cial roles in the production and positioning of mouse neocortical neurons. Genes Dev 16: 1760–1765. PMID:12130536
17. Horsch M, Schadler S, Gailus-Durner V, Fuchs H, Meyer H, Hrabé de Angelis M, et al. (2008) System-atic gene expression profiling of mouse model series reveals coexpressed genes. Proteomics 8: 1248–1256. doi:10.1002/pmic.200700725PMID:18338826
18. Tusher VG, Tibshirani R, Chu G (2001) Significance analysis of microarrays applied to the ionizing radi-ation response. Proc Natl Acad Sci U S A 98: 5116–5121. PMID:11309499
19. He X, Treacy MN, Simmons DM, Ingraham HA, Swanson LW, Rosenfeld MG (1989) Expression of a large family of POU-domain regulatory genes in mammalian brain development. Nature 340: 35–41. PMID:2739723
20. Dheedene A, Maes M, Vergult S, Menten B (2014) A de novo POU3F3 deletion in a boy with intellectual disability and dysmorphic features. Mol Syndromol 5: 32–35. doi:10.1159/000356060PMID:
24550763
21. Mutai H, Nagashima R, Sugitani Y, Noda T, Fujii M, Matsunaga T (2009) Expression of Pou3f3/Brn-1 and its genomic methylation in developing auditory epithelium. Dev Neurobiol 69: 913–930. doi:10. 1002/dneu.20746PMID:19743445
22. Kemter E, Rathkolb B, Bankir L, Schrewe A, Hans W, Landbrecht C, et al. (2010) Mutation of the Na (+)-K(+)-2Cl(-) cotransporter NKCC2 in mice is associated with severe polyuria and a urea-selective concentrating defect without hyperreninemia. Am J Physiol Renal Physiol 298: F1405–1415. doi:10. 1152/ajprenal.00522.2009PMID:20219826
23. Kemter E, Prueckl P, Sklenak S, Rathkolb B, Habermann FA, Hans W, et al. (2013) Type of uromodulin mutation and allelic status influence onset and severity of uromodulin-associated kidney disease in mice. Hum Mol Genet 22: 4148–4163. doi:10.1093/hmg/ddt263PMID:23748428
24. Kemter E, Rathkolb B, Rozman J, Hans W, Schrewe A, Landbrecht C, et al. (2009) Novel missense mutation of uromodulin in mice causes renal dysfunction with alterations in urea handling, energy, and bone metabolism. Am J Physiol Renal Physiol 297: F1391–1398. doi:10.1152/ajprenal.00261.2009 PMID:19692485
25. Kemter E, Rathkolb B, Becker L, Bolle I, Busch DH, Dalke C, et al. (2014) Standardized, systemic phe-notypic analysis of Slc12a1 I299F mutant mice. J Biomed Sci 21: 68. doi:10.1186/s12929-014-0068-0 PMID:25084970
26. Kemter E, Prueckl P, Rathkolb B, Micklich K, Adler T, Becker L, et al. (2013) Standardized, systemic phenotypic analysis of Umod(C93F) and Umod(A227T) mutant mice. PLoS One 8: e78337. doi:10. 1371/journal.pone.0078337PMID:24205203