The Aberrant DNA Methylation Profile of
Human Induced Pluripotent Stem Cells Is
Connected to the Reprogramming Process
and Is Normalized During
In Vitro
Culture
Lenka Tesarova1,2
*, Pavel Simara1,2, Stanislav Stejskal1, Irena Koutna1,2
1Centre for Biomedical Image Analysis, Faculty of Informatics, Masaryk University, Brno, Czech Republic, 2International Clinical Research Center, St. Anne’s University Hospital Brno, Brno, Czech Republic
Abstract
The potential clinical applications of human induced pluripotent stem cells (hiPSCs) are lim-ited by genetic and epigenetic variations among hiPSC lines and the question of their equiv-alency with human embryonic stem cells (hESCs). We used MethylScreen technology to determine the DNA methylation profile of pluripotency and differentiation markers in hiPSC lines from different source cell types compared to hESCs and hiPSC source cells. After deri-vation, hiPSC lines compromised a heterogeneous population characterized by variable levels of aberrant DNA methylation. These aberrations were induced during somatic cell reprogramming and their levels were associated with the type of hiPSC source cells. hiPSC population heterogeneity was reduced during prolonged culture and hiPSCs acquired an hESC-like methylation profile. In contrast, the expression of differentiation marker genes in hiPSC lines remained distinguishable from that in hESCs. Taken together,in vitroculture
facilitates hiPSC acquisition of hESC epigenetic characteristics. However, differences remain between both pluripotent stem cell types, which must be considered before their use in downstream applications.
Introduction
Human pluripotent stem cells (hPSCs) have potential applications in regenerative medicine. Initial research with human embryonic stem cells (hESCs) [1] has been revolutionized by the ability to reprogram somatic cells into human induced pluripotent stem cells (hiPSCs) [2–4]. However, the utility of hPSCs is limited by variations in the genome stability of hPSC lines and in their differentiation potential [5–9]. These variations result from genetic and epigenetic dif-ferences among hPSC lines coming from genetic background and prolonged culture in hESCs and, in addition, from the reprogramming process in hiPSCs. During somatic cell reprogram-ming, genes that control pluripotency are introduced to induce pluripotent cellular properties [2–4]. The process is accompanied by epigenomic transformation, generating hiPSCs with a11111
OPEN ACCESS
Citation:Tesarova L, Simara P, Stejskal S, Koutna I (2016) The Aberrant DNA Methylation Profile of Human Induced Pluripotent Stem Cells Is Connected to the Reprogramming Process and Is Normalized DuringIn VitroCulture. PLoS ONE 11(6): e0157974. doi:10.1371/journal.pone.0157974
Editor:Majlinda Lako, University of Newcastle upon Tyne, UNITED KINGDOM
Received:February 18, 2016
Accepted:June 8, 2016
Published:June 23, 2016
Copyright:© 2016 Tesarova et al. This is an open access article distributed under the terms of the
Creative Commons Attribution License, which permits unrestricted use, distribution, and reproduction in any medium, provided the original author and source are credited.
Data Availability Statement:All relevant data are within the paper and its Supporting Information files.
Funding:This study was generously supported by Grant Agency of the Czech Republic (302/12/G157) and European Regional Development Fund (FNUSA-ICRC, No. CZ.1.05/1.1.00/02.0123).
molecular and functional characteristics similar to hESCs. Previous research comparing hiPSCs with hESCs has revealed both similarities and differences with regard to the transcriptome, genome stability, histone modification and DNA methylation [10–16].
DNA methylation is an epigenetic mechanism that regulates important biological processes, including stabilization of the pluripotent state in hPSCs, hPSC differentiation and cellular reprogramming [17,18]. The DNA methylomes of hESCs and hiPSCs have been shown to be similar on a global scale [13], though several studies have identified differences in the DNA methylation status between hESC and hiPSC lines and among hiPSC lines [13,14,19,20]. hiPSCs exhibit a unique methylation profile that is attributable to both somatic memory and aberrant DNA methylation [13,19,21–23]. Somatic memory results from the failure to completely reprogram source cell methylation patterns, which occurs late during the repro-gramming process and may remain incomplete in hiPSC lines. This incompleteness includes the insufficient silencing of source cell lineage-specific genes, as demonstrated by DNA hypo-methylation of relevant loci [12–14,22–24], and the simultaneous inactivation of genes specific for other tissues, which is associated with hypermethylation [12,13,18,21,22]. hiPSC source cell memory contributes to the methylome differences between hiPSC and hESCs and among hiPSCs from different source cells and may skew the differentiation potential of hiPSCs, favouring the source cell lineage [12,22,24]. The other source of the hiPSC methylation profile is aberrant DNA methylation induced during reprogramming; such methylation is not observed in the original source cells or equivalent hESCs. Hypermethylation is the predomi-nant form of this methylation abnormality [14], and DNA methyltransferase DNMT3B, which is upregulated in hiPSCs [25], may contribute to acquired hypermethylation [26]. Other research has suggested that hypomethylation prevails over hypermethylation in reprogram-ming-induced methylation aberrancies in CpG dinucleotides [13]. Differentially methylated regions between hESCs and hiPSC fall into two categories. These differences can be specific for individual hiPSC lines and demonstrate methylation variability among lines [13], and they can be common to multiple hiPSC lines, suggesting their predisposition toward aberrant repro-gramming. Hot spots of genes with failed epigenomic reprogramming, which are common in hiPSCs, have been identified in every hiPSC line examined [13,14,20], and a unique DNA methylation signature that distinguishes between hiPSCs and hESCs has been identified [26]. Variations in the hiPSC DNA methylome can generally be reduced through culturing [20]. In contrast, other research suggests that differentially methylated regions in hiPSCs cannot be erased by passaging and can be transmitted to differentiating cells, potentially altering their properties [13,14,27]. These findings indicate that the reprogramming variability of hiPSCs and the possible persistency of disrupted DNA methylation must be considered before hiPSCs can be successfully used for downstream applications.
We used MethylScreen technology, developed by Holemonet al. [28], to analyze the DNA
methylation profile at transcription start site (TSS)-associated CpG islands for selected pluripo-tency and differentiation markers. We compared the profiles of hiPSC lines derived from three different source cells by different reprogramming methods with the profiles of hESC lines and hiPSC source cells. The aim was to determine the extent of aberrant DNA methylation and its variation in derived hiPSC lines intended forin vitrodifferentiation studies.
Materials and Methods
Human Cell Cultures
c-Myc factors (Human STEMCCA Constitutive Polycistronic Lentivirus Reprogramming Kit; Millipore, Darmstadt, Germany; cell line CBIA-1); ii) Sendai virus containing Oct-4, Klf4, SOX-2, and c-Myc factors (CytoTuneTM-iPS Reprogramming Kit; Thermo Fisher Scientific, Waltham, MA; cell lines CBIA-3, CBIA-5); and iii) episomal vectors containing Oct-4, Klf4, SOX-2, and c-Myc and Lin28 factors (Epi5TMEpisomal iPSC Reprogramming Kit; Thermo Fisher Scientific; cell lines CBIA-7, CBIA-11) according to the manufacturer’s instructions. Source cell manipulation and the reprogramming procedure was described previously [29], ADFs were treated in the same manner as NDFs. Immunofluorescence analysis of CBIA hiPSC lines with pluripotency markersOCT4,SOX2,NANOG, andSSEA4was performed as described
[29] and all the lines were positive for these markers (S1A Fig). Teratoma forming assay proved differentiation potential of the hiPSCs into all three germ layers (S1B Fig). Other hiPSC lines (IPSCE, IPSCF and AM13 derived from NDFs by STEMCCA lentivirus reprogramming) and hESC lines (CCTL-12 and CCTL-14) [30] were kindly provided by the Department of Biology, Faculty of Medicine, Masaryk University, Brno, Czech Republic.
hPSCs were maintained on irradiated mouse embryonic fibroblasts in DMEM/F12 (1:1) medium supplemented with 20% knockout serum replacement, 2 mM L-glutamine, 100μM
non-essential amino acids, 100 U/mL penicillin-streptomycin, 0.1 mM 2-mercaptoethanol and 10 ng/mL recombinant human basic fibroblast growth factor (all from Thermo Fisher Scien-tific). hPSC colonies were manually passaged every 7 days onto fresh feeder cells. For the pur-pose of this study, passage numbers up to twenty were considered“low”, passage numbers greater than thirty-five were considered“high”. The cells were feeder depleted by culturing on GeltrexTM(Thermo Fisher Scientific) in Essential 8TMmedium (Thermo Fisher Scientific) prior to both methylation analysis and gene expression studies. NDFs (Human Dermal Fibro-blasts, neonatal; Thermo Fisher Scientific) and ADFs (derived from the ear skin of an 8-year-old boy; kindly provided by the National Tissue Centre, Brno, Czech republic) were maintained in DMEM supplemented with 20% foetal bovine serum, 2 mM L-glutamine, 100μM
non-essential amino acids, 100 U/mL penicillin-streptomycin and 0.1 mM 2-mercaptoethanol (all from Thermo Fisher Scientific). CD34+cells were isolated from PBMCs and expanded as described previously [29]. Acute myeloid leukaemia cell line KG-1 (DSMZ, Braunschweig, Ger-many) was maintained in RPMI 1640 medium supplemented with 10% foetal bovine serum.
Spontaneous differentiation of hiPSCs was induced by the formation of spin embryoid bod-ies (EBs) in BPEL medium, as previously described [31,32]. Briefly, hiPSCs were dissociated to a single-cell suspension via TrypLE Select (Thermo Fisher Scientific) treatment and plated at 3000 cells per well into low-attachment, round-bottom, 96-well plates. After two days, the gen-erated EBs were pooled and cultured in suspension in a low-attachment 35-mm culture dish for nineteen days in BPEL medium; the medium was exchanged every third day.
DNA Isolation and Restriction
Genomic DNA was isolated using DNeasy Blood & Tissue Kit (Qiagen, Hilden, Germany) according to the manufacturer’s protocol. Restriction enzymes HhaI and McrBC were used to
Table 1. hPSC lines used in this study.
hPSC group Cell line designation
hESC lines CCTL-12; CCTL-14
hiPSC lines from NDFs AM13; CBIA-1; IPSCE; IPSCF
hiPSC lines from ADFs CBIA-5; CBIA-7
hiPSC lines from PBMC CD34+cells CBIA-3; CBIA-11
digest 1μg of genomic DNA in four restriction reactions. Each 30μL reaction contained 250
ng of genomic DNA, 1x NEBuffer 2, 100μg/mL bovine serum albumin, 1 mM
guanosine-5'-tri-phosphate and HhaI alone (20 U, Rs reaction), McrBC alone (10 U, Rd reaction), HhaI and McrBC combined (Rsd reaction) or water instead of enzymes (R0 reaction). Digestions were incubated at 37°C for 6 hours followed by enzyme inactivation at 65°C for 20 minutes. The enzymes, NEBuffer 2, bovine serum albumin, and guanosine-5'-triphosphate were purchased from New England Biolabs (Ipswich, MA, USA).
MethylScreen Reactions
Restricted samples were analysed by quantitative real-time PCR with locus-specific PCR primers and SYBR Green fluorescent dye for the detection of amplified products. A set of PCR primers was designed to amplify genomic DNA at the TSS-associated CpG islands of eleven genes (Table 2). The PCR amplicons were 390 bp in length (average) and contained 5 HhaI restriction sites and 39 CpG dinucleotides. The PCR amplification was performed in a 50μL volume with
1x FastStart Universal SYBR Green Master (Roche Diagnostics, Mannheim, Germany), 300 nM of each primer and 1.25μL digested template DNA using the 7500 Real-Time PCR System
(Applied Biosystems, Foster City, CA, USA). The PCR conditions were as follows: 50°C for 2 min, 95°C for 2 min, and 45 cycles of 95°C for 15 s and 65°C for 1 min. Each qPCR reaction was performed in duplicate in a 96-well plate. To verify the amplification of desired products, melting curve analysis was performed after the reaction. Standard curve data were obtained from 5-point serial dilutions of genomic DNA, and the amplification efficiency (AE) was calculated.
Calculations of DNA Methylation Occupancy
Ct values from R0, Rs, Rd and Rsd restrictions were used to calculate the initial amount of DNA prior to PCR (AE-ct). The DNA methylation occupancy (%) was calculated as follows:
Table 2. PCR primers used for MethylScreen reactions.
Primer Sequence (5´-3´) Product size (bp) Numberof CpGs Number of HhaI restriction sites
CD34-F GTGAGACTCTGCTCTGCTGTTC 361 33 7
CD34-R GGGGAGCTCAAGTTAGTAGCAG
FOXA2-F CTAGGTGAGAGGTAGCCGCAG 367 39 7
FOXA2-R AGAGAATGAGCACTGAGAGCG
GATA2-F ACTAAGCGGCACAATCAGGAC 400 31 4
GATA2-R TTGGGCTTCTTAGGCGTGC
PAX6-F AGCCACGGTTCCCTTTTCAA 413 36 7
PAX6-R CAGCACAGAAACTTGCACCC
RUNX1-F CAAGCTAGGAAGACCGACCC 424 45 5
RUNX1-R AATCGGCTTGTTGTGATGCG
SOX2-F CCTGATTCCAGTTTGCCTCTCT 391 45 4
SOX2-R CATCTTGGGGTTCTCCTGGG
SOX17-F CCAGCTCCGGCTAGTTTTCC 446 46 4
SOX17-R CTGGTCGTCACTGGCGTATC
T-F TCTGGAAAAGGAAGGTCCGC 402 29 5
T-R CTGGGCTCCCGTTTTAGGAG
TCERG1L-F CACCCCTCTGTGAATTCGTC 372 33 5
TCERG1L-R GTTTCCTGGGTTTAGCGACC
TSPYL5-F CCCCGAGACTCTGGTACTGT 359 52 8
TSPYL5-R GAGTCCGCGCGAGATGG
UTF1-F AATTCCGACACCCATTCCCG 350 36 2
UTF1-R GCAAAGACTGGCTTCGGTTG
hypermethylated (HM) fraction = Rs/(R0-Rsd) x 100; unmethylated (UM) fraction = Rd/ (R0-Rsd) x 100; intermediately methylated (IM) fraction = 1-HM-UM. IfΔCt(Rs-R0)<1.0 or
ΔCt(Rd-R0)<1.0, the following formulas were used to calculate the fraction of hypermethy-lated or unmethyhypermethy-lated DNA, respectively: HM = 1—UM, UM = 1—HM. The fraction of DNA copies resistant to enzyme digestion was calculated as Rsd/R0 [33].
Quantitative Real-Time PCR
Total RNA was prepared with RNeasy Mini Kit (Qiagen) according to the manufacturer’s pro-tocol and treated with RNase-Free DNase (Qiagen). An RNA aliquot was reverse-transcribed into cDNA using SuperScript II Reverse Transcriptase (Thermo Fisher Scientific) and Oligo (dT)23primers (Sigma-Aldrich, St. Louis, MO) with the addition of RNasin RNase Inhibitor
(Promega, Mannheim, Germany). The cDNA template was amplified using specific primers for pluripotency and differentiation markers (Table 3). GAPDH expression was used as the control. All experiments were performed in triplicate using FastStart Universal SYBR Green Master (Roche Diagnostics) and a 7500 Real-Time PCR System (Applied Biosystems). The PCR conditions were: 50°C for 2 min, 95°C for 2 min, and 40 cycles of 95°C for 15 s and 60°C for 1 min. Relative gene expression was quantified using the AE−ΔΔCtmethod.
Results
Detection limits of MethylScreen Technology
The detection limits of the MethylScreen technology during the analysis of DNA methylation profiles were determined. The technology is based on the combined digestion of two enzymes
Table 3. PCR primers used for gene expression analysis.
Primer Sequence (5´-3´) Product size (bp)
CD34-F GCGCTTTGCTTGCTGAGT 67
CD34-R GGGTAGCAGTACCGTTGTTGT
FOXA2-F GAGCGGTGAAGATGGAAGG 118
FOXA2-R GTGTTCATGCCGTTCATCC
GAPDH-F CTGACTTCAACAGCGACAC 105
GAPDH-R CAAATTCGTTGTCATACCAGGA
GATA2-F GCACAATGTTAACAGGCCAC 127
GATA2-R CATGCACTTTGACAGCTCCT
PAX6-F TCACCATGGCAAATAACCTG 71
PAX6-R CAGCATGCAGGAGTATGAGG
POU5F1-F GGTTCTATTTGGGAAGGTATTCAG 160
POU5F1-R GGTTTCTGCTTTGCATATCTCC
NANOG-F AGATGCCTCACACGGAGACT 127
NANOG-R TTTGCGACACTCTTCTCTGC
RUNX1-F ATCGCTTTCAAGGTGGTGG 163
RUNX1-R CACTTCGACCGACAAACCT
SOX2-F TGCAGTACAACTCCATGACCA 123
SOX2-R ACTTGACCACCGAACCCA
SOX17-F CGCCGAGTTGAGCAAGAT 113
SOX17-R GGTGGTCCTGCATGTGCT
T-F AACTCCTTGCATAAGTATGAGCC 141
T-R TTTAAGAGCTGTGATCTCCTCGT
UTF1-F CGACATCGCGAACATCCT 122
UTF1-R TGCCCAGAATGAAGCCC
with opposite sensitivity to DNA methylation at CpG-rich regions [28]. Sample genomic DNA was treated in four restriction reactions during the analysis. The first reaction (Rs) consisted of the methylation-sensitive restriction enzyme HhaI cutting the DNA at GCGC sequences with-out methylcytosine. The second reaction (Rd) consisted of the methylation-dependent restric-tion enzyme McrBC recognizing a pair of methylcytosines in the form of 5’. . .A/G
mC(N 40-3000)
A/GmC. . .3’. The third reaction (R0), without any enzyme, determined the total amount of input DNA in the analysis. Both HhaI and McrBC were present in the fourth reaction (Rsd) to assess the amount of DNA amenable to analysis. The amount of DNA remaining after each restriction was quantified using qPCR with primers amplifying the region of interest. For this study, eleven genes were selected to represent markers for pluripotent cells (UTF1,SOX2),
embryonic germ layers (T,FOXA2,PAX6) and blood progenitors (SOX17,RUNX1,GATA2, CD34) as well as genes with described DNA methylation variability in hPSCs (TCERG1L,
TSPYL5) [13,14,20]. PCR primers were designed to amplify genomic DNA at the
TSS-associ-ated CpG islands of these genes. The PCR amplicons were 350–446 bp in length and contained as many as possible sites for both HhaI and McrBC to maximize the sensitivity of methylation detection (Table 2). The PCR product specificity was verified by melting curve analysis and gel electrophoresis after the reactions. The AE was determined from standard curve data (Fig 1A) and applied to calculations of the DNA methylation profile. The profile was calculated from the ratio of Ct values in R0, Rs, Rd and Rsd reactions; it is presented as a percentage of the unmethylated, intermediately methylated and hypermethylated fractions of the total DNA (Fig 1B). The assay sensitivity was conditioned by the size of the DNA population amenable to restriction and was represented byΔCt between the Rsd and R0 reactions. This analytical win-dow was from 13.3 to 21.1 (average for all analysed cell lines) for individual genes. The sensitiv-ity of the detection of DNA methylation was verified by analysing samples with an increasing ratio of DNA from cell lines with fully hypermethylated and unmethylated DNA for a given gene (Fig 1C). The ratio of unmethylated and hypermethylated DNA fraction was preserved with the addition of up to a 30% intermediately methylated DNA fraction.
Derived hiPSC Lines Are Characterized by Aberrant DNA Methylation
Profiles
MethylScreen technology was used to determine the DNA methylation profile in hPSC lines. hESCs were used to obtain a control DNA methylation profile of established hPSCs. hiPSCs were analysed early after derivation, with a passage number of less than twenty. hiPSC lines were derived from three different cell sources, NDFs, ADFs, and PBMC CD34+cells, using three different reprogramming techniques (STEMCCA lentivirus, Sendai virus, and an episomal vector). In the hESC lines, all analysed genes were unmethylated, except for the full hypermethylation ofTSPYL5(Fig 2A). hiPSCs generated from NDFs by STEMCCA lentivirus
reprogramming were characterized by an hESC-like methylation profile, with the exception of decreasedTSPYL5hypermethylation and up to 30% intermediately methylated DNA for SOX2,UTF1andCD34(Fig 2B). A variable level of intermediately methylated DNA of
ana-lysed genes was detected in hiPSC lines derived from ADFs (Fig 2C and 2D) and PBMC CD34+cells (Fig 2E and 2F) after Sendai virus (Fig 2C and 2E) and the episomal vector (Fig 2D and 2F) reprogramming. In addition, hiPSCs from ADFs displayed 100% (Sendai virus repro-gramming) and 30% (episomal vector reprorepro-gramming) hypermethylation ofTCERG1L. These
results suggest that the level of aberrant DNA methylations in hiPSCs is associated with the source cells used for their derivation.
reprogramming, the level of unmethylated DNA was high for the majority of analysed genes (Fig 3). However, this parameter was decreased in hiPSCs generated using Sendai virus as well as the episomal vector reprogramming, with an increased fraction of intermediately methylated DNA. Nonetheless, for the majority of genes the differences were characterized by a low degree of significance due to sample variability; therefore the association between the level of DNA methylation in hiPSCs and the reprogramming method was not confirmed.
The DNA methylation profiles of the source cells used for hiPSC derivation were analysed to determine the origin of aberrant hiPSC DNA methylation. Unmethylated DNA of all
Fig 1. MethylScreen technology principles and data interpretation.(A) Representative qPCR standard curve for PAX6 obtained from 100, 50, 10, 1 and 0.1 ng of control DNA per reaction. (B1)UTF1MethylScreen qPCR results for CCTL-12, IPSCF, CBIA-11, A549 and KG-1 genomes. Changes in ctbetween enzyme treated and non-treated templates are depicted: Rs-R0 is represented by white columns (HhaI reaction), Rd-R0 is represented by grey columns (McrBC reaction), and Rsd-Rd-R0 is represented by black columns (both HhaI and McrBC reaction). (B2)UTF1DNA methylation profile for five cell lines. ctvalues from four restriction reactions (B1) were converted to DNA methylation occupancy, expressed as the percentage of unmethylated (UM), intermediately methylated (IM) and hypermethylated (HM) DNA. (C) MethylScreen results obtained from sample mixtures with an increasing ratio of hypermethylated DNA (0–100%, x-axis). The colour legend is identical for (B2), and the values are averages forPAX6andTSPYL5genes after serial mixing of CCTL-14 (unmethylated) and A549 (hypermethylated) samples and NDFs (unmethylated) and CCTL-14
(hypermethylated) samples, respectively.
doi:10.1371/journal.pone.0157974.g001
Fig 2. DNA methylation profile of selected genes in hPSC lines.DNA methylation occupancy is reported as the percentage of unmethylated (UM), intermediately methylated (IM) and hypermethylated (HM) DNA. The profile is shown for hESC lines (A), hiPSC lines from NDFs (B), hiPSC lines from ADFs (C, D) and hiPSC lines from PBMC CD34+cells (E, F) generated by STEMCCA lentivirus (STE), Sendai virus (SEN) and the episomal vector (EPI) reprogramming. Values are the averages from hPSC lines within the line group where appropriate.
analysed genes was found in both NDFs and ADFs (Fig 4A), and PBMC CD34+cells were also characterized by a dominant fraction of unmethylated DNA (Fig 4B). These results demon-strate that the DNA methylation profile of source cells changed during the reprogramming process and that aberrant DNA methylation was induced.
Reprogramming-induced Aberrant DNA Methylation in hiPSCs Is
Reduced During Culturing
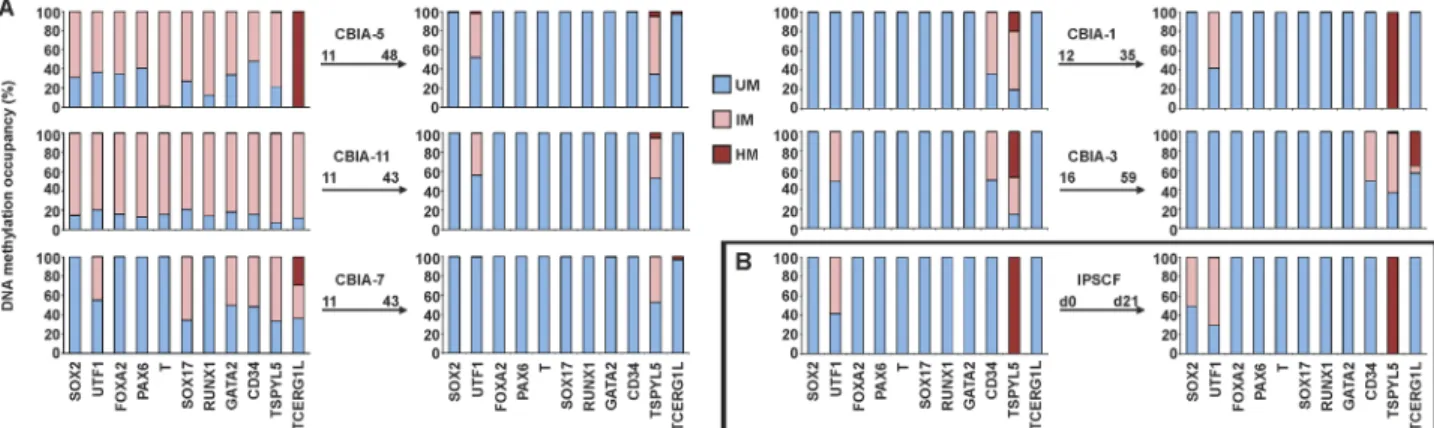
The effect of prolongedin vitroculturing on the DNA methylation profile was investigated
through the analysis of hiPSC lines after several weeks of continuous passage. The average dif-ference between low and high passages was 33.2 (±6.9) passages (Fig 5A). After this period, all analysed hiPSC lines were characterized by an hESC-like DNA methylation profile. With a sig-nificant fraction of intermediately methylated DNA after derivation, hiPSC lines decreased their methylation load during culturing. After this normalization of the DNA methylation pro-file, differences between hiPSC lines with high passage numbers and hESC lines were limited to a decreased fraction ofTSPYL5hypermethylation and up to a 30% intermediate methylation as
well as the hypermethylation ofUTF1,CD34andTCERG1Lin some hiPSC lines. Spontaneous
hiPSC differentiation, in the form of spin EBs, was induced in an hiPSC line with an hESC-like
Fig 3. DNA methylation level in hiPSC lines derived via different reprogramming techniques.The fraction of unmethylated DNA, reported as the percentage of the analysed DNA population, was determined for hiPSC lines with low passage numbers derived by STEMCCA lentivirus (white), Sendai virus (light grey) and Episomal vector (dark grey) reprogramming. Boxes extend from the 25thto the 75thpercentiles; the line in the middle and the bars represent the population median and both the minimal and maximal values, respectively. Asterisks above the grey and black boxes indicate a significant difference between white and grey and white and black boxes, respectively (*for p<0.05,**for p<0.005).
doi:10.1371/journal.pone.0157974.g003
Fig 4. DNA methylation profile of selected genes in hiPSCs source cells.DNA methylation occupancy is reported as the percentage of unmethylated (UM), intermediately methylated (IM) and hypermethylated (HM) DNA. The profile is shown for NDFs (A), ADFs (B), and PBMC CD34+cells (C).
DNA methylation profile. After three weeks of differentiation, the profile did not change, though 50% intermediately methylated DNA ofSOX2was acquired (Fig 5B).
Gene Expression Differences in hiPSCs Compared with Source Cells
and hESCs
qRT-PCR was used to compare the gene expression of pluripotency and differentiation mark-ers among the hESC lines, hiPSC lines and dermal fibroblasts (ADFs and NDFs) (Fig 6). The majority of genes were activated during hiPSC derivation, and their expression was signifi-cantly greater in hiPSCs compared with dermal fibroblasts (Fig 6A–6C). In contrast,RUNX1
andGATA2transcripts were more abundant in dermal fibroblasts (Fig 6C). Pluripotency
Fig 5. Changes in the DNA methylation profile during prolonged hiPSC culture and differentiation.DNA methylation occupancy is reported as the percentage of unmethylated (UM), intermediately methylated (IM) and hypermethylated (HM) DNA. (A) An arrow connects corresponding DNA methylation profiles of the cell line in low and high passages. Passage numbers and the hiPSC line name are reported above the arrow. (B) DNA methylation profile of the IPSCF line before (d0) and after three weeks of spontaneous differentiation (d21).
doi:10.1371/journal.pone.0157974.g005
Fig 6. Gene expression levels in hPSCs and dermal fibroblasts, as determined by quantitative real-time PCR.Expression levels of eleven genes were compared i) among the hiPSC lines, hESC lines and dermal fibroblasts (NDFs and ADFs together) (A-C) and ii) within hiPSC lines between low and high passage numbers (D-F). Analysed hiPSC lines and the passage numbers are reported in the graph legend. The values are relative to the values from hESCs (set at 1). Values are the mean + SD, and asterisks indicate the significance between indicated samples:*p<0.05;**p<0.005;***p<0.0005.
markersPOU5F1,NANOGandSOX2were actively transcribed in both hESCs and hiPSCs (Fig
6A). Differences between these two hPSC groups were found for all other analysed markers, with significantly greater expression levels in hiPSCs (Fig 6A–6C). The expression dynamic of pluripotency and differentiation markers during prolonged culturing was evaluated in CBIA-3 and CBIA-7 hiPSC lines with low and high passage numbers (Fig 6D–6F). Pluripotency mark-ers (POU5F1,NANOG,SOX2) andRUNX1were characterized by constant expression levels.
Differentiation markersPAX6,FOXA2,T,GATA2andSOX17demonstrated decreased
expres-sion in cells with high passage numbers, whereas the expresexpres-sion ofUTF1andCD34(for
CBIA-3) increased during culturing.
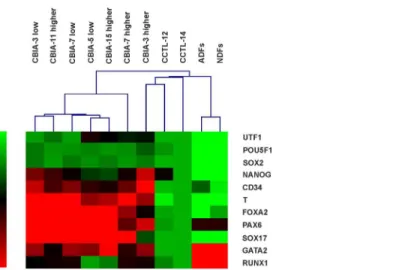
Hierarchical clustering analysis demonstrated that hiPSCs, hESCs and dermal fibroblasts can clearly be discriminated based on their gene expression profiles (Fig 7). The only exception was the fact that line CBIA-3 with a high passage number clustered with the hESC lines. The other hiPSC lines were equivalent to hESCs with regard to the expression of pluripotency markers, though other genes were overexpressed. hiPSC line gene expression profiles were also different from those of dermal fibroblasts, characterized by a lower expression level of all genes, except forGATA2andRUNX1.
To evaluate the functional significance of DNA methylation profiles, gene expression was determined for nine markers analysed for DNA methylation at TSS-associated CpG islands. Unmethylated DNA was predominant in the majority of genes in cell lines used for this analy-sis (S2 Fig) However, related genes were not expressed equally among samples, andSOX17,T
andFOXA2were not detected in dermal fibroblasts. The intermediately methylated DNA
detected in some hiPSC lines was not connected to any regular changes in the expression of related genes. No significant correlation was found between the level of DNA methylation and the relative expression of the adjacent gene.
Discussion
Controversial questions regarding the equivalency of hiPSCs with hESCs are being widely dis-cussed. In addition, genetic and epigenetic variations have been found among hPSC lines, and it is desirable to check and validate results for hPSCs on other hPSC lines in common use.
Fig 7. Hierarchical clustering of hPSC lines and dermal fibroblasts based on quantitative real-time PCR data.The colour-coded scale on the left of the picture indicates the expression value for each gene; low expression is represented by green, and high expression is represented by red. The values are relative to the values from CCTL-14 (set at 1).
Here, we analyze the DNA methylation profiles of TSS-associated CpG islands of pluripotency and differentiation markers, with a focus on the blood cell developmental lineage, to evaluate epigenetic variation in our hiPSC lines. hiPSC lines were derived from three different cell sources, including CD34+cells obtained from PBMCs.
The DNA methylation profile was analysed using MethylScreen technology [28]. This tech-nology combines the restriction from both methylation-sensitive and methylation-dependent restriction enzymes with qPCR to detect the sample DNA remaining after enzymatic treat-ment. The inclusion of two enzymes provides the density of methylcytosines in the DNA frag-ment. The detection of DNA methylation density is further supported by McrBC, which cuts the DNA at random sites within the vicinity of A/GmC [34]. Therefore, the assay can distin-guish among cell populations with different loads of unmethylated, intermediately methylated and hypermethylated DNA [28]. Holemonet al. [28] reported that a 50:50 mixture of 100%
methylated and entirely unmethylated samples can be represented as 50% of the hypermethy-lated DNA fraction and 50% of the unmethyhypermethy-lated fraction and that the varying portion of inter-mediately methylated DNA fraction was due to the heterogeneously methylated population. In our study, samples with an increasing portion of methylated DNA were analysed for the mark-ersPAX6andTSPYL5. Up to a 30% fraction of DNA was determined as being intermediately
methylated, whereas the portion of unmethylated DNA was maintained. The sensitivity of the assay enabled monitoring of the DNA methylation density when more than 99% of the DNA population in the cell line assays was amenable to digestion.
Epigenetic reprogramming is a critical event during hiPSC derivation. The DNA methyla-tion profiles of hiPSC lines shortly after derivamethyla-tion were compared with the control profile of hESCs to evaluate this phenomenon. hESCs were characterized by unmethylated DNA of all analysed genes (exceptTSPYL5), which corresponds to low DNA methylation levels in hESCs
resulted in the most homogenous hiPSC population with the lowest load of aberrant DNA methylations in analysed markers. This may correspond to more effective hiPSC reprograming using integrating transgenes in ontogenetically younger NDF source cells. NDFs are most often used for iPSC derivation because of their higher reprogramming efficiency compared with other cell types. In contrast, hiPSC reprograming of adult source cells by non-integrating meth-ods lead to a heterogeneous population with randomly methylated DNA that undergoes a lon-ger selection process to achieve a homogeneous cell line.The effect of prolonged culturing on the hiPSC methylation profile was evaluated after thirty weeks of passage. After this period, hiPSCs normalized their DNA methylation profile toward an hESC-like one. Although the dif-ferences between hESCs and hiPSC decreased, persistent difdif-ferences include intermediately methylated DNA forUTF1andTSPYL5(common to multiple hiPSC lines) and a
hypermethy-lated DNA fraction forTCERG1L(some hiPSC lines). These findings are consistent with
previ-ous reports describingTSPYL5andTCERG1Las markers with different epigenetic statuses in
hESCs and hiPSCs [13,14,20,26,40], whereasUTF1was newly identified in this study.
Con-troversial observations have been reported for whole genome studies. Similar to our findings, continuous passage diminished the methylome differences between hESCs and hiPSCs [20]. On the contrary, the number of DNA aberrant methylations was not decreased, and the epige-netic resemblance to hESCs during passages was not reported for hiPSCs [12,13]. The normal-ization of a DNA methylation profile in hiPSCs represents the reduction ofde novoaberrant
methylation and decreasing heterogeneity of the hiPSC population generated by the repro-gramming process. During culturing, hiPSC colonies were manually passaged, and cells with hPSC morphologies were favored, shifting the cell population toward a homogeneous one. Acquired hESC-like DNA methylation profile in hiPSCs did not change during three weeks of hiPSC spontaneous differentiation. Therefore, the widespread intermediately methylated DNA of hiPSCs at early passages was not caused by spontaneous differentiation in culture.
The expression status of selected markers was determined for the hESC lines, hiPSC lines and dermal fibroblasts (both NDFs and ADFs). The resulting hierarchical clustering demon-strated that hiPSCs are distinct from both hESCs and dermal fibroblasts. The increased expres-sion of all the genes (exceptRUNX1andGATA2) in hiPSCs compared with dermal fibroblasts
indicated that these genes were activated during reprogramming. Pluripotency markers
POU5F1,SOX2andNANOGwere equally expressed between the hESC and hiPSC groups,
though the expression ofUTF1was higher in hiPSCs than in hESCs.UTF1is an early-stage
indicator of successful somatic cell reprogramming, its activation is important for the derivation of mature hiPSCs, and it participates in the maintenance of bivalent gene expression [41,42]. This present study identifiedUTF1as a new marker with a DNA methylation profile and
higher compared to hESCs after the establishment of an hiPSC line. Gene expression was there-fore not found to be associated with the DNA methylation profile, suggesting the involvement of other epigenetic modifications that affect chromatin accessibility.
Conclusions
MethylScreen technology is a simple and reliable method for analysing the DNA methylation profile of CpG regions of genes of interest. Its detection capability enabled us to evaluate the degree of cellular heterogeneity within clonal hiPSC cultures. Using this technology, we deter-mined that newly derived hiPSCs were characterized by a DNA methylation profile of selected pluripotency and differentiation markers that is dissimilar from both the respective source cells and hESCs. This included aberrant DNA methylation induced during somatic cell reprogram-ming, whereas retained somatic memory was not observed. hiPSC-specific aberrant DNA methylations were detected as intermediately methylated DNA, reflecting randomly methyl-ated CpG sites in a heterogeneous hiPSC population. The level of aberrant methylation was associated with the type of source cells, and among the cell lines used in this study the lowest methylation load was found for hiPSCs generated from NDFs by STEMCCA lentivirus repro-gramming. Regardless the level of aberrant methylation in low passage numbers all hiPSC lines normalized their DNA methylation profile toward a stable hESC-like one during prolonged culture, representing the decreasing heterogeneity of the hiPSC population. In contrast, expres-sion status differences between hiPSCs and hESCs remained, indicating the involvement of gene expression-regulating mechanisms other than DNA methylation.UTF1was identified as
a new marker with a DNA methylation profile and expression profile that can discriminate between hiPSCs and hESCs. MethylScreen technology together with the selected markers rep-resents a new and affordable tool with the potential to evaluate and screen the process of the epigenetic establishment of newly derived hiPSC lines in individual laboratories. However, per-sisting gene expression differences between hiPSCs and hESCs must be considered before using these cells in downstream applications.
Supporting Information
S1 Fig. Characterization of CBIA hiPSC lines.(A) Immunofluorescence analysis of
pluripo-tency markers performed on CBIA-1 hiPSCs at passage 6 with the indicated antibodies. Cells were fixed with 4% paraformaldehyde, permeabilized in 0.2% Triton X-100 and incubated with primary antibodies Oct-3/4 mouse IgG (Santa Cruz Biotechnology), Nanog rabbit IgG (Cell Signaling Technology, Danvers, MA), Sox2 mouse IgG and SSEA4 mouse IgG (both from R&D Systems, Minneapolis, MN) overnight. The antibodies were visualised by anti-rabbit and anti-mouse IgG Alexa Fluor 488 (Cell Signaling) and the nuclei were counterstained in 1μg/
mL Hoechst (BisBenzamide H33258, (Sigma-Aldrich, St. Louis, MO). The scale bar represents 100μm. (B) In-vivo differentiation of CBIA-7 hiPSCs at passage 26 in teratomas.
Differentia-tion of hiPSCs into all three germ layers was confirmed by the presence of glandular epithelia (endoderm), melanocytes (ectoderm), and mesenchymal cells (mesoderm). The teratoma assay was performed with the kind assistance of colleagues from the Department of Histology and Embryology, Faculty of Medicine, Masaryk University Brno. Cells were injected subcutane-ously into immunodeficient mice and after 10 weeks, teratoma histology was analysed by hematoxylin/eosin staining.
(TIF)
S2 Fig. Functional significance of the DNA methylation profile in the hPSC lines and
relevant DNA methylation profile (lower panels) for hESC lines, hiPSC lines, NDFs and ADFs. hiPSC lines in low (l.) and high (h.) passage numbers are presented. Gene expression values (mean + SD) are relative to the values from CCTL-14 set at 1; DNA methylation occupancy is reported as the percentage of unmethylated (blue box) and intermediately methylated (pink box) DNA.
(TIF)
Author Contributions
Conceived and designed the experiments: LT PS IK. Performed the experiments: LT PS SS. Analyzed the data: LT PS. Contributed reagents/materials/analysis tools: IK. Wrote the paper: LT PS SS IK.
References
1. Thomson JA, Itskovitz-Eldor J, Shapiro SS, Waknitz MA, Swiergiel JJ, Marshall VS, et al. Embryonic stem cell lines derived from human blastocysts. Science. 1998; 282(5391):1145–7. PMID:9804556. 2. Takahashi K, Tanabe K, Ohnuki M, Narita M, Ichisaka T, Tomoda K, et al. Induction of pluripotent stem
cells from adult human fibroblasts by defined factors. Cell. 2007; 131(5):861–72. doi:10.1016/j.cell. 2007.11.019PMID:18035408.
3. Yu J, Vodyanik MA, Smuga-Otto K, Antosiewicz-Bourget J, Frane JL, Tian S, et al. Induced pluripotent stem cell lines derived from human somatic cells. Science. 2007; 318(5858):1917–20. doi:10.1126/ science.1151526PMID:18029452.
4. Park IH, Zhao R, West JA, Yabuuchi A, Huo H, Ince TA, et al. Reprogramming of human somatic cells to pluripotency with defined factors. Nature. 2008; 451(7175):141–6. doi:10.1038/nature06534PMID: 18157115.
5. Kang X, Yu Q, Huang Y, Song B, Chen Y, Gao X, et al. Effects of Integrating and Non-Integrating Reprogramming Methods on Copy Number Variation and Genomic Stability of Human Induced Pluripo-tent Stem Cells. PLoS One. 2015; 10(7):e0131128. doi:10.1371/journal.pone.0131128PMID: 26131765.
6. Garitaonandia I, Amir H, Boscolo FS, Wambua GK, Schultheisz HL, Sabatini K, et al. Increased risk of genetic and epigenetic instability in human embryonic stem cells associated with specific culture condi-tions. PLoS One. 2015; 10(2):e0118307. doi:10.1371/journal.pone.0118307PMID:25714340; PubMed Central PMCID: PMCPMC4340884.
7. Na J, Baker D, Zhang J, Andrews PW, Barbaric I. Aneuploidy in pluripotent stem cells and implications for cancerous transformation. Protein Cell. 2014; 5(8):569–79. doi:10.1007/s13238-014-0073-9PMID: 24899134; PubMed Central PMCID: PMCPMC4130921.
8. Feng Q, Lu SJ, Klimanskaya I, Gomes I, Kim D, Chung Y, et al. Hemangioblastic derivatives from human induced pluripotent stem cells exhibit limited expansion and early senescence. Stem Cells. 2010; 28(4):704–12. doi:10.1002/stem.321PMID:20155819.
9. Hu BY, Weick JP, Yu J, Ma LX, Zhang XQ, Thomson JA, et al. Neural differentiation of human induced pluripotent stem cells follows developmental principles but with variable potency. Proc Natl Acad Sci U S A. 2010; 107(9):4335–40. doi:10.1073/pnas.0910012107PMID:20160098; PubMed Central PMCID: PMCPMC2840097.
10. Chin MH, Pellegrini M, Plath K, Lowry WE. Molecular analyses of human induced pluripotent stem cells and embryonic stem cells. Cell Stem Cell. 2010; 7(2):263–9. doi:10.1016/j.stem.2010.06.019PMID: 20682452; PubMed Central PMCID: PMCPMC3276111.
11. Newman AM, Cooper JB. Lab-specific gene expression signatures in pluripotent stem cells. Cell Stem Cell. 2010; 7(2):258–62. doi:10.1016/j.stem.2010.06.016PMID:20682451.
12. Kim K, Zhao R, Doi A, Ng K, Unternaehrer J, Cahan P, et al. Donor cell type can influence the epigen-ome and differentiation potential of human induced pluripotent stem cells. Nat Biotechnol. 2011; 29 (12):1117–9. doi:10.1038/nbt.2052PMID:22119740; PubMed Central PMCID: PMCPMC3357310. 13. Lister R, Pelizzola M, Kida YS, Hawkins RD, Nery JR, Hon G, et al. Hotspots of aberrant epigenomic
reprogramming in human induced pluripotent stem cells. Nature. 2011; 471(7336):68–73. doi:10.1038/ nature09798PMID:21289626; PubMed Central PMCID: PMCPMC3100360.
Natl Acad Sci U S A. 2012; 109(40):16196–201. doi:10.1073/pnas.1202352109PMID:22991473; PubMed Central PMCID: PMCPMC3479609.
15. Guenther MG, Frampton GM, Soldner F, Hockemeyer D, Mitalipova M, Jaenisch R, et al. Chromatin structure and gene expression programs of human embryonic and induced pluripotent stem cells. Cell Stem Cell. 2010; 7(2):249–57. doi:10.1016/j.stem.2010.06.015PMID:20682450; PubMed Central PMCID: PMCPMC3010384.
16. Deng J, Shoemaker R, Xie B, Gore A, LeProust EM, Antosiewicz-Bourget J, et al. Targeted bisulfite sequencing reveals changes in DNA methylation associated with nuclear reprogramming. Nat Biotech-nol. 2009; 27(4):353–60. doi:10.1038/nbt.1530PMID:19330000; PubMed Central PMCID:
PMCPMC2715272.
17. Hawkins RD, Hon GC, Lee LK, Ngo Q, Lister R, Pelizzola M, et al. Distinct epigenomic landscapes of pluripotent and lineage-committed human cells. Cell Stem Cell. 2010; 6(5):479–91. doi:10.1016/j.stem. 2010.03.018PMID:20452322; PubMed Central PMCID: PMCPMC2867844.
18. Lister R, Pelizzola M, Dowen RH, Hawkins RD, Hon G, Tonti-Filippini J, et al. Human DNA methylomes at base resolution show widespread epigenomic differences. Nature. 2009; 462(7271):315–22. doi:10. 1038/nature08514PMID:19829295; PubMed Central PMCID: PMCPMC2857523.
19. Bock C, Kiskinis E, Verstappen G, Gu H, Boulting G, Smith ZD, et al. Reference Maps of human ES and iPS cell variation enable high-throughput characterization of pluripotent cell lines. Cell. 2011; 144 (3):439–52. doi:10.1016/j.cell.2010.12.032PMID:21295703; PubMed Central PMCID:
PMCPMC3063454.
20. Nishino K, Toyoda M, Yamazaki-Inoue M, Fukawatase Y, Chikazawa E, Sakaguchi H, et al. DNA meth-ylation dynamics in human induced pluripotent stem cells over time. PLoS Genet. 2011; 7(5):
e1002085. doi:10.1371/journal.pgen.1002085PMID:21637780; PubMed Central PMCID: PMCPMC3102737.
21. Doi A, Park IH, Wen B, Murakami P, Aryee MJ, Irizarry R, et al. Differential methylation of tissue- and cancer-specific CpG island shores distinguishes human induced pluripotent stem cells, embryonic stem cells and fibroblasts. Nat Genet. 2009; 41(12):1350–3. doi:10.1038/ng.471PMID:19881528; PubMed Central PMCID: PMCPMC2958040.
22. Kim K, Doi A, Wen B, Ng K, Zhao R, Cahan P, et al. Epigenetic memory in induced pluripotent stem cells. Nature. 2010; 467(7313):285–90. doi:10.1038/nature09342PMID:20644535; PubMed Central PMCID: PMCPMC3150836.
23. Ohi Y, Qin H, Hong C, Blouin L, Polo JM, Guo T, et al. Incomplete DNA methylation underlies a tran-scriptional memory of somatic cells in human iPS cells. Nat Cell Biol. 2011; 13(5):541–9. doi:10.1038/ ncb2239PMID:21499256; PubMed Central PMCID: PMCPMC3987913.
24. Bar-Nur O, Russ HA, Efrat S, Benvenisty N. Epigenetic memory and preferential lineage-specific differ-entiation in induced pluripotent stem cells derived from human pancreatic islet beta cells. Cell Stem Cell. 2011; 9(1):17–23. doi:10.1016/j.stem.2011.06.007PMID:21726830.
25. Stadtfeld M, Maherali N, Breault DT, Hochedlinger K. Defining molecular cornerstones during fibroblast to iPS cell reprogramming in mouse. Cell Stem Cell. 2008; 2(3):230–40. doi:10.1016/j.stem.2008.02. 001PMID:18371448; PubMed Central PMCID: PMCPMC3538379.
26. Huang K, Shen Y, Xue Z, Bibikova M, April C, Liu Z, et al. A panel of CpG methylation sites distin-guishes human embryonic stem cells and induced pluripotent stem cells. Stem Cell Reports. 2014; 2 (1):36–43. doi:10.1016/j.stemcr.2013.11.003PMID:24511466; PubMed Central PMCID:
PMCPMC3916755.
27. Nazor KL, Altun G, Lynch C, Tran H, Harness JV, Slavin I, et al. Recurrent variations in DNA methyla-tion in human pluripotent stem cells and their differentiated derivatives. Cell Stem Cell. 2012; 10 (5):620–34. doi:10.1016/j.stem.2012.02.013PMID:22560082; PubMed Central PMCID: PMCPMC3348513.
28. Holemon H, Korshunova Y, Ordway JM, Bedell JA, Citek RW, Lakey N, et al. MethylScreen: DNA meth-ylation density monitoring using quantitative PCR. Biotechniques. 2007; 43(5):683–93. PMID: 18072598.
29. Šimara P, Tesařová L, Padourová S, Koutná I. Generation of human induced pluripotent stem cells using genome integrating or non-integrating methods. Folia Biol (Praha). 2014; 60 Suppl 1:85–9. PMID:25369347.
30. Dvorak P, Dvorakova D, Koskova S, Vodinska M, Najvirtova M, Krekac D, et al. Expression and poten-tial role of fibroblast growth factor 2 and its receptors in human embryonic stem cells. Stem Cells. 2005; 23(8):1200–11. doi:10.1634/stemcells.2004-0303PMID:15955829.
32. Tesařová L, Simara P, Stejskal S, Koutná I. Haematopoietic developmental potential of human pluripo-tent stem cell lines. Folia Biol (Praha). 2014; 60 Suppl 1:90–4. PMID:25369348.
33. Ordway JM, Bedell JA, Citek RW, Nunberg A, Garrido A, Kendall R, et al. Comprehensive DNA methyl-ation profiling in a human cancer genome identifies novel epigenetic targets. Carcinogenesis. 2006; 27 (12):2409–23. doi:10.1093/carcin/bgl161PMID:16952911.
34. Panne D, Raleigh EA, Bickle TA. The McrBC endonuclease translocates DNA in a reaction dependent on GTP hydrolysis. J Mol Biol. 1999; 290(1):49–60. doi:10.1006/jmbi.1999.2894PMID:10388557. 35. Zhao XD, Han X, Chew JL, Liu J, Chiu KP, Choo A, et al. Whole-genome mapping of histone H3 Lys4
and 27 trimethylations reveals distinct genomic compartments in human embryonic stem cells. Cell Stem Cell. 2007; 1(3):286–98. doi:10.1016/j.stem.2007.08.004PMID:18371363.
36. Ku M, Koche RP, Rheinbay E, Mendenhall EM, Endoh M, Mikkelsen TS, et al. Genomewide analysis of PRC1 and PRC2 occupancy identifies two classes of bivalent domains. PLoS Genet. 2008; 4(10): e1000242. doi:10.1371/journal.pgen.1000242PMID:18974828; PubMed Central PMCID: PMCPMC2567431.
37. Pan G, Tian S, Nie J, Yang C, Ruotti V, Wei H, et al. Whole-genome analysis of histone H3 lysine 4 and lysine 27 methylation in human embryonic stem cells. Cell Stem Cell. 2007; 1(3):299–312. doi:10. 1016/j.stem.2007.08.003PMID:18371364.
38. Isagawa T, Nagae G, Shiraki N, Fujita T, Sato N, Ishikawa S, et al. DNA methylation profiling of embry-onic stem cell differentiation into the three germ layers. PLoS One. 2011; 6(10):e26052. doi:10.1371/ journal.pone.0026052PMID:22016810; PubMed Central PMCID: PMCPMC3189249.
39. Polo JM, Liu S, Figueroa ME, Kulalert W, Eminli S, Tan KY, et al. Cell type of origin influences the molecular and functional properties of mouse induced pluripotent stem cells. Nat Biotechnol. 2010; 28 (8):848–55. doi:10.1038/nbt.1667PMID:20644536; PubMed Central PMCID: PMCPMC3148605. 40. Chin MH, Mason MJ, Xie W, Volinia S, Singer M, Peterson C, et al. Induced pluripotent stem cells and
embryonic stem cells are distinguished by gene expression signatures. Cell Stem Cell. 2009; 5(1):111– 23. doi:10.1016/j.stem.2009.06.008PMID:19570518; PubMed Central PMCID: PMCPMC3448781. 41. Yang CS, Chang KY, Rana TM. Genome-wide functional analysis reveals factors needed at the
transi-tion steps of induced reprogramming. Cell Rep. 2014; 8(2):327–37. doi:10.1016/j.celrep.2014.07.002 PMID:25043178; PubMed Central PMCID: PMCPMC4152236.
42. Laskowski AI, Knoepfler PS. Utf1: Goldilocks for ESC bivalency. Cell Stem Cell. 2012; 11(6):732–4. doi:10.1016/j.stem.2012.11.012PMID:23217417; PubMed Central PMCID: PMCPMC3684620. 43. Silva AJ, Ward K, White R. Mosaic methylation in clonal tissue. Dev Biol. 1993; 156(2):391–8. doi:10.
1006/dbio.1993.1086PMID:8462739.