Helicobacter pylori
Seropositivity
’
s
Association with Markers of Iron, 1-Carbon
Metabolism, and Antioxidant Status among
US Adults: A Structural Equations Modeling
Approach
May A. Beydoun1*, Greg A. Dore1, Jose A. Canas2, Hind A. Beydoun3‡, Alan B. Zonderman1‡
1National Institute on Aging, NIA/NIH/IRP, Baltimore, Maryland, United States of America,2Pediatric Endocrinology, Diabetes and Metabolism Nemours Children's Clinic, Jacksonville, Florida, United States of America,3Graduate program in public health, Eastern Virginia Medical School, Norfolk, Virginia, United States of America
‡These authors are co-senior authors on this work.
Abstract
Objectives
We tested a model in which Helicobacter pylori seropositivity (Hps) predicted iron status,
which in turn acted as a predictor for markers of 1-C metabolism that were then allowed to predict antioxidant status.
Methods
National Health and Nutrition Examination Surveys (NHANES 1999–2000) cross-sectional data among adults aged 20–85 y were analyzed (n= 3,055). Markers ofHps, iron status
(serum ferritin and transferrin saturation (TS)); 1-C metabolism (serum folate (FOLserum),
B-12, total homocysteine (tHcy), methylmalonic acid (MMA)) and antioxidant status (vita-mins A and E) were entered into a structural equations model (SEM).
Results
Predictors ofHpsincluded older age, lower education and income, racial/ethnic groups (lowest
among Non-Hispanic Whites), and lifetime cigarette smoking. SEM modeling indicated that
Hpshad a direct inverse relationship with iron status (combining serum ferritin and TS) which
in turn was positively related to 1-C metabolites (higher serum folate, B-12 or lower tHcy/MMA) that were positively associated with antioxidant status (combining serum vitamins A and E). Another pathway that was found bypassed 1-C metabolites (Hps!Iron_st!Antiox). The sum of all indirect effects fromHpscombining both pathways and the other indirect pathways OPEN ACCESS
Citation:Beydoun MA, Dore GA, Canas JA,
Beydoun HA, Zonderman AB (2015)Helicobacter pyloriSeropositivity’s Association with Markers of Iron, 1-Carbon Metabolism, and Antioxidant Status among US Adults: A Structural Equations Modeling Approach. PLoS ONE 10(3): e0121390. doi:10.1371/ journal.pone.0121390
Academic Editor:Bradford D. Gessner, Agence de
Médecine Préventive, FRANCE
Received:August 28, 2014
Accepted:January 30, 2015
Published:March 27, 2015
Copyright:This is an open access article, free of all copyright, and may be freely reproduced, distributed, transmitted, modified, built upon, or otherwise used by anyone for any lawful purpose. The work is made available under theCreative Commons CC0public domain dedication.
Data Availability Statement:The study is based on publicly available data and the main repository is found at:http://www.cdc.gov/nchs/nhanes.htm.
Funding:This research was supported entirely by the Intramural Research Program of the NIH, National Institute on Aging. The funders had no role in study design, data collection and analysis, decision to publish, or preparation of the manuscript.
Competing Interests:The authors have declared
in the model (Hps!Iron_st!OneCarbon; Hps!OneCarbon!Antiox) was estimated at
β= -0.006±0.003, p<0.05.
Conclusions
In sum, of the total effect ofH.pyloriseropositivity on antioxidant status, two significant indi-rect pathways through Iron status and 1-Carbon metabolites were found. Randomized con-trolled trials should be conducted to uncover the concomitant causal effect ofH.pylori
eradication on improving iron status, folate, B-12 and antioxidant status amongH.pylori
seropositive individuals.
Introduction
Helicobacter pylori(H.pylori), a curved gram-negative bacterium found in*50% of human
gastric mucosa, is one of the most common infectious agents worldwide.[1] While sometimes incident in children, the infection can become chronic during adulthood if untreated.[2] In-deed,H.pyloriseroprevalence increases markedly with age, with low iron stores potentially protecting against chronic infection state, thus the iron deficiency anemia observed during acute infection.[3]H.pyloriinfection is linked to chronic-active gastritis,[4] and accounts for 70–90% of primary duodenal ulcers.[5] ChronicH.pyloriinfection compounded by early onset age can trigger gastric carcinoma[6] and mucosal-associated lymphoid tumor.[7] Evidence suggests that gastric mucosal damage byH.pylori[8] is mediated through excessive reactive oxygen species synthesis and apoptosis,[9] combined with deficiencies in 1-C (One Carbon) metabolites such as folate and vitamin B-12 and antioxidants. This potentially linksH.pylori
seropositivity to extra-digestive disorders, including atherosclerosis,[10] hypertension, stroke [11] and even Alzheimer’s Disease.[12,13]
However, it remains unclear whetherH.pyloriis associated with serum biomarkers previ-ously linked to atherosclerosis, stroke, Alzheimer’s Disease and metabolic disorders (e.g. iron status, 1-C metabolism and antioxidant status).[14–18] Nevertheless,H.pyloriaccute infection was directly related to iron deficiency anemia [19–22] and to poor B-vitamin status (e.g. serum folate (FOLserum) and vitamin B-12) [23–25]. Furthermore, lower (FOLserum) and B-12 status, often co-occurring with iron deficiency anemia caused by Hps,[26,27] are linked to higher serum concentrations of total homocysteine (tHcy) and methylmalonic acid (MMA).[18,28,
29] Finally, both 1-C metabolism markers (FOLserum, B-12, tHcy and MMA) are measures of either increased (tHcy, MMA) or decreased (FOLserum, B-12) oxidative stress and thus may alter antioxidant status (e.g. serum vitamins A and E).[30–32]
We used national data to test a theoretical model forHps’s association with markers of iron
Materials and Methods
Database and study participants
The National Health and Nutrition Examination Surveys (NHANES) consist of cross-sectional surveys providing nationally representative data on U.S. civilian population’s health and nutri-tional status. Initiated in the 1970s by the Nanutri-tional Center for Health Statistics (NCHS) at the Centers for Disease Control (CDC), NHANES had non-continuous waves of data before 1999, becoming a continuous survey afterwards. Sampling followed a stratified, multistage probabili-ty cluster design. It includes an in-home interview for basic health and demographic informa-tion completed by trained staff, and subsequently a health examinainforma-tion in a mobile
examination center completed by physicians, medical/health technicians, and dietary and health interviewers.(33) NHANES followed guidelines established by the Declaration of Hel-sinki, and the Institutional Review Board of the National Center for Health Statistics at the Centers for Disease Control approved all procedures involving human subjects/patients. Writ-ten or verbal informed consent was obtained from all participants; verbal consent was wit-nessed and formally recorded.[33]
We selected adults (20–85y) from the 1999–2000 wave with data onH.pyloriseropositivity (Hps) and biomarkers of interest. Among 4,880 adults (2,269 men; 2,611 women,Sample 1),
3,107 participants had complete data on diet, physical activity, smoking status, supplement use, weight, height, systolic blood pressure, medical conditions, and serum cholesterol (Sample 2). WithinSample 2, complete data on biomarkers of interest were available for 3,055 partici-pants (Sample 3).Sample 3participants selected fromSample 1were younger, more likely to be Mexican-American, above 200% of the federal poverty line, and to have greater than high school education level compared to those excluded fromSample 1. In the statistical analysis section, we describe adjustment for this selection bias, specifically the 2-stage Heckman selection model.
H
.
pylori
antibody measurement
H.pyloriIgG Enzyme-Linked Immunosorbent Assays (ELISA) was conducted by the Wampole Laboratories (Wampole). Intended for detection and qualitative determination of IgG antibod-ies toH.pyloriin human serum, this ELISA test has comparable sensitivity, specificity and re-producibility to other serological tests for antibody, such as immunofluorescence, complement fixation, hemagglutination, and radioimmunoassays.[34]
Markers of iron status
Ferritin was measured with the Bio-Rad Laboratories’sQuantImune Ferritin IRMAkit. Serum iron and total iron-binding capacity (TIBC) were measured by a modification of the automated AAII-25 colorimetric method. The transferrin percent saturation value or TS was calculated as (iron/TIBC) × 100%.[35]
Markers of 1-C metabolism
Serum folate and B-12. Both serum folate and vitamin B-12 were measured by using the
Bio-Rad Laboratories’sQuantaphase II Folate/vitamin B12radioassay kit.[36] Standard curves were prepared by using the pre-calibrated folate/B12 criteria in a human serum albumin base. Serum folate and vitamin B-12 concentrations were calculated from the standard curve.[37]
Total homocysteine. Total homocysteine (tHcy) was measured via a fluorescence
automated FPIA method. Plasma total homocysteine concentrations were calculated by the Abbott IMx Immunoassay Analyzer using a machine-stored calibration curve.[39]
MMA. MMA was extracted from plasma or serum along with an added internal standard using a commercially available strong anion exchange resin. Results were quantitated by inter-nal calibration using peak area ratios of MMA and the interinter-nal standard (d3MMA).[40]
Markers of antioxidant status: Vitamins A and E
Serum vitamin E concentrations (α- andγ-tocopherol) and vitamin A (retinol) were measured using high performance liquid chromatography (HPLC) with photodiode array detection. Quantitation was accomplished by comparing the unknown analyte’s peak height with the peak height of a known amount of the same analyte in a calibrator solution. In particular,α -andγ-tocopherol were compared with retinyl butyrate at 300 nm.[41]
Covariates
Potentially confounding covariates included: Age, sex, race/ethnicity (1 = Non-Hispanic White, 2 = Non-Hispanic Black, 3 = Mexican-American, 4 = Other race/multi-racial or Other Hispanic), education (continuous), poverty income ratio (<100%, 100–200%,>200%),
ciga-rette smoking status (smoked at least 100 cigaciga-rettes in lifetime, 0 = No, 1 = Yes), physical activi-ty (Vigorous and moderate activiactivi-ty over past 30 days), total energy intake, alcohol, caffeine, saturated fat (% energy), sodium, fiber (based on the 1 24-hr recall), use of any dietary supple-ment in the past 30 days (0, 1, 2+), Body mass index (BMI, measured weight(kg) divided by height2(m2)). Total serum cholesterol was measured enzymatically,[42] while systolic blood pressure (mm Hg.) was measured by averaging three blood pressure determinations using a mercury sphygmomanometer.[43]
Finally, an index of individuals’histories of chronic conditions was computed by summing across 16 conditions (0 = no, 1 = yes):(1)Asthma,(2)Anemia,(3)Arthritis (Rheumatoid & osteoarthritis),(4)Congestive heart failure,(5)Coronary heart disease,(6)Angina,(7)Heart attack,(8)Stroke,(9)Emphysema,(10)Goiter,(11)Thyroid disease,(12)Overweight,(13)
Chronic bronchitis,(14)Liver condition,(15)Stomach/duodenal/peptic ulcer;(16)Cancer/ malignancy.(42)
Statistical analysis
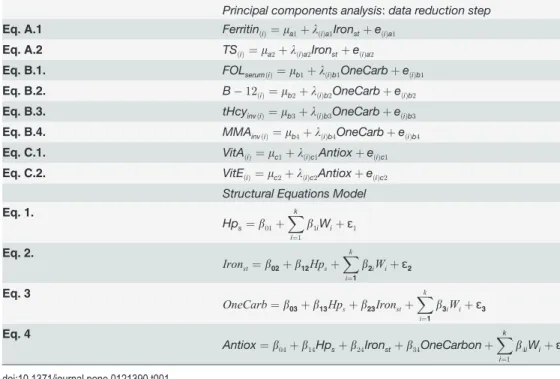
Stata survey commands[44] were used to account for sampling design complexity.[45] First, means and proportions of sample characteristics were estimated, taking into account sampling design complexity. The main part of the analysis was sub-divided into a principal components analysis (PCA) step and SEM. The PCA model defines the component scores to be estimated whereas the SEM defines relationships amongst those component scores and between the com-ponent scores and other key measured variables (Hps) and covariates (W) in the model. In the PCA step, a score on a manifest variable j obtained by an individual i can be written as a func-tion of the mean score on manifest variable j, a set of variables zilcalled component scores (in our case one common component score per model (e.g. TS is a measure of iron status and not 1-C metabolism)) with its corresponding component loading, and a residual portion eij. Worth of noting that zil(e.g.Ironst,OneCarbandAntiox) are determinate and can be estimated more
accurately as opposed to factor analysis, the residual factors eijare correlated, and the PCA model yields better fit than factor analysis to the raw data and the variances of the manifest var-iables included in the model; (Table 1). [46–48]
serum ferritin,z-score with mean zero and standard deviation of 1) which was allowed to pre-dictOneCarb(the component score from PCA model with Logetransformed serum folate, B-12 and inversely coded (×-1) Logetransformed tHcy and MMA, also az-score), which in turn were allowed to predictAntiox, the component score (z-score) reflecting antioxidant status as measured by Logetransformed vitamin A and vitamin E. Direct effects betweenHpsand (
One-Carb; Antiox),IronstandAntioxwere also retained and tested for significance at a type I error
of 0.05. In all equations, covariates‘W’(age, sex, socio-economic status, dietary factors etc.) were entered as exogenous variables and were also tested for significance at a type I error of 0.05. In one set of models, the total number of chronic medical conditions was entered while in another set of models (sensitivity analysis), each type of condition was entered separately as a covariate. A complete list and description of‘W’is found under the“Covariates”sub-heading of the methods section.
SEM fit was tested using the coefficient of determination (CD) and the standardized root mean squared residual (SRMR), the only two measures available for SEM accounting for sam-pling design complexity (i.e. svy:sem). The latter measure reflects how close we come to repro-ducing each correlation between all variables included in the SEM, on average. SRMR<0.08 for
a close fit is recommended, assuming weak to moderate correlation between variables.[49] Moreover, direct, indirect and total effects were estimated from the model with indirect effects ofHpsbeing of most interest.
Furthermore, we constructed a two-stage Heckman selection model[50], to account for po-tential selection bias. A probit model was conducted in which the main selection variable (i.e., withinSample 3vs. not, among those inSample 1) was modeled against complete sociodemo-graphic variables (i.e.,Sample 1), namely age, sex, race/ethnicity, education and poverty in-come ratio. From this model, the conditional selection probability was predicted. An inverse mills ratio, a function of that probability, was computed and entered as a covariate into the main models.[50]
Table 1. Data reduction and structural equations model.
Principal components analysis:data reduction step
Eq. A.1 FerritinðiÞ¼ma1þlðiÞa1IronstþeðiÞa1
Eq. A.2 TSðiÞ¼ma2þlðiÞa2IronstþeðiÞa2
Eq. B.1. FOLserumðiÞ¼mb1þlðiÞb1OneCarbþeðiÞb1
Eq. B.2. B 12ð
iÞ¼mb2þlðiÞb2OneCarbþeðiÞb2
Eq. B.3. tHcyinvðiÞ¼mb3þlðiÞb3OneCarbþeðiÞb3
Eq. B.4. MMAinvðiÞ¼mb4þlðiÞb4OneCarbþeðiÞb4
Eq. C.1. VitAðiÞ¼mc1þlðiÞc1AntioxþeðiÞc1
Eq. C.2. VitEðiÞ¼mc2þlðiÞc2AntioxþeðiÞc2 Structural Equations Model
Eq. 1.
Hps¼b01þ Xk
i¼1
b1iWiþɛ1
Eq. 2.
Ironst¼b02þb12Hpsþ
Xk
i¼1
b2iWiþɛ2
Eq. 3
OneCarb¼b03þb13Hpsþb23Ironstþ
Xk
i¼1
b3iWiþɛ3
Eq. 4
Antiox¼b04þb14Hpsþb24Ironstþb34OneCarbonþ Xk
i¼1
b4iWiþɛ4
Results
Study sample characteristics
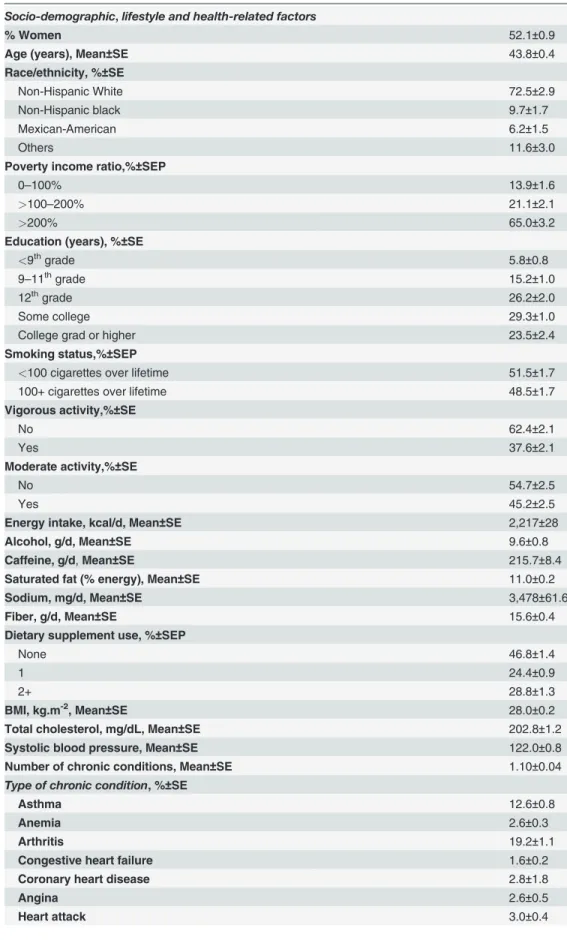
Table 2shows the characteristics of the selected sample, with means and proportion taking into account sampling design complexity. Overall, participants had a mean age of 43.8 with SE of 0.4, and around 52.1% were women. The majority of the participants were Non-Hispanic White (72.5%), with a large proportion>200% of the poverty line (65%), and around 24%
re-porting being a college graduate or higher. Around 48.5% of participants were smokers over the lifetime, and vigorous and moderate activity was reported by 38% and 45% of participants, respectively. In addition to estimated mean dietary intakes with corresponding SE, mean BMI was estimated at around 28 kg.m-2, total cholesterol at 203 mg/dL and systolic blood pressure at 122 mmg Hg. The mean number of chronic conditions were 1.10 with SE = 0.04. The most common chronic condition was overweight (29.7%), closely followed by arthritis (19.2%), asth-ma (12.6%), and stoasth-mach/duodenal/peptic ulcer (9.8%).Table 2also shows estimates of die-tary intakes of specific nutrients and of total energy intakes. Importantly, the mean value of Logetransformed H. pylori is also shown here along with the key nutritional biomarkers of in-terest in this study.
Predictors of
H
.
pylori
seropositivity
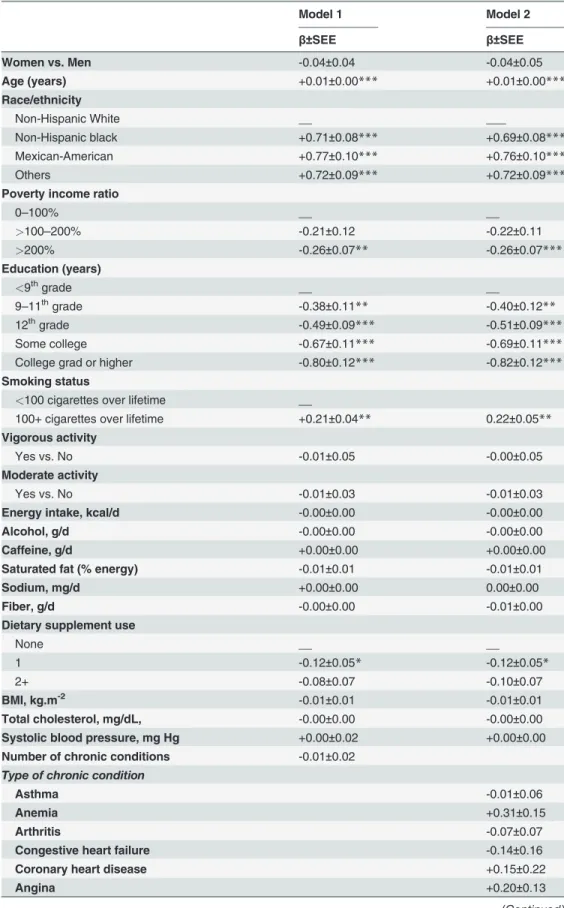
InTable 3and based on a multiple ordinary least square regression models, age was positively and independently associated with Hps. Other independent predictors included non-White race/ethnicity, lower poverty income ratio, lower level of education, being a smoker, and not using dietary supplements. None of the individual medical co-morbid conditions had a signifi-cant and independent association with Hpsbased on model 2.
Pathways linking
H
.
pylori
positivity to antioxidant status: findings for
structural equations model
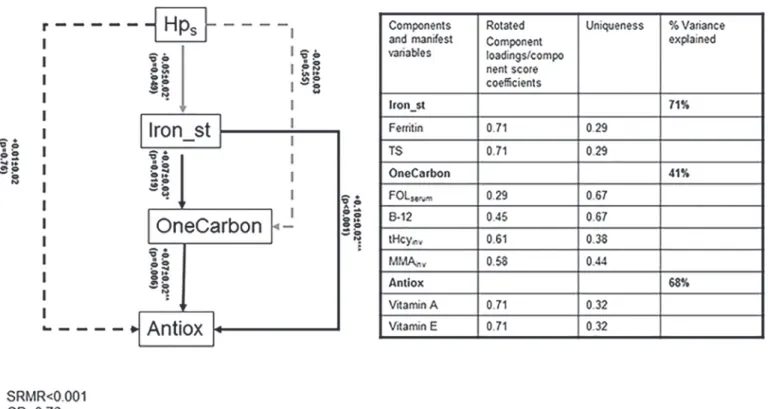
Fig. 1shows that SEM findings in the total population. Despite the lack of a direct association betweenHpsandAntiox, there were two pathways linking those biomarkers which can be
sum-marize as:[1]Hps!Iron_st(-)!OneCarbon(+)!Antiox(+);[2]Hps!Iron_st(-)!
Antiox(+). Both pathways indicate an indirect inverse relationship betweenHpsandAntiox,
even though the total effect was non-significant, given that two other pathways: (one direct (Hps!Antiox) and one indirect (Hps!OneCarbon!Antiox)), were non-significant. In general, the model had a close fit with an SRMR<0.001 and a CD of 0.76. In a sensitivity
analy-sis whereby the total number of chronic medical conditions was replaced with each condition separately, the results remained unaltered, particularly with respect to the key associations of interest.
Direct, indirect and total effects were also estimated, particularly forHps(Table 4). Most notably, the indirect effects ofHpsthrough the two main pathways described earlier along with
the other indirect pathway fromHps(Hps!OneCarbon!Antiox) leading toAntioxwas esti-mated atβ= -0.006±0.003, p<0.05. Moreover,Hpshad significant indirect effects on other
bio-markers: inverse effect onOneCarbonthroughIron_st(β= -0.004±0.002, P<0.05).Hpshad
also an inverse direct effect onIron_st(β= -0.05±0.03, p<0.05). On the other hand,Iron_st
Table 2. Study sample characteristics, NHANES 1999–2000 (N = 3,055).
Socio-demographic,lifestyle and health-related factors
% Women 52.1±0.9
Age (years), Mean±SE 43.8±0.4
Race/ethnicity, %±SE
Non-Hispanic White 72.5±2.9
Non-Hispanic black 9.7±1.7
Mexican-American 6.2±1.5
Others 11.6±3.0
Poverty income ratio,%±SEP
0–100% 13.9±1.6
>100–200% 21.1±2.1
>200% 65.0±3.2
Education (years), %±SE
<9thgrade 5.8±0.8
9–11thgrade 15.2±1.0
12thgrade 26.2±2.0
Some college 29.3±1.0
College grad or higher 23.5±2.4
Smoking status,%±SEP
<100 cigarettes over lifetime 51.5±1.7
100+ cigarettes over lifetime 48.5±1.7
Vigorous activity,%±SE
No 62.4±2.1
Yes 37.6±2.1
Moderate activity,%±SE
No 54.7±2.5
Yes 45.2±2.5
Energy intake, kcal/d, Mean±SE 2,217±28
Alcohol, g/d, Mean±SE 9.6±0.8
Caffeine, g/d,Mean±SE 215.7±8.4
Saturated fat (% energy), Mean±SE 11.0±0.2
Sodium, mg/d, Mean±SE 3,478±61.6
Fiber, g/d, Mean±SE 15.6±0.4
Dietary supplement use, %±SEP
None 46.8±1.4
1 24.4±0.9
2+ 28.8±1.3
BMI, kg.m-2, Mean
±SE 28.0±0.2
Total cholesterol, mg/dL, Mean±SE 202.8±1.2
Systolic blood pressure, Mean±SE 122.0±0.8
Number of chronic conditions, Mean±SE 1.10±0.04
Type of chronic condition, %±SE
Asthma 12.6±0.8
Anemia 2.6±0.3
Arthritis 19.2±1.1
Congestive heart failure 1.6±0.2
Coronary heart disease 2.8±1.8
Angina 2.6±0.5
Discussion
Helicobacter pyloriseropositivity is implicated in both digestive and extra-digestive chronic dis-eases. However, its link to the mediating biomarkers is largely unknown. To our knowledge, this was the first study using nationally representative data to test a model withHpspredicting
various biomarkers of iron status, 1-C metabolism and antioxidant status to explain its rela-tionship with the various chronic diseases studied. Among our key findings, SEM modeling in-dicated thatHpshad a direct inverse relationship with iron status (as measured by serum
ferritin and TS) which in turn was positively related to 1-C metabolites (higher serum folate, B-12 and lower tHcy or MMA) that were positively associated with antioxidant status (as mea-sured by serum vitamins A and E). In addition, another pathway that was found bypassed 1-C metabolites (Hps!Iron_st!Antiox). The overall model had a close fit for the
total population.
Micronutrient status in various tissues such as plasma fluctuates considerably depending on various conditions, including after meals and physical exercise, though the most marked changes are observed during the inflammatory processes of an infection.[51] In particular, serum iron’s liability to infection is evidenced by many studies examining the relationship be-tween various infectious diseases and levels of ferritin and TS among others. Biologically speak-ing, most microbes require iron in order to infect the human body, thus reducing the level of circulating iron in the blood. [51] In the specific case ofH.pylori, earlier reports suggest that among a group of anemic children, iron deficiency anemia is not corrected untilH.pylori infec-tion is completely eradicated.[19] Among older children, a placebo-controlled double-blind trial shows that the eradication ofH.pyloriinfection could lead to the resolution of iron defi-ciency anemia [20] Among adults, when 30 iron deficient patients coupled withH.pylori infec-tion were treated forH.pylori, the majority of them recovered from iron deficiency anemia. [21] A new study includes 16 randomized controlled trials (N = 956 patients) comparing
anti-H.pylori+oral iron to oral iron alone which were selected for a meta-analysis. The meta-analy-sis indicates that that the standardized mean difference (SMD) from baseline to endpoint of
Stroke 1.7±0.2
Emphysema 1.3±0.3
Goiter 0.9±0.2
Thyroid disease 6.3±0.5
Overweight 29.7±1.4
Chronic bronchitis 7.3±0.7
Liver condition 2.8±0.5
Stomach/duodenal/peptic ulcer 9.8±0.8
Cancer/malignancy 6.0±0.5
Biomarkers (Logescale),Mean±SE
H. pylori seropositivity (Hps) -0.80±0.07
Ferritin, ng/mL +4.33±0.04
TS, (%) +3.14±0.02
Vitamin B-12, pg/mL +6.12±0.01
Folate, ng/mL +2.60±0.03
Homocysteine,μmol/L +2.01±0.01
Methylmalonic acid,μmol/L -2.01±0.01
Vitamin E,μg/dL +7.07±0.01
Vitamin A,μg/dL +4.03±0.01
Table 3. Hps(Logetransformed) in relation to selected factors, ordinary least squares multiple
regres-sion models: NHANES 1999–2000 (N = 3,055).
Model 1 Model 2
β±SEE β±SEE
Women vs. Men -0.04±0.04 -0.04±0.05
Age (years) +0.01±0.00*** +0.01±0.00***
Race/ethnicity
Non-Hispanic White __ ___
Non-Hispanic black +0.71±0.08*** +0.69±0.08***
Mexican-American +0.77±0.10*** +0.76±0.10***
Others +0.72±0.09*** +0.72±0.09***
Poverty income ratio
0–100% __ __
>100–200% -0.21±0.12 -0.22±0.11
>200% -0.26±0.07** -0.26±0.07***
Education (years)
<9thgrade __ __
9–11thgrade -0.38±0.11
** -0.40±0.12**
12thgrade -0.49±0.09
*** -0.51±0.09***
Some college -0.67±0.11*** -0.69±0.11***
College grad or higher -0.80±0.12*** -0.82±0.12***
Smoking status
<100 cigarettes over lifetime __
100+ cigarettes over lifetime +0.21±0.04** 0.22±0.05**
Vigorous activity
Yes vs. No -0.01±0.05 -0.00±0.05
Moderate activity
Yes vs. No -0.01±0.03 -0.01±0.03
Energy intake, kcal/d -0.00±0.00 -0.00±0.00
Alcohol, g/d -0.00±0.00 -0.00±0.00
Caffeine, g/d +0.00±0.00 +0.00±0.00
Saturated fat (% energy) -0.01±0.01 -0.01±0.01
Sodium, mg/d +0.00±0.00 0.00±0.00
Fiber, g/d -0.00±0.00 -0.01±0.00
Dietary supplement use
None __ __
1 -0.12±0.05* -0.12±0.05*
2+ -0.08±0.07 -0.10±0.07
BMI, kg.m-2 -0.01±0.01 -0.01±0.01
Total cholesterol, mg/dL, -0.00±0.00 -0.00±0.00
Systolic blood pressure, mg Hg +0.00±0.02 +0.00±0.00
Number of chronic conditions -0.01±0.02
Type of chronic condition
Asthma -0.01±0.06
Anemia +0.31±0.15
Arthritis -0.07±0.07
Congestive heart failure -0.14±0.16
Coronary heart disease +0.15±0.22
Angina +0.20±0.13
hemoglobin, serum iron, and serum ferritin are statistically significant between the two treat-ment groups (SMD, Hemoglobin: 1.48; 95% CI, 0.96, 2.00; p<0.00001; Serum iron: 1.15; 95%
CI, 0.87, 1.43; p<0.00001; Serum ferritin: 1.84; 95% CI, 1.20, 2.48; p<0.00001, respectively).
[22] All these results are concordant with our finding thatH.pyloriseropositivity was inversely related to ferritin and TS in serum.
In the current study, we found an indirect inverse association betweenH.Pylori seropositiv-ity and indicators of 1-C metabolism (higher folate/B-12 or lower tHcy/MMA), through iron status. A recent systematic review suggests thatH.Pyloriinfection is related to reduced levels of vitamin B-12 and that eradication ofH.Pyloriinfection is accompanied by an increase in co-balamin levels. However, although an overall negative association betweenH.Pyloriinfection and folate status is observed in the meta-analysis, this association does not reach statistical sig-nificance, as results from the reviewed studies are mixed.[52] The current study lended addi-tional support to the notion thatH.Pyloriis associated with vitamin B-12 status, and was supportive of an association betweenH.Pyloriand folate status. Additionally, the current study had considerably more statistical power than previous investigations ofH.Pyloriand B-vitamin status, enabling detection of small effect sizes. Nevertheless, this study also indicated that this effect between H. pylori seropositivity and B-vitamin status was completely mediated by iron status.
It is proposed that reduced gastric acid secretion and concomitant hypochlorhydria through gastric gland atrophy leading to increased pH is the primary proposed mechanism by whichH.
Pylorimay affect absorption of cobalamin and folate.[24,52] Additionally, a reduction in levels of ascorbic acid observed inH.Pyloripatients is a suggested mechanism linkingH.Pylorito re-duced folate levels.[52,53] These hypotheses are supported by the fact that individuals treated with proton pump inhibitors may develop reduced circulating cobalamin levels.[54]
Moreover, TS<20% is often used as a confirmatory test for iron deficiency anemia,
particular-ly when serum ferritin>100ng/mLand symptoms of iron deficiency anemia are persistent. The
normal range for serum ferritin commonly used are 18–270ng/mLfor men and 18–160ng/mL
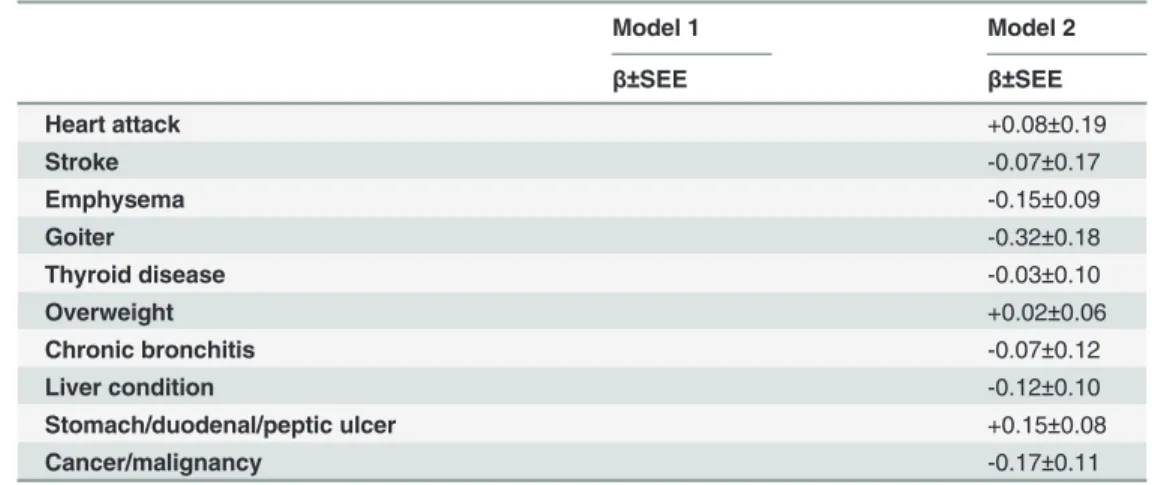
Table 3. (Continued)
Model 1 Model 2
β±SEE β±SEE
Heart attack +0.08±0.19
Stroke -0.07±0.17
Emphysema -0.15±0.09
Goiter -0.32±0.18
Thyroid disease -0.03±0.10
Overweight +0.02±0.06
Chronic bronchitis -0.07±0.12
Liver condition -0.12±0.10
Stomach/duodenal/peptic ulcer +0.15±0.08
Cancer/malignancy -0.17±0.11
*p<0.05
**p<0.01
***p<0.001
Model 1 included the number of chronic conditions, whereas Model 2 included type of chronic conditions as a covariate. All other covariates were entered into the ordinary least square models (1 and
2) simultaneously.
for women.[55] TS is also used as a diagnostic test for iron overload, with TS cut-offs used rang-ing from 45–55%.[56]
Iron overload as measured by elevated TS (50% vs.<50%) was previously linked to poor
health outcomes, including increased risk of type 2 diabetes,[57] cancer[58] and all-cause mor-tality.[59] However, two recent studies conducted on earlier NHANES waves indicate that while ferritin had no net effect on mortality, particularly CVD mortality,[60] TS was inversely related to all-cause, CVD and cancer mortality among men and post-menopausal women.[61] Ferritin is generally positively associated with vitamin B-12 status [26,27]. There is also a strong association between hyperhomocysteinemia and inadequate intake of B-vitamins, par-ticularly B-12 and folate levels.[62] Several studies, but not all, have demonstrated that chronic
H.pyloriinfection has an inverse relationship with serum levels of vitamin B12and folate.[63] In fact, vitamin B-12 serves as the cofactor for 5-Methyl tetrahydrofolate to provide the transfer of the methyl group for the conversion of Hcy to methionine. Vitamin B-12 deficiency prevents this reaction leading to folate leakage from cells.[64] Tetrahydrofolate (THF) participates in homocysteine but not methylmalonic acid (MMA) metabolism therefore both serum tHcy and MMA are markedly elevated in 96.2% of vitamin B-12 deficient patients, but MMA is elevated in only 12.2% of folate-deficient patients.[65]
Nevertheless, our key finding from those models indicated thatHpshad inverse indirect
re-lationship with antioxidant status through two main pathways:[1]Hps!Iron_st(-)!
Fig 1. Structural equations model for associations between Hps, iron status, 1-C metabolites and markers of antioxidant status (N = 3,057): NHANES 1999–00.Footnote: solid lines (p<0.05), dashed lines (p>0.05), black line (+ association between biomarkers), gray line (- association between biomarkers). Exogenous variables in model with significant associations with each of the endogenous variables (p<0.05) are listed below: Hps equation: Age (+), Black vs. White (+), Mex Am vs. White (+), Other vs. White (+), education (-), poverty income ratio(-), smoking(+), supplement use (-); Iron_st equation: Age(+), Women vs. men (-),energy(-), alcohol(+),sodium(+), BMI(-);OneCarbon equation: Age(-), Women vs. men (+), Black vs. White (+), Mex Am vs. White (+),alcohol (-), fiber (+), supplement use Antiox equation: Age(+), Women vs. Men (-), Black vs. White (-), Mex Am vs. White (-), Other vs. White (-), alcohol (+), fiber (+), supplement use (+), cholesterol (+), SBP (+), medical conditions (+).
OneCarbon(+)!Antiox(+);[2]Hps!Iron_st(-)!Antiox(+). High ROS levels due to
neu-trophil infiltration and increased oxidative DNA damage have been reported inH.pylori- in-fected patients.[9,66] Lower plasma levels of vitamins A, C and E have been detected in subjects with chronic atrophic gastritis[67] and among men with gastric dysplasia,[68] whereas large cross-sectional studies show an increased risk of gastric cancer in association with low plasma vitamin-E.[69]
To our knowledge, this is the first study to test a theoretical model for the associations be-tweenHpsand markers of iron status, 1-C metabolism biomarkers as well as markers of
antiox-idant (vitamins A and E) status using a structural equations modeling approach and nationally representative data. We obtained estimates of standardized path coefficients, adjusted for a number of potential confounders, while further correcting the analyses for sampling design complexity and selection bias. Despite its strengths, our present study has some limitations in-cluding the cross-sectional and observational nature of the data which precludes ascertainment of temporality and causal relationships. In fact, we have tested the most likely mechanism based on previous literature on biological mechanisms involved, given the stronger evidence of a direct association between H. pyori seropositivity and iron deficiency anemia. However, we do not rule out that other pathways are plausible. Nevertheless, a longitudinal study in which Hp status is linked to over-time change in the biomarkers in a sequential manner would help better verify the temporality of those associations. Nevertheless, the use of theory from previ-ous studies and biological relationships among markers allowed us to construct a model that had a close fit to our data.
In sum, of the total effect ofH.pyloriseropositivity on antioxidant status, two significant in-direct pathways through Iron status and 1-Carbon metabolites were found. Randomized con-trolled trials should be conducted to uncover the concomitant causal effect ofH.pylori
eradication on improving iron status, folate, B-12 and antioxidant status amongH.pylori
seropositive individuals.
Table 4. Total, direct and indirect effects of Hpson iron status, 1-C metabolites and antioxidant status (N = 3,057): NHANES 1999–00.
Iron_st OneCarbon Antiox
β±SEE P β±SEE P β±SEE P
X = Hps
Total effect -0.05±0.03* 0.049 -0.02±0.03 0.47 -0.00±0.02 0.94
Direct effect -0.05±0.03* 0.049 -0.02±0.03 0.55 +0.01±0.02 0.76
Indirect effect __ -0.004±0.002* 0.049 -0.006±0.003* 0.035
X = Iron_st
Total effect __ +0.07±0.03* 0.019 +0.10±0.02*** <0.001
Direct effect __ +0.07±0.03* 0.019 +0.10±0.01*** <0.001
Indirect effect __ __ +0.005±0.002* 0.019
X = OneCarbon
Total effect __ __ +0.07±0.02** 0.006
Direct effect __ __ +0.07±0.02** 0.006
Indirect effect __ __ __
*p<0.05
**p<0.01
***p<0.001.
SeeFig. 1footnote for additional control of exogenous variables.
Acknowledgments
The authors would like to thank Dr. Jessica McNeely and Dr. Mauli Shah for internal review of the manuscript.
Author Contributions
Conceived and designed the experiments: MAB. Performed the experiments: MAB. Analyzed the data: MAB. Contributed reagents/materials/analysis tools: MAB GAD JAC HAB ABZ. Wrote the paper: MAB GAD JAC HAB; ABZ. Planned analysis: MAB GAD JAC HAB ABZ. Literature search and review: MAB GAD JAC. Revised the manuscript: MAB GAD JAC HAB ABZ.
References
1. Marshall BJ, Warren JR. Unidentified curved bacilli in the stomach of patients with gastritis and peptic ulceration. Lancet. 1984; 1(8390):1311–5. Epub 1984/06/16. PubMed PMID: PMID:6145023
2. Lacy BE, Rosemore J. Helicobacter pylori: ulcers and more: the beginning of an era. The Journal of nu-trition. 2001; 131(10):2789S–93S. PubMed PMID: PMID:11584108
3. DiGirolamo AM, Perry GS, Gold BD, Parkinson A, Provost EM, Parvanta I, et al. Helicobacter pylori, anemia, and iron deficiency: relationships explored among Alaska native children. Pediatr Infect Dis J. 2007; 26(10):927–34. Epub 2007/09/29. doi:10.1097/INF.0b013e31812e52cdPubMed PMID:
17901799
4. Kudo M, Asaka M, Kato M, Katagiri M, Kagaya H, Nishikawa K, et al. Role of Helicobacter pylori in chronic gastritis: a prospective study. Journal of clinical gastroenterology. 1995; 21 Suppl 1:S174–8. PubMed PMID:8775014
5. Kate V, Ananthakrishnan N, Tovey FI. Is Helicobacter pylori Infection the Primary Cause of Duodenal Ulceration or a Secondary Factor? A Review of the Evidence. Gastroenterology research and practice. 2013; 2013:425840. doi:10.1155/2013/425840PubMed PMID:23606834; PubMed Central PMCID: PMC3623110
6. Pandey R, Misra V, Misra SP, Dwivedi M, Kumar A, Tiwari BK. Helicobacter pylori and gastric cancer. Asian Pacific journal of cancer prevention: APJCP. 2010; 11(3):583–8. PubMed PMID:21039020
7. Bayerdorffer E, Neubauer A, Rudolph B, Thiede C, Lehn N, Eidt S, et al. Regression of primary gastric lymphoma of mucosa-associated lymphoid tissue type after cure of Helicobacter pylori infection. MALT Lymphoma Study Group. Lancet. 1995; 345(8965):1591–4. PubMed PMID:7783535
8. Davies GR, Simmonds NJ, Stevens TR, Sheaff MT, Banatvala N, Laurenson IF, et al. Helicobacter py-lori stimulates antral mucosal reactive oxygen metabolite production in vivo. Gut. 1994; 35(2):179–85. Epub 1994/02/01. PubMed PMID:8307467; PubMed Central PMCID: PMC1374491
9. Ding S-Z, Minohara Y, Fan XJ, Wang J, Reyes VE, Patel J, et al. Helicobacter pylori Infection Induces Oxidative Stress and Programmed Cell Death in Human Gastric Epithelial Cells. Infection and Immuni-ty. 2007; 75(8):4030–9. doi:10.1128/iai.00172-07PMID:17562777
10. Xu Q, Schett G, Perschinka H, Mayr M, Egger G, Oberhollenzer F, et al. Serum soluble heat shock pro-tein 60 is elevated in subjects with atherosclerosis in a general population. Circulation. 2000; 102 (1):14–20. Epub 2000/07/06. PubMed PMID:10880409
11. Sawayama Y, Ariyama I, Hamada M, Otaguro S, Machi T, Taira Y, et al. Association between chronic Helicobacter pylori infection and acute ischemic stroke: Fukuoka Harasanshin Atherosclerosis Trial (FHAT). Atherosclerosis. 2005; 178(2):303–9. Epub 2005/02/08. S0021-9150(04)00458-7 [pii]doi:10. 1016/j.atherosclerosis.2004.08.025PubMed PMID:15694938
12. Kountouras J, Tsolaki M, Gavalas E, Boziki M, Zavos C, Karatzoglou P, et al. Relationship between Helicobacter pylori infection and Alzheimer disease. Neurology. 2006; 66(6):938–40. doi:10.1212/01. wnl.0000203644.68059.5fPubMed PMID:16567719
13. Beydoun MA, Beydoun HA, Shroff MR, Kitner-Triolo MH, Zonderman AB. Helicobacter pylori seroposi-tivity and cognitive performance among US adults: evidence from a large national survey. Psychoso-matic medicine. 2013; 75(5):486–96. doi:10.1097/PSY.0b013e31829108c3PubMed PMID:
23697465; PubMed Central PMCID: PMC3679320
15. Van Dam F, Van Gool WA. Hyperhomocysteinemia and Alzheimer's disease: A systematic review. Ar-chives of gerontology and geriatrics. 2009; 48(3):425–30. doi:10.1016/j.archger.2008.03.009PubMed PMID:18479766
16. Hasan N, McColgan P, Bentley P, Edwards RJ, Sharma P. Towards the identification of blood biomark-ers for acute stroke in humans: a comprehensive systematic review. British journal of clinical pharma-cology. 2012; 74(2):230–40. doi:10.1111/j.1365-2125.2012.04212.xPubMed PMID:22320313; PubMed Central PMCID: PMC3630743
17. Cheng HL, Bryant C, Cook R, O'Connor H, Rooney K, Steinbeck K. The relationship between obesity and hypoferraemia in adults: a systematic review. Obesity reviews: an official journal of the International Association for the Study of Obesity. 2012; 13(2):150–61. doi:10.1111/j.1467-789X.2011.00938.x
PubMed PMID:21981048
18. Manolescu BN, Oprea E, Farcasanu IC, Berteanu M, Cercasov C. Homocysteine and vitamin therapy in stroke prevention and treatment: a review. Acta biochimica Polonica. 2010; 57(4):467–77. PubMed PMID:21140003
19. Dufour C, Brisigotti M, Fabretti G, Luxardo P, Mori PG, Barabino A. Helicobacter pylori gastric infection and sideropenic refractory anemia. Journal of pediatric gastroenterology and nutrition. 1993; 17 (2):225–7. PubMed PMID:8229554
20. Choe YH, Kim SK, Son BK, Lee DH, Hong YC, Pai SH. Randomized placebo-controlled trial of bacter pylori eradication for iron-deficiency anemia in preadolescent children and adolescents. Helico-bacter. 1999; 4(2):135–9. PubMed PMID:10382128
21. Annibale B, Marignani M, Monarca B, Antonelli G, Marcheggiano A, Martino G, et al. Reversal of iron deficiency anemia after Helicobacter pylori eradication in patients with asymptomatic gastritis. Annals of internal medicine. 1999; 131(9):668–72. PubMed PMID:10577329
22. Yuan W, Li Y, Yang K, Ma B, Guan Q, Wang D, et al. Iron deficiency anemia in Helicobacter pylori infec-tion: meta-analysis of randomized controlled trials. Scandinavian journal of gastroenterology. 2010; 45 (6):665–76. doi:10.3109/00365521003663670PubMed PMID:20201716
23. Santarelli L, Gabrielli M, Cremonini F, Santoliquido A, Candelli M, Nista EC, et al. Atrophic gastritis as a cause of hyperhomocysteinaemia. Aliment Pharmacol Ther. 2004; 19(1):107–11. Epub 2003/12/23. 1820 [pii]. PubMed PMID:14687172
24. Epplein M, Signorello LB, Zheng W, Cai Q, Hargreaves MK, Michel A, et al. Helicobacter pylori preva-lence and circulating micronutrient levels in a low-income United States population. Cancer prevention research. 2011; 4(6):871–8. doi:10.1158/1940-6207.CAPR-10-0398PubMed PMID:21436385; PubMed Central PMCID: PMC3107911
25. Stettin D, Waldmann A, Strohle A, Hahn A. Association between Helicobacter pylori-infection, C-reac-tive protein and status of B vitamins. Advances in medical sciences. 2008; 53(2):205–13. PubMed PMID:19230307
26. de Azevedo Paiva A, Rondo PH, Guerra-Shinohara EM, Silva CS. The influence of iron, vitamin B(12), and folate levels on soluble transferrin receptor concentration in pregnant women. Clinica chimica acta; international journal of clinical chemistry. 2003; 334(1–2):197–203. PubMed PMID:12867292
27. Hershko C, Ronson A, Souroujon M, Maschler I, Heyd J, Patz J. Variable hematologic presentation of autoimmune gastritis: age-related progression from iron deficiency to cobalamin depletion. Blood. 2006; 107(4):1673–9. doi:10.1182/blood-2005-09-3534PubMed PMID:16239424
28. Bottiglieri T. Homocysteine and folate metabolism in depression. Progress in neuro-psychopharmacol-ogy & biological psychiatry. 2005; 29(7):1103–12. doi:10.1016/j.pnpbp.2005.06.021PubMed PMID:
16109454
29. Klee GG. Cobalamin and folate evaluation: measurement of methylmalonic acid and homocysteine vs vitamin B(12) and folate. Clinical chemistry. 2000; 46(8 Pt 2):1277–83. PubMed PMID:10926922
30. Papatheodorou L, Weiss N. Vascular oxidant stress and inflammation in hyperhomocysteinemia. Anti-oxidants & redox signaling. 2007; 9(11):1941–58. doi:10.1089/ars.2007.1750PubMed PMID:
17822365
31. Tchantchou F. Homocysteine metabolism and various consequences of folate deficiency. Journal of Alzheimer's disease: JAD. 2006; 9(4):421–7. PubMed PMID:16917151
32. Singh U, Devaraj S, Jialal I. Vitamin E, oxidative stress, and inflammation. Annual review of nutrition. 2005; 25:151–74. doi:10.1146/annurev.nutr.24.012003.132446PubMed PMID:16011463
33. (CDC) CfDCaP. National Health and Nutrition Examination Survey [cited 2014 September 1st]. Avail-able from:http://www.cdc.gov/nchs/nhanes.htm.
35. (CDC) CfDCaP. National Health and Nutrition Examination Survey: 1999–2000 Data Documentation, Codebook, and Frequencies: Nutritional Biochemistries (LAB06) [cited 2014 September 1st]. Available from:http://wwwn.cdc.gov/nchs/nhanes/1999-2000/LAB06.htm.
36. Instruction Manual, Bio-Rad Quantaphase II Folate Radioassay Kit. Hercules, CA: Bio-Rad Laborato-ries; 1993.
37. Centers for Disease Control and Prevention. Laboratory Procedure Manual: Folate/Vitamin B12 [cited 2013 December 6]. Available from:http://www.cdc.gov/nchs/data/nhanes/nhanes_99_00/lab06_met_ folate_b12.pdf.
38. Shipchandler MT, Moore EG. Rapid, fully automated measurement of plasma homocyst (e) ine with the Abbott IMx analyzer. Clinical chemistry. 1995; 41(7):991–4. PMID:7600701
39. Centers for Disease Control and Prevention. Laboratory Procedure Manual: Total Homocysteine (tHcy) [cited 2013 December 6]. Available from:http://www.cdc.gov/nchs/data/nhanes/nhanes_99_00/lab06_ met_homocysteine.pdf.
40. Centers for Disease Control and Prevention. Laboratory Procedure Manual: Methylmalonic Acid (MMA) [cited 2013 December 6]. Available from:http://www.cdc.gov/nchs/data/nhanes/nhanes_99_ 00/lab06_met_methylmalonic_acid.pdf.
41. Centers for Disease Control and Prevention. Laboratory Procedure Manual: Fat Soluble Micronutrients (Vitamins A, E, and Carotenoids) [cited 2013 December 6]. Available from:http://www.cdc.gov/nchs/ data/nhanes/nhanes_99_00/lab06_met_aecar.pdf.
42. Centers for Disease Control and Prevention NCfHS. 1999–2000 Data Documentation, Codebook, and Frequencies: Total Cholesterol and HDL (Lab13) 2010.
43. Perloff D, Grim C, Flack J, Frohlich ED, Hill M, McDonald M, et al. Human blood pressure determination by sphygmomanometry. Circulation. 1993; 88(5 Pt 1):2460–70. PubMed PMID:8222141
44. STATA. Statistics/Data Analysis: Release 13.0. Texas: Stata Corporation; 2013. 45. Lohr SL. Sampling: Design and Analysis, 2nd Edition 2010.
46. McCallum R. Factor Analysis, PSYC 236 coursepack. UNC Student Stores, 2004.
47. Mueller CW, Kim JO. Factor Analysis: Statistical Methods and Practical Issues. Uslaner EM, editor. London: Sage Publications; 1978.
48. Sharma S. Applied multivariate techniques. USA: Wiley; 1996.
49. Acock AC. Discovering Structural Equation Modeling using Stata. 1st ed. College Station, Texas: Sta-taCorp LP; 2013.
50. Heckman JJ. Sample selection bias as a specification error. Econometrica. 1979; 47:153–61. 51. Tomkins A. Assessing micronutrient status in the presence of inflammation. The Journal of nutrition.
2003; 133(5 Suppl 2):1649S–55S. PubMed PMID:12730480
52. Lahner E, Persechino S, Annibale B. Micronutrients (Other than iron) and Helicobacter pylori infection: a systematic review. Helicobacter. 2012; 17(1):1–15. doi:10.1111/j.1523-5378.2011.00892.xPubMed PMID:22221610
53. Salgueiro J, Zubillaga M, Goldman C, Barrado A, Martinez Sarrasague M, Leonardi N, et al. Review ar-ticle: is there a link between micronutrient malnutrition and Helicobacter pylori infection? Alimentary pharmacology & therapeutics. 2004; 20(10):1029–34. doi:10.1111/j.1365-2036.2004.02265.xPubMed PMID:15569104.
54. Howden CW. Vitamin B12 levels during prolonged treatment with proton pump inhibitors. Journal of clinical gastroenterology. 2000; 30(1):29–33. PubMed PMID:10636207.
55. Ferritin WebMD; [cited 2013 12 December].
56. Szoke D, Panteghini M. Diagnostic value of transferrin. Clinica chimica acta; international journal of clin-ical chemistry. 2012; 413(15–16):1184–9. doi:10.1016/j.cca.2012.04.021PubMed PMID:22546612
57. Ellervik C, Mandrup-Poulsen T, Andersen HU, Tybjaerg-Hansen A, Frandsen M, Birgens H, et al. Ele-vated transferrin saturation and risk of diabetes: three population-based studies. Diabetes care. 2011; 34(10):2256–8. doi:10.2337/dc11-0416PubMed PMID:21873562; PubMed Central PMCID: PMC3177722
58. Ellervik C, Tybjaerg-Hansen A, Nordestgaard BG. Risk of cancer by transferrin saturation levels and haemochromatosis genotype: population-based study and meta-analysis. Journal of internal medicine. 2012; 271(1):51–63. doi:10.1111/j.1365-2796.2011.02404.xPubMed PMID:21605201
60. Sempos CT, Looker AC, Gillum RE, McGee DL, Vuong CV, Johnson CL. Serum ferritin and death from all causes and cardiovascular disease: the NHANES II Mortality Study. National Health and Nutrition Examination Study. Annals of epidemiology. 2000; 10(7):441–8. PubMed PMID:11023623.
61. Kim KS, Son HG, Hong NS, Lee DH. Associations of serum ferritin and transferrin % saturation with all-cause, cancer, and cardiovascular disease mortality: Third National Health and Nutrition Examination Survey follow-up study. Journal of preventive medicine and public health = Yebang Uihakhoe chi. 2012; 45(3):196–203. doi:10.3961/jpmph.2012.45.3.196PubMed PMID:22712047; PubMed Central PMCID: PMC3374970
62. Stampfer MJ, Malinow MR, Willett WC, Newcomer LM, Upson B, Ullmann D, et al. A prospective study of plasma homocyst(e)ine and risk of myocardial infarction in US physicians. JAMA: the journal of the American Medical Association. 1992; 268(7):877–81. Epub 1992/08/19. PubMed PMID:1640615. 63. Rasool S, Abid S, Iqbal MP, Mehboobali N, Haider G, Jafri W. Relationship between vitamin B12, folate
and homocysteine levels and H. pylori infection in patients with functional dyspepsia: a cross-section study. BMC Res Notes. 2012; 5:206. Epub 2012/05/02. doi:10.1186/1756-0500-5-206PubMed PMID:
22546014; PubMed Central PMCID: PMC3497610
64. Ozer B, Serin E, Gumurdulu Y, Kayaselcuk F, Anarat R, Gur G, et al. Helicobacter pylori eradication lowers serum homocysteine level in patients without gastric atrophy. World J Gastroenterol. 2005; 11 (18):2764–7. Epub 2005/05/11. PubMed PMID:15884118.
65. Savage DG, Lindenbaum J, Stabler SP, Allen RH. Sensitivity of serum methylmalonic acid and total ho-mocysteine determinations for diagnosing cobalamin and folate deficiencies. Am J Med. 1994; 96 (3):239–46. Epub 1994/03/01.http://dx.doi.org/10.1016/0002-9343(94)90149-X. PubMed PMID:
8154512.
66. Sezikli M, Çetinkaya ZA, Sezikli H, Güzelbulut F, Tiftikçi A, Tüzünİnce A, et al. Oxidative Stress in Heli-cobacter pylori Infection: Does Supplementation with Vitamins C and E Increase the Eradication Rate? Helicobacter. 2009; 14(4):280–5. doi:10.1111/j.1523-5378.2009.00686.xPMID:19674132
67. Jaskiewicz K, Van Helden PD, Wiid IJ, Steenkamp HJ, Van Wyk MJ. Chronic atrophic gastritis, gastric pH, nitrites and micronutrient levels in a population at risk for gastric carcinoma. Anticancer research. 1990; 10(3):833–6. Epub 1990/05/01. PubMed PMID:2369096.
68. Haenszel W, Correa P, Lopez A, Cuello C, Zarama G, Zavala D, et al. Serum micronutrient levels in re-lation to gastric pathology. International journal of cancer Journal international du cancer. 1985; 36 (1):43–8. Epub 1985/07/15. PubMed PMID:4040496.