www.earth-syst-dynam.net/6/161/2015/ doi:10.5194/esd-6-161-2015
© Author(s) 2015. CC Attribution 3.0 License.
Effects of climate variability on savannah fire regimes
in West Africa
E. T. N’Datchoh1, A. Konaré1, A. Diedhiou2, A. Diawara1, E. Quansah3, and P. Assamoi1
1Université Félix Houphouet Boigny de Cocody, UFR des Sciences Structure de la Matière et Technologie, Laboratoire de Physique de l’Atmosphère, 22 BP 582 Abidjan 22, Côte d’Ivoire
2IRD – LTHE, Université de Grenoble, BP 53, 38041, Grenoble CEDEX 9, France 3Kwame Nkrumah University of Science and Technology, Kumasi, Ghana
Correspondence to:E. T. N’Datchoh ([email protected])
Received: 7 June 2012 – Published in Earth Syst. Dynam. Discuss.: 7 September 2012 Revised: 24 January 2015 – Accepted: 16 March 2015 – Published: 7 April 2015
Abstract. The main objective of this work is to investigate at regional scale the variability in burned areas over the savannahs of West Africa and their links with the rainfall and the large-scale climatic indexes such as the Southern Oscillation Index (SOI), Multivariate ENSO Index (MEI), North Atlantic Oscillation (NAO) and sea surface temperature gradient (SSTG). Daily satellite products (L3JRC) of burned areas from the SPOT Vegeta-tion sensor at a moderate spatial resoluVegeta-tion of 1 km×1 km between 2000 and 2007 were analyzed over the West African savannah in this paper. Results from seasonal analysis revealed a large increase in burned areas from November to February, with consistent peaks in December at the regional scale. In addition, about 30 % of the pixels are burned at least four times within the 7-year period. Positive correlations were found between burned ar-eas and rainfall values obtained from the TRMM satellite over savannahs located above 8◦
N, meaning that a wet rainfall season over these regions was favorable to biomass availability in the next dry season and therefore may induce an increase in burned areas in this region. Moreover, our results showed a nonlinear relationship between the large-scale climatic indexes SOI, MEI, NAO and SSTG and burned-area anomalies. Positive (negative) corre-lations between burned areas and SOI (MEI) were consistent over the Sahel and Sudano-Sahelian areas. Negative correlations with Atlantic SSTG were significant over the Guinea subregion. Correlations between burned areas over Sudano-Guinean subregion and all the large-scale indexes were weak and may be explained by the fact that this subregion had a mean rainfall greater than 800 mm yr−1with permanent biomass availability and an optimal amount of soil moisture favorable to fire practice irrespective of the climate conditions. The teleconnection with NAO was not clear and needed to be investigated further.
1 Introduction
Vegetation fire is an anthropic and ecological phenomenon that is influenced by climate (Andersen et al., 2003). It there-fore has an impact on biogeochemical cycles at both lo-cal and global slo-cales (Gill et al., 1990, Cook, 1992). Re-ports suggest that the globally averaged burned vegetation varies from 3.5 to 4.5×10⁶km2yr−1(Tansey et al., 2004a, b; van der Werf et al., 2006; Randerson et al., 2012). The tropical savannah ecosystems are highly productive and flammable (Bowman et al., 2009) and are characterized by
the coexistence of grasses and trees or shrubs (Scholes and Archer, 1997).
crop production, agricultural waste elimination and hunting. Lastly, they are used as a preventive tool to control or min-imize accidental fires (Abbadie et al., 2006). Depending on the timing (early, mid- or late season), the fires significantly influence the structure of the landscape (Mbow et al., 2000; Laris, 2002) and cause damage to woody plants (Louppe et al., 1995; Laris and Wardell, 2006; N’Dri et al., 2012). Thus, fires in Africa are a result of the relationship between the re-gional climate, vegetation, land use and anthropogenic activ-ities (Le Page et al., 2010). Humans set fires for their social and economic activities, and climate determines fires onset and burning times (Le Page et al., 2010). These fires affect vegetation patterns and constitute a critical determinant in the tree/grass coexistence ratio (Scholes and Archer, 1997), which suggests that fires disappear with the rate of increase in tree growth (Laris, 2011). Biomass combustion may there-fore be considered a local phenomenon. However, it becomes a regional or a global phenomenon when the combustion products are transported over long distances, depending on the nature of the chemical species, atmospheric stability and the combustion intensity (Damoah et al., 2004). At the re-gional and global scales, biomass combustion may be influ-enced by teleconnection with large-scale factors such as the El Niño–Southern Oscillation (ENSO), the North Atlantic Oscillation (NAO) and the Atlantic Multi-decadal Oscilla-tion (AMO) (Parta et al., 2005; Kitzberger et al., 2007). For instance, an El Niño event may induce changes in biomass burning through droughts, which cause vegetation to whither and hence increase their chances of catching fire. In addition, for arid and semi-arid ecosystems, grass production is limited by precipitation. Therefore an increase in rainfall as a result of an El Niño event will increase the ecosystem productivity, which will lead to accumulation of biomass, which may be susceptible to fires, especially during the following La Niña events, which cause biomass to dry (Holmgren et al., 2006).
Fuller and Murphy (2006) reported a high correlation be-tween fire events, the Southern Oscillation Index (SOI) and El Niño 3.4 index for forests located between latitudes 5.5◦
S and 5.5◦
N. Furthermore, Black (2005) revealed that the East African climate was influenced by the Indian Ocean dipole, which was itself influenced by ENSO. Lyon and Barnston (2005) also showed, on a scale-dependent basis, that ma-jor peaks in the spatial extent of mama-jor droughts and exces-sively wet conditions were generally associated with extreme phases of ENSO.
The influences of the Pacific Ocean on West African rain-fall patterns through ENSO teleconnection occur at around 3–7-year intervals (Joly and Voldoire, 2009). In addition, Hulme et al. (2001) showed that the impact of ENSO on the African climate was more pronounced in the rainy sea-sons over eastern equatorial Africa and southeastern Africa than in the Sahel. Bader and Latif (2003) showed in a mod-eling study that eastern Sahel rainfall was more sensitive to Pacific sea surface temperatures (SSTs) in the 1950s than the western Sahel. Lu and Delworth (2005) found that the Pacific
Ocean forcing was stronger than the Atlantic Ocean forcing. The complexity of the link between biomass burning activi-ties in West Africa and large-scale climatic indexes are sum-marized in Riaño et al. (2007). Other studies have shown the relationships between climate indexes and fire activities in southeastern Asia, Central and South America, and the bo-real regions of Eurasia and North America (van der Werf et al., 2004, 2006; Westerling et al., 2006). Boreal fires have been linked to ENSO, NAO, AO (Arctic Oscillation), PDO (Pacific Decadal Oscillation) and the AMO (Skinner et al., 2006; Balzter et al., 2007; Le Goff et al., 2007; Beverly et al., 2011).
Table 1. Annual mean rainfall and mean NOAA NDVI over the four sub regions.
Subregion Geographical Mean annual Mean NOAA NDVI locations rainfall (computed using the
third-(mm yr−1) generation GIMMS NDVI
from AVHRR sensors) 1 5–8◦N >1000 0.43 2 8–11◦N 800–1000 0.40 3 11–14◦N 500–800 0.32 4 14–17◦N <500 0.17
2 Data and methods
2.1 Study domain
West Africa, located between 0◦
and 17◦
N and 17◦ W and 10◦
E, constitutes our study domain. Climate in this region is governed by the south–north migration of the Intertrop-ical Convergence Zone (ITCZ), which determines the two main seasons (dry and wet) in the region. The region has a quite regular topography, with average elevation between 200 and 400 m a.s.l. (Fig. 1a) and the highest elevation of about 1752 m being in the Fouta Djalon mountain chain (located between Liberia and Guinea) (Pilecot et al., 2009). The veg-etation gradient is clearly delineated from south to north with the associated decreasing precipitation gradient (Fig. 1b). Sa-vannahs in the region are characterized by a single rainfall peak occurring during JJAS (June-July-August-September). The biomass burning pattern in this region follows the well-determined seasonal shift in ITCZ (Swap et al., 2002).
The entire region was divided into four subclimatic re-gions (Fig. 1d) according to Nicholson (2001) and Yamana and Eltahir (2013) based on the broad vegetation gradient (from forest in the southern part to the Sahelian savannah in the northern part) and the mean zonal distribution of rainfall from south to north over the region, with the aim of giving an overview of potential links between climate and variability in burned areas in these subregions. The subclimatic regions or subregions were defined as follows: subregion 1 (5–8◦
N), subregion 2 (8–11◦N), subregion 3 (11–14◦N), and subre-gion 4 (14–17◦
N). Mean rainfall and normalized difference vegetation index (NDVI) over each subregion are summa-rized in Table 1.
2.2 Data of burned areas
Data on burned areas from the SPOT Vegetation satellite sensor were obtained via the L3JRC project (Tansey et al., 2008). These data have been used in numerous studies (Pfeifer et al., 2012; Giglio et al., 2010; Chang and Song, 2009; Roy and Boschetti, 2009), and the method used for the data acquisition is described in detail by Tansey et al. (2008, 2004a, b). In this study, we used data with 1 km×1 km res-olution at daily timescale from 1 April 2000 to 31 March 2007. It was assumed for these data that burning occurred
Mean annual rainfall from TRMM 3B43 (1999
a
b
Figure 1.(a)Annual accumulated rainfall based on TRMM 3B43
data (1999–2006) and(b)mean normalized difference vegetation index (NDVI) over the regions. The boxes showing the subdivisions were made according to the climate division by Nicholson (2001).
only once on the same pixel for a given fire season (1 April yearN to 31 March of yearN+1).
2.3 Precipitation data
The precipitation data from 1999 to 2006 provided by the Tropical Rainfall Measuring Mission (TRMM) 3B43 prod-uct (Huffman et al., 1995) were used in this paper. Data ac-quisition was based on the passive and active remote sens-ing in the visible, infrared and microwave wavelength bands. The positive biases in TRMM 3B43 over African tropical for-est occur mainly during the dry season, especially over Wfor-est Africa (Adeyewa and Nakamura, 2003).
2.4 The large-scale climatic indexes
there-fore, to investigate the effects of ENSO on the variabil-ity in burned areas, we used the MEI calculated from six marine surface parameters, including mean sea-level pres-sure (MSLP), zonal and meridional wind components, SSTs, lower-layer temperatures and total cloud cover.
The Southern Oscillation Index (SOI) data used were pro-vided by NOAA and calculated following the method in Ropelewski and Jones (1987). These data, from 1948 to present, are available at http://www.esrl.noaa.gov/psd/data/ correlation/soi.data. The NAO index data, also from 1948 to present, are available from NOAA (http://www.esrl.noaa. gov/psd/data/correlation/nao.data); the north–south Atlantic sea surface temperature gradient (SSTG) is also provided by NOAA (http://www.esrl.noaa.gov/psd/data/correlation/ tna.data and http://www.esrl.noaa.gov/psd/data/correlation/ tsa.data).
2.5 Frequency of fire occurrence
The frequency of fire occurrence was calculated using Eq. (1):
F =N
T , (1)
whereN is the number of times a pixel shows burned dur-ing the study period andT is the study period (years). The fire return time (inverse of the frequency of fire occurrence) facilitated the classification of the pixels into seven classes. Class 1 pixels were those that burned only once, while the class 2–7 pixels were those that burned more than once dur-ing the study period. The average fire return time for a pixel was deduced from the frequency of fire occurrence. Table 2 summarizes the fire return times for the class 2–7 pixels as well as the percentages of each class of pixels for the entire region and also for the four subregions. Pixels with fire return times equal to or less than 24 months (classes 1–4) were re-garded as most burned pixels compared to those with a return time greater than 24 months. The 24-month interval had been chosen as the threshold of the fire return time, based on An-dreae et al. (1991), who revealed that African savannahs burn at intervals between 2 and 3 years. Furthermore, Archibald et al. (2013) characterized fires as frequent when they occur at intervals between 1 and 3 years.
2.6 Principal component analysis (PCA)
Principal component analysis (PCA) was used to investigate the potential links between the climate indexes (MEI, SOI, NAO and SSTG) and the burned areas over the four subre-gions. PCA is a statistical tool applied to a large and multi-variate data set with the purpose of reducing the dimensional-ity of a data set while retaining as much variation as possible present in the data set. Larger data sets are preferred in PCA because they tend to minimize errors due to spurious corre-lation and therefore increase the generalization of the results.
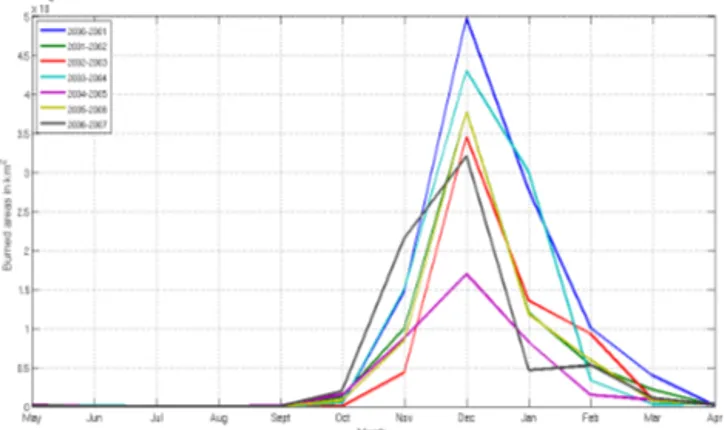
Figure 2.Intra-annual variability in burned areas at the regional scale over West Africa between 1 April 2000 and 31 March 2007.
As there were almost no burned areas during the rainy season over regions 1, 2 and 3 (Fig. 7), PCA was performed only for the months in the dry season.
The standardized anomalies of monthly burned areas for each of the four subregions were calculated for the dry months (January, February, March, October, November and December) over 7 years following Eq. (2):
Ai=
BAi−BA
σ , (2)
whereAi is the anomaly of theith month for each pixel, BAi
(km2) is the extent of the burned areas for theith month in the dry season, BA (km2) is the average of the extent of the burned area for that specific month over the entire study pe-riod, andσ (km2) is the standard deviation. For each region, PCA between anomalies of burned areas and climate indexes was carried out to investigate the large-scale conditions as-sociated with fire usage and to depict the favorable months when climate indexes and burned areas were most correlated.
3 Results
3.1 Intra-annual variability
Figure 2 shows the intra-annual variability in burned areas at regional scale over West Africa as observed during the 7 years. Burned areas were more prevalent during the dry sea-son, from October to March, and more than 96 % of annu-ally burned areas occurred between November and February. During the entire investigated period, from 2000 to 2007, the season 2004–2005 recorded the weakest burned areas, with a maximum burned area of 16 970 km2, while the sea-son 2000–2001 had the highest record of burned areas at 49 721 km2in December.
Figure 3.Intra-annual variability in burned areas for the four subregions at monthly (upper row) and weekly timescale (lower row) for subregion 1(am, aw), subregion 2(bm, bw), subregion 3(cm, cw)and subregion 4(dm, dw). For the weekly variability, there were a few burned areas detected between week 1 and week 7 which are not presented in this graph. Note that axis bounds vary between subregions.
burned areas, as this region was primarily a forest region. In this region, the fire season starts in late November and ends in April (Fig. 3am). The variation at weekly time scale showed that there were 2–3 fire peaks occurring between December and February (Fig. 3aw), depending on the year.
Intra-annual variability in burned areas over the Guinean savannah (subregion 2) is shown in Figs. 3bm and bw. This is a region with a strong record of burned areas, starting from October and ending in April, with a constant peak in De-cember (Fig. 3bm). The evolution on the weekly timescale showed that there were three peaks during the fire season, with the second peak being generally more intense than the other two, except for the 2003–2004 season (Fig. 3bw).
Figure 3cm shows that subregion 3, characterized by the Sudanian savannah, was the region where burned-area peaks were slightly more variable between November and January compared to subregion 2. The fire season started earlier in September and ended in April. The extents of burned ar-eas were weak compared to subregion 2, and this region re-vealed at least three burned-area peaks during the fire season (Fig. 3cw).
Subregion 4 largely represented the Sahel, where burned areas appeared earlier in September, with a peak in Novem-ber and at the end of the fire season between January and February (Fig. 3dm). The weekly evolution of burned areas showed that there were at most two peaks of short duration mainly between October and November (Fig. 3dw).
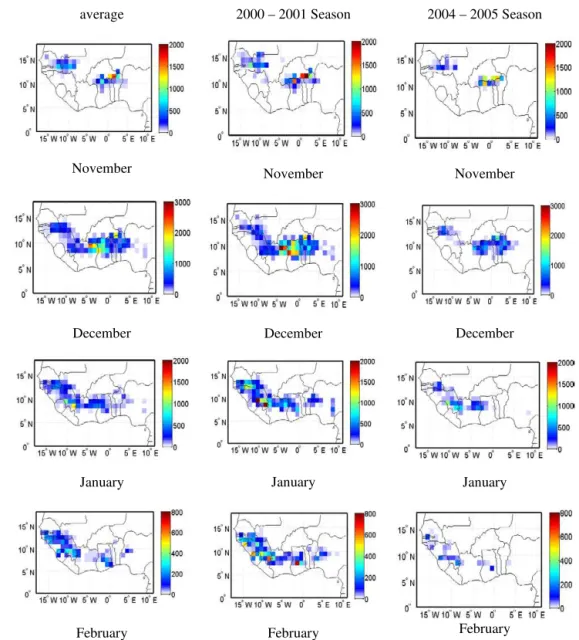
Figure 4 shows the spatial variability in burned areas from November to February for the mean of the 7 years (left col-umn) and for two contrasting years, with high record of burned area between 2000 and 2001 (middle column) and weak record of burned areas between 2004 and 2005 (right column). Fires over West Africa were located between lati-tudes 5–17◦
N and longitudes 17◦ W–10◦
E.
average 2000 – 2001 Season 2004 – 2005 Season
November November November
December December December
January January January
February February February
Figure 4.Spatial variability in burned areas (km2) from November to February for the mean of the 7 years (left column) and for two
contrasting years: high fire activity in 2000–2001 (middle column) and weak fire activity in 2004–2005 (right column).
The comparison of an intense period (2000–2001) and a weak period (2004–2005) showed that these two contrasting periods had the same spatial distribution of burned areas, but in the latter the surfaces of burned areas were smaller, espe-cially over the first cluster observed in November in the south of Burkina Faso, the northeast of Côte d’Ivoire, and the cen-tral and northern areas of the Ghana–Togo–Benin area, as well as in January over the second cluster in the southeast of Senegal and the northwest of Guinea. The season was also shorter during this time than during the intense period, espe-cially over the cluster of Togo, Benin and Nigeria. During the active year 2000–2001, burned areas were also found over the west of Nigeria in January and February, while during the weak year 2004–2005 the fire season ends in November in this region. During the weak season 2004–2005, the fire
season in the west and the north of Guinea started late in De-cember and ended in February.
Figure 5.Mean spatial distribution of early fires that occurred in(a)October and late fires that appeared in(b)March and(c)April between 2000 and 2007.
3.2 Fire occurrence frequency
Figure 6a shows the number of the times that a pixel had been burned over the study period. This figure has been summarized in Table 2 to indicate the frequency of fire oc-currences and to suggest that approximately 28 % of West African burned areas occurred only once during the study pe-riod, 56 % burned between 2 and 3 times, and the remaining 16 % burned between 5 and 7 times, while 2 % of pixels were burned every year. The results showed that the percentages of burned areas decreased with fire occurrences. Fire frequency and return time as defined in Sect. 3.5 were used to distin-guish between more burned and less burned areas (Fig. 6b). The most burned areas were predominantly located in sub-regions 2 and 3, where they represented respectively 32 and 32.2 % of the total burned areas, while subregions 1 and 4 yielded 6.6 and 4 %, respectively (Table 2). In subregion 3, the most frequently burned areas were located mainly in the west, represented on the cluster at southeast Senegal, west of Mali and northeast of Guinea. In region 2, these most burned areas were found everywhere, from the west of Guinea to Togo, with a peak in northern Ghana and the west of Côte d’Ivoire.
Over the Sahel, the usage of fire was mainly important at the western sides of Mali and Senegal. The practice of light-ing fires was mainly important over Guinean and Sudanian savannas in areas located in southeast of Burkina Faso and in the northern part of the Côte d’Ivoire–Ghana border.
3.3 Interannual variability
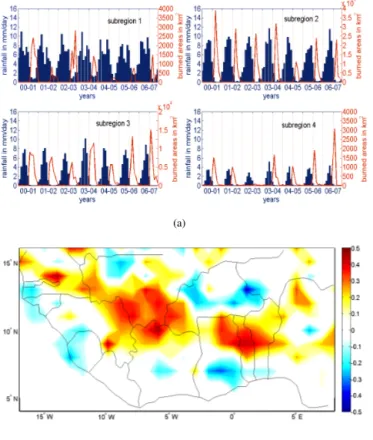
Figure 7 shows the interannual variability in burned areas for the four West African subregions. Subregions 2 and 3 had larger burned areas than subregions 1 and 4. Subregion 1 had the highest interannual variability compare to the others. The two seasons of intense fire activities (during 2000–2001 and 2002–2003, with 7009 with 5401 km2 of burned area, respectively) were separated by a season of lesser burned ar-eas (2001–2002). The minimum sar-eason was also found to be during 2004–2005, with 586 km2of burned area.
Subregion 2 was the region where fire activity was more important in West Africa, and showed the least variability during the study period, with maximums during 2000–2001
(a)
(b)
Figure 6.(a)Number of the times that the same pixel has been
burned over the study period.(b)Map of the most burned pixels (in red).
and 2003–2004 of 67 172 and 53 359 km2, respectively, and a minimum of 21 052 km2during 2004–2005.
Subregions 3 and 4 had the same interannual variability with a decrease in the burned areas from 2000–2001 to 2002– 2003 with values of 15 097 and 229 km2, respectively. Af-ter 2003–2004, while subregion 3 burned-area amount re-mained stable, subregion 4 had increased substantially from 1799 km2in 2004–2005 to 4805 km2in 2006–2007.
3.4 Burned areas and climate factors
Table 2.Fire return time on the same pixels where fire occurred more than once between 1 April 2000 and 31 March 2007. Their proportions (%) are given in parentheses.
Class 1 Class 2 Class 3 Class 4 Class 5 Class 6 Class 7
Pixels burned
Once 2 times 3 times 4 times 5 times 6 times 7 times
Average return time – 42 months 28 months 21 months 17 months 14 months 12 months
Burned area in km2 140 883 117 114 93 684 69 168 46 255 25 398 9905 (% of West Africa region) (28.0 %) (23.3 %) (18.6 %) (13.8 %) (9.2 %) (5.0 %) (2.0 %)
Burned area in km2 12 780 5434 1797 628 165 18 0
(% of subregion 1) (61.4 %) (26.1 %) (8.6 %) (3 %) (0.8 %) (0.1 %) (0.0 %)
Burned area in km2 73 581 68 636 58 263 44 524 30 060 15 204 4445 Region 2 (25.0 %) (23.3 %) (19.8 %) (15.1 %) (10.2 %) (5.2 %) (1.5 %)
Burned area in km2 44 334 38 966 31 548 23 172 15 760 10 122 5453 (% of subregion 3) (26.2 %) (23.0 %) (18.6 %) (13.7 %) (9.3 %) (6.0 %) (3.2 %)
Burned area in km2 10 188 4078 2076 844 270 54 7
(% of subregion 4) (58.2 %) (23.3 %) (11.8 %) (4.8 %) (1.5 %) (0.3 %) (0.04 %)
(Fig. 8b), an indication that the bipolar rainfall season with associated high humidity was not favorable to a wide usage of fire. The negative correlation exhibit in Fig. 8b revealed that the high rainfall amount inhibited burned areas. Further-more, the bipolar rainfall pattern also reduced the fire season length as well as the extent of burning when fires occurred. However, for subregion 1 (forest), the correlations were gen-erally negative and weak, meaning that a wet rainfall sea-son was associated with high humidity, which was not fa-vorable to a wide usage of fire. Furthermore, the above fac-tors acted to suppress the spread of fire when it occurred. In subregions 2 and 3, annual rainfall amount was enough to support biomass availability (Fig. 3). However, year-to-year variability in fires was predominantly controlled by human activities. For instance, Fig. 8b shows that both significantly positive and negative correlations were found between rain-fall and burned areas, which could mean that human activities caused the fires, since rainfall amount over the region was the same. Therefore, areas where human activities induced or inhibited fires would have positive or negative correla-tion, respectively. Concerning subregion 4, the lowest rainfall amount occurring in this region inhibited burned areas by in-fluencing biomass availability (Fig. 8a). Here, there were also both negative and positive correlations between burned areas and rainfall (Fig. 8b). This showed that, even in areas with limited rainfall, human activities still controlled year-to-year variability in burned areas. On average, rainfall may explain only 5, 15, 28 and 22 % of burned-area variability within sub-regions 1, 2, 3 and 4, respectively, based on the correlation coefficients.
In order to investigate the relationship between the burned-area anomalies and climate indexes, we retained only the
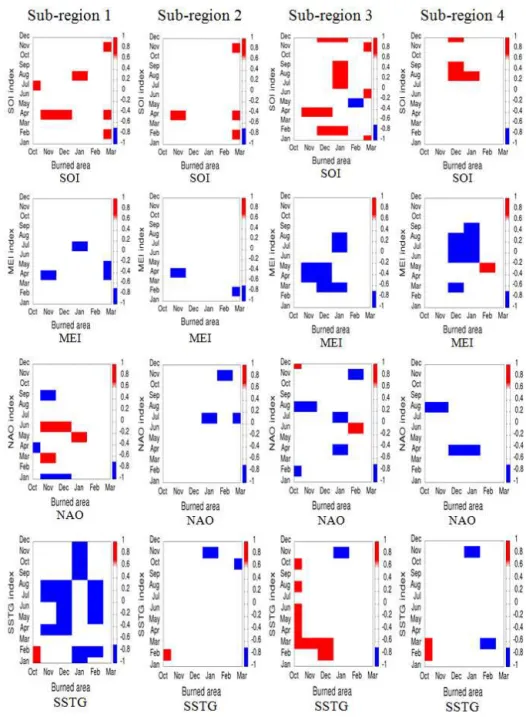
most outstanding PCA axes between the two variables (burned area and each of the climate indexes – MEI, SOI, NAO and SSTG). The relationships between them revealed that they were not statistically independent and that there ex-isted some correlation between them. We considered the cor-relation to be significant when it was equal to or greater than 0.7 in absolute value. Figure 9 shows correlations between monthly burned areas and climate indexes (red for positive correlations and blue for negative correlations) for the four subregions.
There were two main general remarks. The first one was that correlations between SOI and the burned areas in the whole West African domain were positive, with consistent links in subregions 3 and 4 between December and January. It had been established that SOI and MEI generally have oppo-site evolution; the correlations between MEI and the burned areas of subregions 3 and 4 were negative in December– January. This teleconnection with the Pacific Ocean may be explained by known relationships between climate variabil-ity in subregions 3 and 4 and the ENSO mechanism (Jan-icot et al., 1996; Bader and Latif, 2003; Lu and Delworth, 2005; Diatta and Fink, 2014). The second remark was that correlations between burned areas of subregion 2 and all the large-scale indexes were weak. This may be attributed to the fact that subregion 2 had a regular regime and mean rainfall greater than 800 mm yr−1with permanent biomass availabil-ity and was hence prone to fire events, irrespective of the climate conditions.
(a)
(b)
(c)
(d)
Figure 7. The interannual variability in burned areas for the four West African subregions:(a)subregion 1,(b)subregion 2,(c) sub-region 3 and(d)subregion 4.
as it showed both positive and negative correlations with the burned areas in subregions 1 and 3 and negative correlations with burned areas in subregions 2 and 4.
(a)
(b)
Figure 8.Rainfall and fires over the West African domain.(a)Time series between rainfall and burned areas for each of the four subre-gions.(b)Spatial correlation map between burned areas and JJAS rainfall of the preceding years over West Africa. Note that burned-area axis bounds vary between subregions.
4 Discussion and conclusion
In this paper, L3JRC daily burned-area products from the SPOT Vegetation satellite sensor at moderate spatial resolu-tion of 1 km×1 km were analyzed over West Africa. Results revealed that, at the regional scale, the West African savan-nahs were fairly regularly burned, despite some slight inter-annual variability.
To investigate this variability in the burned areas at the subregional scale, West Africa was divided into four subre-gions along broad climatic and vegetative gradient, from the extreme north to the extreme south, consisting of a variety of savannahs, including the Sahelian (subregion 4), Sudanian (subregion 3), Guinean (subregion 2) and forest (subregion 1) savannahs. While fire regimes at the regional scale appeared to be stable, at the subregional scale, depending on dominant vegetation type (forest, Guinean, Sudanian or Sahelian sa-vannahs), fire regimes were variable for subregion 1, regular for subregions 2 and 3, and fairly regular for subregion 4.
Figure 9.Significant correlations (≥0.7) between monthly burned areas and climate indexes (red for positive correlations and blue for negative correlations) for the four subregions.
forest region, thus inhibiting and limiting fire propagation. Dry and largely pastoral conditions may explain the more im-portant variability in burned areas over subregion 4 compared to subregions 2 and 3, which were characterized by tall grass vegetation. Also, subregion 4 receives the lowest amount of rainfall and is well known for its important pastoral activities (Mbow et al., 2000).
In general, the African fire pattern was strongly associ-ated with the southward movement of the ITCZ (monsoon retreat) over the region as proposed by Swap et al. (2002). The fire onsets in the northern subregions (subregions 3
On a weekly timescale, sets of burned-area peaks were found mainly in subregions 2 and 3, in agreement with Laris (2002), who suggested that the first peaks were associated with fires which were set as a preventive measure to avoid damages from fires during the latter part of the season. They were easy to control since vegetation was too moist to burn. However, the second set of peaks was associated with fires set by farmers after harvest to avoid land damage. The spatial distribution of peak burned areas showed a displacement in a northeasterly direction, corresponding to the difference in the onset of the dry seasons over West Africa as well as the timing of the fire practices by the population. Thus, people set fires when the climate conditions allowed for vegetation to burn.
Investigations of the burned-area anomalies and large-scale climatic indexes (SOI, MEI, NAO and SSTG) have shown the existence of a possible relationship between burned areas and these climatic indexes, as a result of the complex teleconnection between these indexes and the West African monsoon rainfaill on the one hand and human con-trols on fire practices (Archibald et al., 2010; Laris, 2011) on the other. However, it was observed that, while subregion 1 was strongly correlated with Atlantic indexes, subregions 3 and 4 showed more correlations with Pacific indexes. Subre-gion 2 was less correlated with large-scale climate, suggest-ing the least contribution of the large scale to the regular fire regime.
The relation between fires and climate indexes that was found could be explained by their interactions with West African climate system through their induced atmospheric perturbations during both the monsoon and dry seasons. The positive (SOI) and negative (MEI) correlations found implied that the prevalent warm ENSO conditions (El Niño: negative SOI and positive MEI) tended to decrease fires, while cool ENSO conditions (La Niña: positive SOI and negative MEI) enhanced fires. This was mainly true for subregions 3 and 4, where the ENSO signature was stronger than the other re-gions (Janicot et al., 2001, 1996; Fontaine et al., 1998). In addition, Philipon et al. (2014) found a consistent signal of ENSO on vegetation in West Africa over both the Sahel and Guinean coastal regions, which is in accordance with our findings.
The Atlantic indexes were not clear, as both positive and negative correlations were found. A dominant negative cor-relation indicated an opposite phase between NAO and fires in subregions 2–4, which showed that an increase in fires was associated with a decrease in NAO. This was also consistent with previous studies which found that higher NAO were as-sociated with drier conditions in northern hemispheric Africa (Moulin et al., 1997; Chiapello and Moulin, 2002; Mahowald et al., 2003; Chiapello et al., 2005). However, NAO and fire in subregion 1 remained unclear (positive and negative cor-relation); this may be due to the presence of weak fires.
A dominant negative signature of SSTG in subregion 1 re-vealed a trend showing a decrease in fires associated with an
increase in the index, while fires in subregion 2 tended to in-crease with an inin-crease in this index. It has been shown that, in general, warm SST anomalies in the Gulf of Guinea in-duce abundant rainfall over the Guinea coast region but drier conditions in the Sudan and Sahel zone to the north (Cam-berlin et al., 2001). In contrast, fires in subregions 2 and 3 remained stable with regards to the SSTG.
From the above results, fires in West Africa present a sig-nificant signature of large-scale climate variability. However, the length of the data remains a major limitation of this work. The present results do not attempt to refute or decouple fire practices in West Africa from the known human activities but instead try to point out another signature of climate which needs to be investigated in future works.
Despite their decoupled characters, large-scale climate in-dexes may contribute to the interannual burned-area variabil-ity. Also, the comparative influence of the different oceans needs to be investigated further with a longer time series. However, the short length and the intrinsic biases due to the moderate resolution (see Laris, 2005) of the present data do not allow for precise quantification of the contributions of the large-scale climate indexes to the West African burned-area variability. We suggest and encourage the production of long-term fire products for improving our understanding of the complex interaction between ecology, society and climate in West Africa.
Acknowledgements. We acknowledge the support provided
through the RIPIECSA grant for this work and L3JRC for making the biomass burning data available. We are grateful to the Abdus Salam International Centre for Theoretical Physics (ICTP) for allowing us use of the facilities during the revision processes. We also thank the entire team of the Lamto ecological station for their comments and observations. We are especially grateful to P. Laris, who contributed through his comments and suggestions on how to improve this work. We thank the anonymous reviewers and the editor, whose comments and suggestions greatly improved the manuscript. Finally, we thank Gregory Jenkins from Howard University, USA, and Jacques Gignoux from CNRS, France, for their contributions which helped in improving the manuscript.
Edited by: S. Smith
References
Abbadie, L., Gignoux, J., Roux, X., and Lepage, M.: Lamto: struc-ture, functioning, and dynamics of savanna ecosystem (Col, 179), Springer Science & business Media, 2006.
Adeyewa, Z. D. and Nakamura, K.: Validation of TRMM radar rain-fall data over major climatic regions in Africa, J. Appl. Meteorol., 42, 331–347, 2003.
Andersen, A. N., Cook, G. D., and Williams, R. J.: Fire in Trop-ical Savannas: The Kapalga Experiment, Springer–Verlag, New York, 2003.
Global Biomass Burning: Atmospheric, Climatic and Biospheric Implications, edited by: Levine, J. S., MIT Press, Cambridge, Massachusetts, 3–21, 1991.
Archibald, S., Scholes, R. J., Roy, D. P., Roberts, G., and Boschetti, L.: Southern African fire regimes as revealed by remote sensing, Int. J. Wildland Fire, 19, 861–878, 2010.
Archibald, S., Lehmann, C. E., Gómez-Dans, J. L., and Bradstock, R. A.: Defining pyromes and global syndromes of fire regimes, P. Natl. Acad. Sci. USA, 110, 6442–6447, 2013.
Bader, J. and Latif, M.: The impact of decadal-scale Indian Ocean sea surface temperature anomalies on Sahelian rainfall and the North Atlantic Oscillation, Geophys. Res. Lett., 30, 2169, doi:10.1029/2003GL018426, 2003.
Balzter, H., Gerard, F., George, C., Weedon, G., Grey, W., Combal, B., Bartholome, E., Bartalev, S., and Los, S.: Coupling of vegeta-tion growing season anomalies and fire activity with hemispheric and regional-scale climate patterns in central and east Siberia, J. Climate, 20, 3713–3729, 2007.
Beverly, J. L., Flannigan, M. D., Stocks, B. J., and Bothwell P.: The association between Northern Hemisphere climate patterns and interannual variability in Canadian wildfire activity, Can. J. For-est Res., 41, 2193–2201, doi:10.1139/x11-131, 2011
Black, E.: The relationship between Indian Ocean sea-surface tem-perature and east African rainfall, Philos. T. Roy. Soc. A, 363, 43–47, 2005.
Bowman, D. M. J. S., Balch, J. K., Artaxo, P., Bond, W. J., Carlson, J. M., Cochrane, M. A., D’Antonio, C. M., DeFries, R. S., Doyle, J. C., Harrison, S. P., Johnston, F. H., Keeley, J. E., Krawchuk, M. A., Kull, C. A., Marston, J. B., Moritz, M. A., Prentice, I. C., Roos, C. I., Scott, A. C., Swetnam, T. W., van der Werf, G. R., and Pyne, S. J.: Fire in the Earth System, Science, 324, 481–484, doi:10.1126/science.1163886, 2009.
Bowman, D. M. J. S., Balch, J., Artaxo, P., Bond, W. J., Cochrane, M. A., D’Antonio, C. M., DeFries, R., Johnston, F. H., Keeley, J. E., Krawchuk, M. A., Kull, C. A., Mack, M., Moritz, M. A., Pyne, S., Roos, C. I., Scott, A. C., Sodhi, N. S., and Swetnam, T. W.: The human dimension of fire regimes on Earth, J. Bio-geogr., 38, 2223–2236, doi:10.1111/j.1365-2699.2011.02595.x, 2011.
Camberlin, P., Janicot, S., and Poccard, I.: Seasonality and atmo-spheric dynamics of the teleconnection between African rainfall and tropical sea-surface temperature: Atlantic vs. ENSO, Int. J. Climatol., 21, 973–1005, doi:10.1002/joc.673, 2001.
Chang, D. and Song, Y.: Comparison of L3JRC and MODIS global burned area products from 2000 to 2007, J. Geophys. Res., 114, D16106, doi:10.1029/2008JD011361, 2009.
Chiapello, I. and Moulin, C.: TOMS and METEOSAT satellite records of the variability of Saharan dust transport over the At-lantic during the last two decades (1979–1997), Geophys. Res. Lett., 29, 1176, doi:10.1029/2001GL013767, 2002.
Chiapello, I., Moulin, C., and Prospero, J. M.: Understand-ing the long term variability of African dust transport across the Atlantic as recorded in both Barbados surface concen-trations and large scale Total Ozone Mapping Spectrometer (TOMS) optical thickness, J Geophys. Res., 110, D18S10, doi:10.1029/2004JD005132, 2005.
Cochrane, M. A.: Tropical fire ecology: Climate change, land use, and ecosystem dynamics, Springer Berlin, New York, 2009.
Cook, G. D.: The effects of fire on nutrient losses from Top End savannas, in Conservation and Development Issues in Northern Australia, edited by: Moffatt, I. and Webb, A., Northern Australia Research Unit, Darwin, 123–129, 1992.
Damoah, R., Spichtinger, N., Forster, C., James, P., Mattis, I., Wandinger, U., Beirle, S., Wagner, T., and Stohl, A.: Around the world in 17 days – hemispheric-scale transport of forest fire smoke from Russia in May 2003, Atmos. Chem. Phys., 4, 1311– 1321, doi:10.5194/acp-4-1311-2004, 2004.
Diatta, S. and Fink, A. H.: Statistical relationship between remote climate indices and West African monsoon variability, Int. J. Cli-matol., 34, 3348–3367, doi:10.1002/joc.3912, 2014.
Fontaine, B., Janicot, S., Moron, V., Roucou, P., and Trzaska, S.: Anomalies de température de surface de la mer et précipitations tropicale, Synthèse de quelques travaux récents portant sur les précipitations au Sahel et dans le Nord–est, La Météorologie, 23, 14–35, 1998 (in French).
Fuller, D. O. and Murphy, K.: The ENSO-fire dynamic in insular Southeast Asia, Climatic Change, 74, 435–455, 2006.
Giglio, L., Randerson, J. T., van der Werf, G. R., Kasibhatla, P. S., Collatz, G. J., Morton, D. C., and DeFries, R. S.: Assess-ing variability and long-term trends in burned area by mergAssess-ing multiple satellite fire products, Biogeosciences, 7, 1171–1186, doi:10.5194/bg-7-1171-2010, 2010.
Gill, A. M., Hoare, J. R. L., and Cheney, N. P.: Fires and their ef-fects in the wet-dry tropics of Australia, in: Fire in the Tropi-cal Biota, Ecosystem Process and Global Challenges, edited by: Goldammer, J. G., Springer-Verlag, Berlin, 159–178, 1990. Hanley, D. E., Bourassa, M. A., O’Brien, J. J., Smith, S. R., and
Spade, E. R.: A quantitative evaluation of ENSO indices, J. Cli-mate, 16, 1249–1258, 2003.
Holmgren, M., Stapp, P., Dickman, C. R., Gracia, C., Grahams, S., Gutierrez, J. R., Hice, Lopez, B. C., Meserve, P. L., Milstead, W. B., Polis, G. A., Previtali, M. A., Michael, R., Sabate, S., and Squeo, F. A: Extreme climatic events shape arid and semiarid ecosystems, Front. Ecol. Environ., 4, 87–95, 2006.
Huffman, G. J., Adler, R. F., Rudolf, B., Schneider, U., and Keehn, P. R.: Global precipitation estimates based on a technique for combining satellite-based estimates, rain-gauge analysis, and NWP model precipitation information, J. Climaet, 8, 1284–1295, 1995.
Hulme, M., Doherty, R., Ngara, T., New, M., and Lister, D.: African climate change: 1900–2100, Clim. Res., 17, 145–168, 2001. Janicot, S., Moron, V., and Fontaine, B.: Sahel droughts and ENSO
dynamics, Geophys. Res. Lett., 23, 515–518, 1996.
Janicot, S., Trzaska, S., and Poccard, I.: Summer Sahel-ENSO tele-connection and decadal time scale SST variations, Clim. Dy-nam., 18, 303–320, 2001.
Joly, M. and Voldoire, A.: Influence of ENSO on the West African monsoon: temporal aspects and atmospheric processes, J. Cli-mate, 22, 3193–3210, 2009.
Kitzberger, T., Brown, P. M., Heyerdahl, E. K., Swetnam, T. W., and Veblen, T. T.: Contingent Pacific–Atlantic Ocean influence on multicentury wildfire synchrony over western North America, P. Natl. Acad. Sci. USA, 104, 543–548, 2007.
Laris, P.: Spatiotemporal problems with detecting seasonal mosaic fire regimes with coarse-resolution satellite data in savannas, Re-mote Sens. Environ., 99, 412–424, 2005.
Laris, P.: Humanizing savanna biogeography: linking human prac-tices with ecological patterns in a frequently burned savanna of southern Mali, Ann. Assoc. Am. Geogr., 101, 1067–1088, 2011. Laris, P.: Integrating Land Change Science and Savanna Fire
Mod-els in West Africa, Land, 2, 609–636, 2013.
Laris, P. and Wardell, D. A.: Good or bad or ’necessary evil’? Rein-terpreting the savanna landscapes of West Africa, Geograph. J., 172, 271–290, 2006.
Le Goff, H., Flannigan, M. D., Bergeron, Y., and Girardin, M. P.: Historical fire regime shifts related to climate teleconnections in the Waswanipi area, central Quebec, Canada, Int. J. Wildland Fire, 16, 607–618, 2007.
Le Page, Y., Oom, D., Silva, J., Jönsson, P., and Pereira, J.: Season-ality of vegetation fires as modified by human action: observing the deviation from eco-climatic fire regimes, Global Ecol. Bio-geogr., 19, 575–588, 2010.
Louppe, D., N’klo, O., and Coulibaly, A.: Effet des feux de brousse sur la végétation, Bois et forêts des tropiques 245, 59–74, 1995 (in French).
Lu, J. and Delworth, T. L.: Oceanic forcing of the late 20th century Sahel drought, Geophys. Res. Lett., 32, L22706, doi:10.1029/2006GL026067, 2005.
Lyon, B. and Barnston, A. G.: ENSO and the spatial extent of inter-annual precipitation extremes in tropical land areas, J. Climate, 18, 5095–5109, 2005.
Mahowald, N., Luo, C., Del Corral, J., and Zender, C. S.: Interan-nual variability in atmospheric mineral aerosols from a 22-year model simulation and observational data, J. Geophys. Res., 108, 2156–2202, doi:10.1029/2002JD002821, 2003.
Mbow, C., Nielson, T. T., and Rasmussen, K.: Savanna fires in East-Central Senegal: Distribution patterns, Resource Management and Perceptions, Hum. Ecol., 28, 561–583, 2000.
Menaut, J.-C., Abbadie, L., Lavenu, F., Loudjani, P., and Po-daire, A.: Biomass burning in West African savannas, in: Global biomass burning, edited by: Levine, J. S., Cambridge, MA: The MIT Press, 133–142, 1991.
Monnier, Y.: Les effets des feux de brousse sur une savane pré-forestière de Côte d’Ivoire, Etudes Eburnéennes, 9, 1–260, 1968 (in French).
Moulin, C., Lambert, C. E., Dulac, F., and Dayan, U.: Control of atmospheric export of dust from North Africa by the North At-lantic Oscillation, Nature, 387, 691–694, 1997.
N’Dri, A. B., Gignoux, J., Dembele, A., and Konate, S.: Short term effects of fire intensity and fire regime on vegetation dynamic in a tropical humid savanna (Lamto, central Côte d’Ivoire), Natural Science, 4, 1056–1064, doi:10.4236/ns.2012.412134, 2012. Nicholson, S. E.: Climatic and environmental change in Africa
dur-ing the last two centuries, Clim. Res., 17, 123–144, 2001. Nicholson, S. E. and Grist, J. P.: A conceptual model for
under-standing rainfall variability in the west African Sahel on inter-annual and interdecadal timescales, Int. J. Climatol., 21, 1733– 1757, 2001.
Patra, P. K., Ishizawa, M., Maksyutov, S., Nakazawa, T., and Inoue, G.: Role of biomass burning and climate anomalies for land–atmosphere carbon fluxes based on inverse modeling
of atmospheric CO2, Global Biogeochem. Cy., 19, GB3005, doi:10.1029/2004GB002258, 2005.
Pfeifer, M., Disney, M., Quaife, T., and Marchant, R.: Terrestrial ecosystems from space: a review of earth observation products for macroecology applications, Global Ecol. Biogeogr., 21, 603– 624, 2012.
Philippon, N., Martiny, N., Camberlin, P., Hoffman, M. T., and Gond, V.: Timing and pattern of the ENSO Signal over the last 30 years: Insights from Normalized Difference Vegetation index data, J. Climate, 27, 2509–2532, 2014.
Pilecot, P. and Loua, N. S.: Les feux dans les savanes des monts Nimba, Guinee, Bois et foret tropiques, 301, 51–66, 2009. Randerson, J. T., Chen, Y., van der Werf, G. R., Rogers, B. M.,
and Morton, D. C.: Global burned area and biomass burning emissions from small fires, J. Geophys. Res., 117, G04012, doi:10.1029/2012JG002128, 2012.
Riaño, D., Moreno Ruiz, J. A., Barón Martínez, J., and Ustin, S. L.: Burned area forecasting using past burned area records and Southern Oscillation Index for tropical Africa (1981–1999), Re-mote Sens. Environ., 107, 571–581, 2007.
Ropelewski, C. F. and Jones, P. D.: An extension of the Tahiti-Darwin Southern Oscillation index, Mon. Weather Rev., 115, 2161–2165, 1987.
Roy, D. P. and Boschetti, L.: Southern Africa Validation of the MODIS, L3JRC, and GlobCarbon Burned area Products, IEEE-Geosci. Rem. Sens., 47, 4, doi:10.1109/TGRS.2008.2009000, 2009.
Scholes, R. J. and Archer, S. R.: Tree-grass interactions in savannas, Annu. Rev. Ecol. Syst., 28, 517–544, 1997.
Skinner, W. R., Shabbar, A., Flannigan, M. D., and Logan, K.: Large forest fires in Canada and the relationship to global sea surface temperatures, J. Geophys. Res., 111, D14106, doi:10.1029/2005JD006738, 2006.
Swap, R. J., Annegarn, H. J., Suttles, J. T., Haywood, J., Helm-linger, M. C., Hely, C., and Yokelson, R.: The Southern African Regional Science Initiative (SAFARI 2000): overview of the dry season field campaign, S. Afr. J. Sci., 98, 125–130, 2002. Tansey, K., Gregoire, J. M., Binaghi, E., Boschetti, L., Brivio, P. A.,
Ershov, D., Flasse, S., Fraser, R., Graetz, D., Maggi, M., Peduzzi, P., Pereira, J. M. C., Silva, J., Sousa, A., and Stroppiana, D.: A global inventory of burned areas at 1 km resolution for the year 2000 derived from Spot Vegetation data, Climatic Change, 67, 345–377, doi:10.1007/s10584-004-2800-3, 2004a.
Tansey, K., Gregoire, J.-M., Stroppiana, D., Sousa, A., Silva, J., Pereira, J. M. C., Boschetti, L., Maggi, M., Brivio, P. A., Fraser, R., Flasse, S., Ershov, D., Binaghi, E., Graetz, D., and Peduzzi, P.: Vegetation burning in the year 2000: Global burned area es-timates from SPOT VEGETATION data, J. Geophys. Res., 109, D14S03, doi:10.1029/2003JD003598, 2004b.
Tansey, K., Gregoire, J.-M., Defourny, P., Leigh, R., Pekel, J.-F., van Bogaert, E., and Bartholomé, E.: A new, global, multi-annual (2000–2007) burnt area product at 1 km resolution, Geophys. Res. Lett., 35, L01401, doi:10.1029/2007GL031567, 2008. van der Werf, G. R., Randerson, J. T., Collatz, G. J., Giglio, L.,
variabil-ity in global biomass burning emissions from 1997 to 2004, At-mos. Chem. Phys., 6, 3423–3441, doi:10.5194/acp-6-3423-2006, 2006.
Westerling, A. L., Hidalgo, H. G., Cayan, D. R., and Swetnam, T. W.: Warming and earlier spring increase western U.S. forest wildfire activity, Science, 313, 940–943, 2006.