This paper presents results of a parametric study performed on an automotive air conditioning (AAC) system of a passenger car. The goals are to assess the effects of varying the volumetric flow rate of supply air, number of occupants, vehicle speed, and the fractional ventilation air intake (XOA), on the dry bulb temperature and specific humidity of the air inside the passenger’s cabin, and on the evaporator coil cooling load of the AAC system. Results of the parametric study show that increasing the supply air flow rate reduces the dry bulb temperature of the cabin air, increases both the specific humidity of the air and the evaporator coil load. Increasing the number of occupants in the passenger cabin causes the cabin air temperature, specific humidity and the evaporator coil load to increase. Increasing the vehicle speed causes the specific humidity of the cabin air and the evaporator coil cooling load to increase but the dry bulb temperature of the air is not significantly affected. Increasing the fractional fresh air intake (XOA) also increases the cabin air specific humidity and the evaporator coil cooling load.
Automotive air conditioning (AAC) is a necessity for thermal comfort in the cabin of a passenger vehicle especially for people who are living in countries with hot and humid climate. However, the extra weight added to the vehicle and the operation of the AAC system cause the fuel consumption of the vehicle to increase. The additional fuel consumption in turn results in higher emission of greenhouse gases that pollute the environments. Therefore augmentation of the AAC system efficiency and evaluation of its thermal performance has become important. The AAC system is often operated under varying conditions thus substantial efforts are reyuired to evaluate its performance. These conditions include the temperature of the air entering the evaporator and
condenser, the evaporator air volumetric flow rate and ventilation mode, the compressor speed, the condenser face air velocity, passenger cabin’s material, the number of occupants, and the weather conditions which affect the internal and external sensible thermal loads.
The largest auxiliary load on a passenger car’s engine is input power reyuired by the air conditioning system’s compressor. During a peak load the compressor would consume up to 5 to 6 kW of power from the vehicle’s engine power output. This is eyuivalent to a vehicle being driven at a speed of 56 km/h. The additional fuel consumption when the air conditioning system is in used is yuite substantial. One study indicated that the air conditioner usage reduces fuel economy by about 20%. It also increases the emissions of nitrogen oxides by about 80% and carbon dioxide (CO) by about 70%, although the actual numbers depend on the actual driving conditions. A semi empirical computer simulation program (CARSIM) for simulating thermal and energy performance of an automotive air conditioning (AAC) system of a passenger car has been developed [1]. The empirical correlations for evaporator sensible and latent heat transfer were embedded in the loads calculation program to enable the determination of evaporator inlet and outlet air conditions and the passenger cabin air conditions. The computer program has been validated by comparing its predicted outputs with the data obtained from an actual road test on a Proton Wira Aeroback passenger car. The results predicted by the CARSIM computer program were found to have very good agreement with the actual road test data, with errors ranging between 2 to 4%.
This paper presents results of a parametric study performed on the automotive air conditioning (AAC) system of the Proton Wira Aeroback passenger car using the CARSIM computer simulation program. The goal is to
! " # $% & ' # ( ) *
+ , &# ( - *
! " # $% & ' # ( ) *
+ , &# ( - *
! " # $% & ' # ( ) *
investigate the effects of: (1) supply air rate, (2) number of occupants, (3) vehicl the fractional outside air intake (XOA), dry bulb temperature, specific humidit evaporator coil (cooling) load of the AAC case simulation was performed on the sy the trend of variation of the cabin air dry specific humidity and the total evaporat load as the time is varied from 10 am to 2
.
/
/
A computer simulation for the base cas performed on the automotive air con system by using the CARSIM com program developed earlier and reported data used for the computer simulation are
# Parameters for the base case co
0 1
Vehicle speed ~ 90 km/h
Occupant ~ one (1)
Colour of the car body ~ light yellow (
Glass thickness ~ 3 mm (shadin
A/C blower speed ~ maximum
Travelling duration ~ 4 hours (10 a Fraction of outside air
(XOA)
~ 0.16 (or 16%
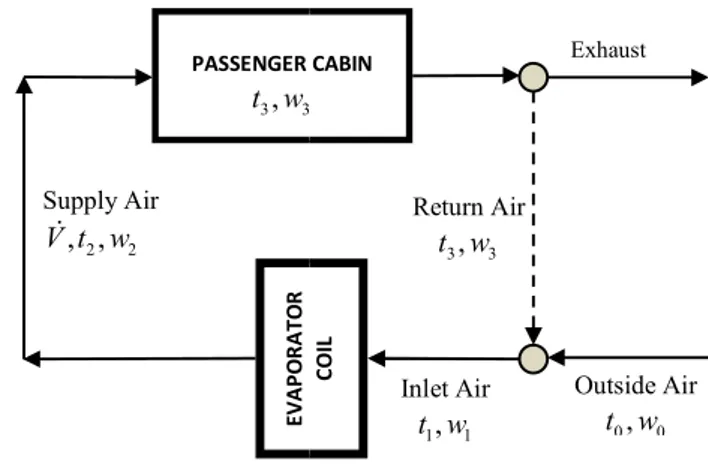
The computer simulation was performed is driven at a constant speed of 90 km/ occupant. The travelling duration is four h am (or 600 minutes past midnight) to minutes past midnight). The car air condi turned on during this period in which the is set to a maximum. The fractional outs set at a fixed value of 16%. The air in cabin gains sensible heat from the surr latent heat from the passenger. As a res dry bulb temperature, specific humidity an coil cooling load will vary with time duri journey. The simulation for the base cas carried out to find out the trend in which vary with the time. Figure 1 shows a sche the simplified air conditioning system of considered in this study.
Figure 2 shows the variation of dry bulb the cabin air with time in minutes, midnight. The time = 600 minutes corre while = 840 minutes corresponds to 2 pm that during the first five minutes after the
air volumetric flow vehicle speed, and (4) OA), on the cabin’s air midity and the total e AAC system. A base the system to find out r dry bulb temperature, aporator coil (cooling)
to 2 pm.
se case conditions was conditioning (AAC) computer simulation orted in [1]. The input n are given in Table 1.
case condition.
ellow (α = 0.5) shading coefficient = 1)
s (10 am to 2 pm) r 16% of outside air)
ormed as if the vehicle 0 km/h with only one four hours i.e. from 10 ht) to 2 pm (or 840 conditioning system is h the blower fan speed l outside air (XOA) is air in the passenger’s e surrounding air and a result, the cabin air dity and the evaporator e during the simulated se case conditions was which these parameters a schematic diagram of m of the passenger car
bulb temperature of , measured after corresponds to 10 am to 2 pm. It can be seen er the air conditioning
system is being turned on the slightly by about 0.05 C. This of the air when cooled air is cabin. Thereafter, the cabin ai with time, from 18.4 C until about 1 pm. The cabin air tem temperature of the ambient temperature rises steadily wit solar radiation increases. Th temperature to rise in a fas However, as the solar radiation pm, the cabin air temperatur from 18.8 C to about 18.6 C bulb temperature of the cabin time, the range of its variation 0.5°C, and hence can be consid
% ) Schematic diagram of an air car [1].
% ) Variation of dry bulb tempe case condition.
PASSENGER C
3, 3
E
V
A
P
O
R
A
T
O
R
C
O
IL
Supply Air
2 2 , ,
the cabin air temperature drops . This is due to a sudden cooling air is suddenly blown into the bin air temperature rises steadily until it reaches about 18.8 C at air temperature is affected by the bient air, 0. The ambient air ly with time as the intensity of es. This causes the cabin air a fashion seen in the figure. diation intensity decreases after 1 erature also decreases steadily, C at 2 pm. Although the dry cabin air appears to vary with iation is yuite small, i.e. less than considered insignificant.
an air conditioning system of a passenger
temperature of the cabin air for the base
ER CABIN
3 ,
C
O
IL
Return Air
3, 3
Exhaust
Inlet Air
1, 1
Outside Air
The variation of specific humidity of th time is shown in Figure 3. The air spe related to the saturation pressure of water in the air. The saturation pressure increa with the dry bulb temperature of the air. temperature of the cabin air rises, the spe the air also increases in a nearly similar f noted that the specific humidity of th steadily from about 6.26 g/kg at 10 am (6 midnight) to a highest value of about 6. (780 minutes after midnight). Thereaf humidity of the cabin air decreases with bulb temperature falls. At 2 pm (84 midnight) the specific humidity of the c about 6.40 g/kg.
% ) Variation of specific humidity of the cab condition.
% ) 2 Variation of evaporator coil cooling loa case condition.
of the cabin air with ir specific humidity is water vapor that exists increases dramatically e air. Hence, when the he specific humidity of milar fashion. It can be of the air increases am (600 minutes after out 6.45 g/kg at 1 pm hereafter, the specific with time, as the dry
(840 minutes after the cabin air drops to
the cabin air for base case
ng load with time for base
Figure 4 shows variations of load with time. The cooling l heat load, C,S and latent heat l is influenced by the temperatu the cooling coil. The latent specific humidity 1 of the inc temperature 1 is in turn affecte incoming outside air, 0 and th air, 3. Both the 0 and 3 incre temperature 1 to continuously pm. This in turn causes a stea heat load of the coil during the and 3 decreases after 1 pm, decreases. The specific humidi cooling coil, 2 is influence incoming outside air, 0 and th 3. Both the 0 and 3 increa pm causing the latent heat loa same period. When both the pm, the latent heat load of decreases. Although the spe time, the range of its variation
0
*
A parametric study was perform to investigate the effects of va flow rate, number of occupa fractional outside air (XOA) temperature, specific humidit cooling load. The supply air v from 70 L/s to 100 L/s with a of occupants of the vehicle w persons. The vehicle speed w 105 km/h with an interval fractional outside air (XOA) w ventilation air volume flow rat flow rate, was varied from 0.2 When the cooled air volume f the simulation, other paramete were held constant at the procedure was followed when varied.
2 3
!
4.1 Effects of Supply Air Vo
Figure 5 shows the effect of c on the dry bulb temperatur simulation results show that fo dry bulb temperature varies w manner as that for the base c volume flow rate, the cabin
ns of the evaporator coil cooling oling load is the sum of sensible t heat load, C,L. The sensible heat perature 1 of the air coming into latent heat is influenced by the he incoming air. The incoming air affected by the temperature of the and the temperature of the return increases with time causing the uously increases from 10 am to 1 a steady increase in the sensible ng the same period. As both the 0 pm, the sensible heat load also umidity of the air coming into the luenced by the humidity of the and the humidity of the return air, increase steadily from 10 am to 1 oad to rise steadily during the h the 0 and 3 decrease after 1 ad of the evaporator coil also e specific humidity varies with iation is yuite small.
performed by computer simulation of varying the supply air volume ccupants, vehicle speed and the OA) on the cabin air dry bulb umidity and the evaporator coil air volume flow rate was varied ith a 10 L/s interval. The number icle was varied from one to four eed was varied from 60 km/h to erval of 15 km/h. Finally, the A) which is the ratio between the ow rate and the cooled air volume m 0.2 to 0.3, with a 0.05 interval. lume flow rate was varied during rameters that are listed in Table 1 the prescribed values. Similar when the other parameters were
Air Volume Flow Rate
steadily from 10 am (600 minutes pas reaches the highest value at about 1 pm (7 midnight). After reaching a maximum va temperature decreases with time. Howeve cooled air volume flow rate decrease temperature of the cabin air. On averag temperature decreases by about 0.5oC (or 10 L/s increment of the cooled air volum highest temperature of the cabin air tempe at 1 pm when the cooled air volume flo The temperature falls to about 18.7°C wh volume flow rate is increased to 100 L/ considered as a significant temperature ch
% ) 4 Variation of evaporator coil cooling loa case condition.
Figure 6 shows the effect of cooled air on the specific humidity of the air insid cabin. Again, the simulation results show of the cabin air varies with time in mor manner, regardless of the cooled air vo However, the specific humidity of the ca when the cooled air volume flow ra Increasing the cooled air volume flow velocity of the air flowing through the e increased. This reduces the ability of the remove moisture from the air that is pa Conseyuently, the specific humidity of t rise. On average, results of the simulation the specific humidity of the cabin air rise (or 0.34 g/kg) for each 10 L/s increase volume flow rate.
70 L/s
80 L/s
90 L/s
100 L/s
es past midnight) and pm (780 minutes after um value, the cabin air owever, increasing the creases the dry bulb average, the cabin air C (or 2.5%) for every volume flow rate. The temperature is 20.2oC, e flow rate is 70 L/s. °C when the cooled air 100 L/s, which can be
ure change.
ng load with time for base
air volume flow rate ir inside the passenger show that the humidity n more or less similar air volume flow rate. the cabin air increases w rate is increased. flow rate means the the evaporator coil is f the evaporator coil to passing through it. y of the cabin air will lation results show that rises by about 5.4% rease in the cooled air
% ) 5 Effect of cooled air volume the cabin air.
The effect of cooled air v evaporator coil total cooling lo can be seen that, for a given variation of the coil cooling lo similar to that for the base ca volumetric flow rate of the c cooling load, at any given time results show that the cooling lo for each 10 L/s increase in the
% ) 6 Effect of cooled air volum cooling load.
4.2 Effects of Number of Oc
The computer simulation res number of occupants in the p bulb temperature of the cabin a
70 80 90 10
olume flow rate on specific humidity of
air volume flow rate on the ling load is shown in Figure 7. It given air volume flow rate, the ling load with time is very much ase case. However, increasing the the cooled air increases the coil n time. On average, the simulation ling load increases by about 6 to 8% in the cooled air volume flow rate.
volume flow rate on the evaporator coil
of Occupant
on results on the effect of the the passenger cabin on the dry abin air is shown in Figure 8.
70 L/s 80 L/s 90 L/s 100 L/s
% ) + Effect of number of occupants on the dry the cabin air.
Note that the curve for one person repre “base case” condition (see Figure 2). results indicate that the variation of cabin with time is not much affected by the num in the cabin. However, at a any given number of occupants is increased the ca temperature increases. This is becaus continuously transfers energy in the form which will cause the cabin air temperature passengers occupy the cabin space, more transferred to the cabin air causing greater of the air. On average, the simulation resu cabin air temperature increases by about for each additional person occupying the This can be considered as a significant inc The effect of the number of occupants humidity of the cabin air is shown in Fig the curve for one person represents the for a base case condition (see Figure 3 figure, the variation of specific humidity with time is generally not affected by occupants present in the passenger cabi simulation results show that at any given the number of occupants will significan specific humidity of the cabin air. This i releases energy into the cabin air in the fo through perspiration process and breathi more people occupy the cabin space, the and moisture are added to the cabin significant increase in the specific humid average, the humidity of the cabin air rise or 0.38 g/kg for each additional occupant cabin.
4 persons
2 persons 3 persons
1 person
the dry bulb temperature of
represents that for the ). The simulation f cabin air temperature he number of occupant given time, when the the cabin air dry bulb because human body e form of sensible heat erature to rise. As more , more sensible heat is ter temperature rise n results show that the about 1.2 % or 0.23oC g the passenger cabin. ant increment.
upants on the specific in Figure 9. Note that s the simulation result 3). As seen in the idity of the cabin air ed by the number of r cabin. However, the given time, increasing ificantly increases the This is because human the form of latent heat, reathing. Hence when e, the more latent heat bin air resulting in humidity of the air. On air rises by about 5.4% cupant in the passenger
% ) 7 Effect of number of occupan
Figure 10 shows the effect of the evaporator coil cooling loa represents the simulation resul (see Figure 4). It is seen tha cooling load with time appea number of occupants in the cab number of occupant will incre and latent heat in the cabin additional thermal load that ne cabin air by the air condition rate of the refrigerant throug increase to achieve this. This i increase in the compressor sp on average, for each additiona evaporator coil cooling load r kW.
% ) , Effect of number of occup load.
4
2 3
cupants on cabin air specific humidity.
ct of the number of occupants on ng load. The curve for one person result for the base case condition en that the variation of the coil appears to be unaffected by the the cabin. However, increasing the increase the amount of sensible cabin air. This represents the needs to be absorbed from the ditioning system. The mass flow through the evaporator must be This is accomplished through the speed. The figure shows that, itional occupant in the cabin, the load rises by 2.5% or about 0.06
occupants on the evaporator coil cooling
4 persons
2 persons 3 persons
4.3 Effects of Vehicle Speed
Computer simulation was also carried out effects of varying the vehicle speed temperature and specific humidity of the c evaporator coil cooling load. The vehicle from 60 km/h to 105 km/h with 15 km/h in
% ) Effect of vehicle speed on the dry bul cabin air.
Increasing the vehicle speed will cause the air conditioning system to operate This in turn leads to a higher mass f refrigerant. As a result, more heat is refrigerant from the air passing through th [5]. The dry bulb temperature of the c reduced since the supply air enters the temperature. This is situation is show However, as seen from the figure, the cabin air dry bulb temperature is very sm the simulation results show that the cabin drops only by about 0.1% or 0.02oC fo increment of the vehicle speed. This re consistent with that reported in the literatu The effect of varying vehicle speed humidity of the cabin air is shown in Figu the simulation results show that the vehic have significant effects on the trend of var humidity of the cabin air with time. Howe time, the specific humidity of the cabin ai significantly as the vehicle speed is increa suggests that as the vehicle moves at hig moisture is absorbed from the air that is the evaporator coil. As a result, the air tha the cabin air is dryer. This causes the
60 km/h
75 km/h
105 km/
ed out to determine the peed on the dry bulb f the cabin air, and the ehicle speed was varied
m/h interval.
bulb temperature of the
ause the compressor of erate at higher speed. ass flow rate of the at is absorbed by the ugh the evaporator coil the cabin air will be rs the cabin at lower shown in Figure 11. , the reduction in the ery small. On average, e cabin air temperature C for every 15 km/h his result is however
rature [6].
peed on the specific n Figure 12. In general, vehicle speed does not of variation of specific However, at any given abin air decreases yuite increased. This results at higher speed, more that is passing through air that is supplied into s the reduction in the
specific humidity of the cabin humidity drops by about 5.4% km/h increment of the vehicle s
% ) Effect of vehicle speed on air.
The results of computer simul speed has insignificant effe evaporator coil cooling load w Figure 13. However, at any g load increases as the speed of average, for every increment increases by 3.9% or 0.09 kW. cooling load is somewhat sma is increased from 75 km/h to 90
% ) Effect of vehicle speed on
90 km/h
5 km/h
cabin air. On average, the specific 5.4% or 0.33 g/kg for every 15 hicle speed.
eed on the specific humidity of the cabin
simulation shows that the vehicle t effects on the variation of load with time. This is shown in t any given time, the coil cooling ed of the vehicle is increased. On ement of 15 km/h, the coil load 9 kW. However the increase in the at smaller when the vehicle speed
h to 90 km/h.
eed on the evaporator coil cooling load.
60 km/h
90 km/h 75 km/h
105 km/h
60 km/h 90 km/h
4.4 Effects of Fractional Ventilation A
Fractional ventilation air intake (XOA between the ventilation air flow rate conditioning system’s supply air flow ranges from 0 for air recirculation mode air) and 1 for a ventilation air full recirculation).
% ) 2 Effect of XOA on the dry bulb temperatu
In this study the XOA was varied from 0.05 increment the effects of doing this temperature and specific humidity of the c cooling load of the evaporator coil were effects of varying the XOA on the dry bu the cabin air is shown in Figure 14. It figure that the variation of the cabin air time is not significantly affected by the Also, increasing the XOA from 0.2 to 0.3 have appreciable impact on the cab temperature. This could be because the XOA considered in this study is too small The effect of varying the XOA on the spe the cabin air is shown in Figure 15. The s show that the variation of specific humi generally not much affected by the val However, at any given time, increasing th causes the specific humidity of the cabin When the XOA is increased the specific air at the inlet of the evaporator coil i because the outside air has higher m compared with the returned air from the moisture content of the air at the inlet o coil is higher, the ability of the coil to rem is somewhat reduced. As a result, the evaporator coil, which is supplied into the slightly higher moisture content. On aver
XOA = 0.3
tion Air Intake
(XOA) is the ratio rate and the air flow rate. It’s value mode (no ventilation r full usage (no air
perature of the cabin air.
from 0.2 to 0.3 with a g this on the dry bulb f the cabin air, and the were investigated. The bulb temperature of . It is seen from the in air temperature with the value of the XOA. to 0.3 does not seem to e cabin air dry bulb se the variation of the
small.
he specific humidity of . The simulation results humidity with time is he value of the XOA. sing the value of XOA cabin air to increase. ecific humidity of the coil is also increased her moisture content m the cabin. When the inlet of the evaporator to remove the moisture lt, the air leaving the nto the cabin, will have n average, the specific
humidity of the cabin air is i 0.37 g/kg for every 0.05 increm
% ) 4 Effect of varying the XO cabin air.
The simulation result on the e on the evaporator coil cooling It is seen from the figure that have any significant effect on load with time. However, at an XOA causes the evaporator co significantly. The increase in conseyuence of the increase i humidity of the air inlet to th outside air is introduced to the higher temperature and hum average, for every 0.05 incre cooling total load rises by which can be considered as sig
% ) 5 Effect of varying the XOA
XO
XO X
ir is increased by about 5.2% or increment of the XOA.
e XOA on the specific humidity of the
the effects of varying the XOA oling load is shown in Figure 16. e that the value of XOA does not ct on the variation of the cooling , at any given time, increasing the ator cooling load to increase yuite ase in the coil load is a direct rease in temperature and specific t to the evaporator coil, as more to the system. The outside air has humidity than the cabin. On increment of the XOA, the coil about 6.8% (or 180 Watt ), as significant increment.
XOA on the evaporator coil cooling load.
XOA = 0.25
XOA = 0.2 XOA = 0.3
XOA = 0.25
4 /
A semi empirical computer simulation program (CARSIM) has been developed for simulating thermal and energy performance of an automotive air conditioning (AAC) system. The computer program was used to perform a parametric study to investigate the effects of varying the volume flow rate of supply air, the number of occupants in the passenger cabin, the vehicle speed and the fractional outside air intake (XOA) on the dry bulb temperature and specific humidity of the cabin air, and on the evaporator coil cooling load of a 1.6 L Proton Wira passenger car. Results of the parametric study show that for each 10 L/s increment of the supply air flow rate the cabin air temperature is reduced by about 2.5%, the specific humidity increases by 5.4%, and the evaporator coil cooling load increases by about 6%. For each additional occupant in the passenger compartment, the cabin air temperature, specific humidity, and evaporator coil cooling load are increased by 1.2%, 5.4%, and 2.5%, respectively. For every 15 km/h increase of the vehicle speed, the specific humidity of the cabin air is increased by 5.4% and the evaporator coil cooling load by 3.9%. The temperature of the cabin air appears to be not affected by the vehicle speed. The fractional fresh air intake (XOA) has no significant influence on the cabin air temperature. However, for every 0.05 increase of XOA, the interior air specific humidity increases by 5.2% and the evaporator coil cooling load also increased, by about 6.8%.
( )
The authors would like to acknowledge the financial supports from the Universiti Teknologi Malaysia and research funding given by Ministry of Science, Technology and Innovation, (MOSTI) Malaysia and the Research Management Centre (RMC), Universiti Teknologi Malaysia, through an IRPA grant no. 74062.
3
[1] Haslinda Mohamed Kamar, Mohd Yusoff Senawi and Nazri Kamsah, Computerized Simulation of Automotive Air Conditioning System: Development of Mathematical Model and Its Validation, The International Journal of Computer Science Issues, Vol. 9, Issue 2, No 2, March 2012.
[2] Moller, S. K. and Wooldridge, M. J., User’s Guide for the Computer Program BUNYIP: Building Energy Investigation Package (Version 2.0), Highett, Victoria, Australia. (1985).
[3] Kohler, J., Kuhn, B. and Beer, H., Numerical Calculation of The Distribution of Temperature And Heat Flux In Buses Under The Influence of The
Vehicle Air Conditioning System. ASHRAE Transactions. 96 (Part 1) (1990) 432 – 446.
[4] H. Zhang, L. Dai, G. Xu, Y. Li, W. Chen, W Q., Tao Studies of Air flow and Temperature Fields Inside a Passenger Compartment for Improving Thermal Comfort and Saving Energy: Part I Test/Numerical Model and Validation. Applied Thermal Engineering. 29 (2009) 2022–2027.
[5] Somchai Wongwises, Amnouy Kamboon and Banchob Orachon, Experimental Investigation of Hydrocarbon Mixtures to Replace HFC 134a in an Automotive Air Conditioning System. Energy Conversion and Management. 47 (2006) 1644–1659.
[6] H. Zhang, L. Dai, G. Xu, Y. Li, W. Chen, W Q., Tao. Studies of Air flow and Temperature Fields Inside a Passenger Compartment for Improving Thermal Comfort and Saving Energy: Part II Test/Numerical Model and Validation. Applied Thermal Engineering. 29 (2009) 2028–2036.
[7] Mezrhab, A. and Bouzidi, M., Computation of Thermal Comfort Inside a Passenger Car Compartment. Applied Thermal Engineering. 26 (2006) 1697–1704.
! "##$! %
& '
"##( )**#! + ,
- , ! & '
, . !
/ !
0, 12 34! , +
, +, , 15- 4
,
, ! 6 "#7$!
1 4 & ' "#77! %
8 + !
, ! )**" , ,
- , ! & '
, +, !
, !
!
, ! , +
, ! 0, 12 34 +, ,
15- 4 ,
! ,
& 8 , 9 "#7(
% , + 5 +, !
% & '
1 & 4 "#7#! "##$ )***! + 5,
: , & ,