João Paulo Pereira dos Santos
Licenciatura em Ciências da Engenharia e Gestão Industrial
A simulation model for Lean, Agile,
Resilient and Green Supply Chain
Management: practices and
interoperability assessment
Dissertação para obtenção do Grau de Mestre em
Engenharia e Gestão Industrial
Orientador: Doutor António Carlos Bárbara Grilo,
Professor Auxiliar, FCT-UNL
Júri:
Presidente: Prof. Doutor Virgílio António Cruz Machado Vogais: Prof. Doutora Helena Maria Lourenço Carvalho Remígio
Prof. Doutor António Carlos Bárbara Grilo
A simulation model for Lean, Agile, Resilient and Green Supply Chain Management:
practices and interoperability assessment
Copyrighted © by João Paulo Pereira dos Santos, FCT/UNL and UNL
Acknowledgments
First of all, I would like to thank to Professor Doctor António Grilo, my supervisor, for his availability, encouragement, discussions, the text review and all his support that contributed to the success of this dissertation.
To Professor Doctor Virgílio António Cruz Machado, responsible for the project LARG SCM, for all information that contributed to this work.
To Fundação para a Ciência e Tecnologia for funding the project LARG SCM.
To Professor Doctor Ana Paula Barroso for her availability, the feedback and validation of the developed ideas.
To my laboratory colleagues, Carolina Santos, Sara Figueira, Izunildo Cabral and Pedro Cruz for their help, availability and friendship always manifested.
To my family, girlfriend and friends for all their support, incentive and inspiration.
Abstract
In today’s global market, the environment of unpredictable events has imposed a competitiveness improvement that requires a greater coordination and collaboration among Supply Chain (SC) entities, i.e., an effective Supply Chain Management (SCM). In this context, Lean, Agile, Resilient and Green (LARG) strategies emerged as a response. However, interoperability issues are always presents in operations among SC entities. From the Information Technology (IT) perspective, among all the multi-decisional techniques supporting a logistics network, simulation appears as an essential tool that allow the quantitative evaluation of benefits and issues deriving from a co-operative environment.
The present work provides a SC simulation model for analysing the effect of the interoperability degree of LARG practices in the SC performance, through Key Performance Indicators (KPI’s) such as cost, lead time and service level. The creation of two scenarios with a different point of view about the LARG practices allowed to analyse which one contributes to the best SC performance. Since some of the inputs were assumed, it was made a sensitivity analysis to validate the output of the simulation model. Based on the creation of six types of math expressions, it was possible to establish the connection between the effect of the interoperability degree of LARG practices and the SC performance. This analysis was applied on a case study that was conducted at some entities of a Portuguese automotive SC. The software used to develop the simulation model is Arena, which is considered a user-friendly and dynamic tool.
It was concluded that SCM, interoperability and simulation subjects must be applied together to help organisations to achieve overall competitiveness, focusing their strategies on a co-operative environment.
Keywords: Supply Chain Management; Lean, Agile, Resilient and Green; interoperability;
Resumo
No mercado global de hoje, o ambiente de acontecimentos imprevisíveis tem imposto uma melhoria da competitividade que exige uma maior coordenação e colaboração entre as entidades da cadeia de abastecimento, ou seja, uma gestão da cadeia de abastecimento eficaz. Neste contexto, as estratégias Lean, Agile, Resilient and Green (LARG) surgiram como uma resposta. No entanto, as questões de interoperabilidade estão sempre presentes nas operações entre as entidades da cadeia de abastecimento. Na perspetiva da tecnologia de informação, entre todas as técnicas de tomada de decisão que suportam uma rede logística, a simulação aparece como uma ferramenta essencial que permite a avaliação quantitativa dos benefícios e das questões decorrentes de um ambiente cooperativo.
O presente trabalho apresenta um modelo de simulação de uma cadeia de abastecimento para analisar o efeito do grau de interoperabilidade das práticas LARG no desempenho da cadeia de abastecimento, através de indicadores-chave de desempenho como o custo, tempo de aprovisionamento e nível de serviço. A criação de dois cenários com um ponto de vista diferente acerca das práticas LARG permitiu analisar qual deles contribui para um melhor desempenho da cadeia de abastecimento. Uma vez que alguns dados foram estimados, foi feita uma análise de sensibilidade para validar o resultado do modelo de simulação. Com base na criação de seis tipos de expressões matemáticas, foi possível estabelecer uma ligação entre o efeito do grau de interoperabilidade das práticas LARG e o desempenho da cadeia de abastecimento. Esta análise foi aplicada num caso de estudo que foi realizado em algumas entidades de uma cadeia de abastecimento automóvel Portuguesa. O software usado para desenvolver o modelo de simulação é o Arena, que é considerada uma ferramenta dinâmica e de fácil utilização.
Concluiu-se que as áreas da gestão da cadeia de abastecimento, interoperabilidade e simulação devem ser conjuntamente aplicadas para ajudar as organizações a alcançar a competitividade global, focando as suas estratégias num ambiente cooperativo.
Palavras-chave: gestão da cadeia de abastecimento; Lean, Agile, Resilient and Green;
Contents
Chapter 1. Introduction ... 1
1.1. Scope ... 1
1.2. Objectives ... 2
1.3. Methodology ... 3
1.4. Organisation of this dissertation ... 5
Chapter 2. Supply Chain Management ... 7
2.1. Paradigms and practices review ... 8
2.1.1. Lean ... 9
2.1.2. Agile ... 10
2.1.3. Resilient ... 11
2.1.4. Green ... 13
2.2. Paradigms combination ... 14
2.3. Characteristics ... 17
2.4. Performance measurement ... 19
Chapter 3. Interoperability ... 23
3.1. Concept review ... 23
3.2. Business interoperability ... 24
3.3. Interoperability measurement ... 26
3.4. Perspectives of interoperability ... 26
3.4.1. Syntax ... 27
3.4.2. Semantics ... 28
3.4.3. Pragmatics ... 28
XII
4.3. Model development: an automotive Supply Chain ... 32
4.3.1. Supply Chain characterization ... 33
4.3.2. Characteristics and assumptions ... 34
4.3.3. Conceptual model ... 35
4.3.4. Input data and parameters ... 36
4.3.5. Simulation model ... 46
4.4. Results and discussion ... 53
Chapter 5. Overall conclusions ... 63
5.1. Conclusions ... 63
5.2. Future work ... 64
References ... 65
Annexes ... 73
Annex 1 First scenario simulation sub models ... 73
Annex 1.1 Supplier 1_2 simulation sub model ... 73
Annex 1.2 Supplier 2_2 simulation sub model ... 73
Annex 2 Second scenario simulation sub models... 74
Annex 2.1 Customer simulation sub model ... 74
Annex 2.2 FF simulation sub model ... 74
Annex 2.3 Supplier 1_1 simulation sub model ... 74
List of figures
Figure 1.1 Outline of the dissertation ... 4
Figure 2.1 Performance indicators and management characteristics relationships ... 17
Figure 3.1 Different aspects of interoperability ... 25
Figure 3.2 Semiotic aspects of communication ... 27
Figure 4.1 Basic process flow for SC simulation ... 30
Figure 4.2 Summary of contributions to this thesis ... 31
Figure 4.3 Automotive SC ... 34
Figure 4.4 BOM ... 34
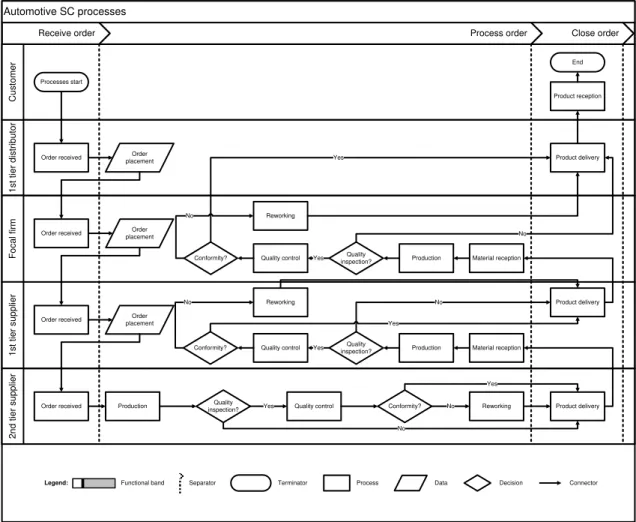
Figure 4.5 Automotive SC flowchart ... 36
Figure 4.6 Graphic representation of math function T = ID ... 44
Figure 4.7 Graphic representation of math function T = 2 - ID... 45
Figure 4.8 Graphic representation of math function T = 1 / (2 – ID) ... 45
Figure 4.9 Graphic representation of math function T = 2 / (1 + ID) ... 45
Figure 4.10 Graphic representation of math function T = 2 – [3 / (2 + ID)] ... 46
Figure 4.11 Graphic representation of math function T = 3 – [2 / (2 - ID)] ... 46
Figure 4.12 Automotive SC simulation model ... 48
Figure 4.13 Customer simulation sub model ... 49
Figure 4.14 1tD simulation sub model ... 50
Figure 4.15 FF simulation sub model ... 50
Figure 4.16 Supplier 1_1 simulation sub model ... 51
List of tables
Table 2.1 Definitions of SCM ... 8
Table 2.2 Lean practices ... 9
Table 2.3 Agile practices ... 11
Table 2.4 Resilient practices ... 12
Table 2.5 Green practices ... 13
Table 2.6 LARG attributes ... 14
Table 2.7 Paradigms synergies and divergences overview ... 18
Table 2.8 SC performance measures ... 19
Table 3.1 Interoperability definitions ... 24
Table 4.1 Entity spreadsheet ... 36
Table 4.2 Queue spreadsheet ... 37
Table 4.3 Resource spreadsheet ... 38
Table 4.4 Failure spreadsheet ... 39
Table 4.5 Create module spreadsheet ... 39
Table 4.6 Process module spreadsheet ... 40
Table 4.7 Decide module spreadsheet ... 41
Table 4.8 First scenario KPI’s comparison considering math function T = ID ... 54
Table 4.9 First scenario KPI’s comparison considering math function T = 2 - ID ... 54
Table 4.10 First scenario KPI’s comparison considering math function T = 1 / (2 – ID) ... 55
Table 4.11 First scenario KPI’s comparison considering math function T = 2 / (1 + ID) ... 55
Table 4.12 First scenario KPI’s comparison considering math function T = 2 – [3 / (2 + ID)] ... 56
Table 4.13 First scenario KPI’s comparison considering math function T = 3 – [2 / (2 - ID)] ... 57
Table 4.14 Second scenario KPI’s comparison considering math function T = ID ... 58
Table 4.15 Second scenario KPI’s comparison considering math function T = 2 - ID ... 59
Table 4.16 Second scenario KPI’s comparison considering math function T = 1 / (2 – ID) ... 59
XVI
Acronyms
BOM Bill Of Materials
DSS Decision Support System
FF Focal Firm
FIFO First In First Out
GSCM Green Supply Chain Management
ISO International Organisation for Standardization
IS Information Systems
IT Information Technology
JIT Just-In-Time
KPI’s Key Performance Indicators
LARG Lean, Agile, Resilient and Green
LARG SC Lean, Agile, Resilient and Green Supply Chain
LARG SCM Lean, Agile, Resilient and Green Supply Chain Management
LM Lean Management
MU Monetary Unit
NVA Non-Value Added
SC Supply Chain
SCM Supply Chain Management
SIMAN SIMulation ANalysis
SMED Single Minute Exchange of Dies
SQL Structured Query Language
TPM Total Productive Maintenance
TQM Total Quality Management
VA Value Added
VBA Visual Basic for Applications
XML Extensible Markup Language
1tC First tier Costumer
1tD First tier Distributor
1tS First tier Suppliers
1.1. Scope
1.2. Objectives
1.3. Methodology
1.4. Organisation of this dissertation
Chapter 1.
Introduction
Since the end of the 20th century until today, the creation of collaborative networks, such as
Supply Chains (SC’s), where suppliers, manufacturers, distributors, retailers and wholesalers operate in joint activities and sharing information in real time, has been crucial to achieve global success (Espadinha-Cruz, 2012). Strategies as Lean, Agile, Resilient and Green have emerged as a response to gain competitiveness towards the demands of the market (Espadinha-Cruz, 2012). The integration of these four different methodologies on the same SC is very important in the strategic point of view (Espadinha-Cruz, 2012).
However, such complex networks are affected by problems of communication between partners and some other kinds of disturbance, like incoordination of activities (Espadinha-Cruz, 2012). This kind of disturbance is known by interoperability, i.e., the ability of two or more systems to share and use information in order to operate effectively together with the objective to create value. Therefore, every SC needs to cooperate in order to have significant positive effects on its performance.
The appearance of simulation turns out to be an essential tool in SC’s management, allowing the enhancement of their global efficiency through evaluation and comparison of virtual scenarios. The development of Information Technology (IT) over the last decades is turning simulation into a high speed and relatively low cost tool.
This dissertation provides a SC simulation model for the analysis of the effect of the interoperability degree of Lean, Agile, Resilient and Green (LARG) practices in the SC performance. The model is based on the creation of two different scenarios to analyse which one will contribute to the best SC performance, in terms of cost, delivery time and service level to customers.
1.1. Scope
In the perspective of Supply Chain Management (SCM), which has become very popular in recent years, the environment of high volatile markets and unpredictable conditions has imposed that competitiveness improvement requires collaborative work and partnerships across
Chapter 1. Introduction
2
In the context of LARG, the present dissertation was developed to integrate contradictory practices and corresponding Key Performance Indicators (KPI’s).
The concept of interoperability is associated with information, material and services exchange. Every activity between actors occurs according to the adopted SCM strategy and the correspondent practices (Espadinha-Cruz, 2012). The alignment of these activities is a challenge for companies that deal with complex products, such as automakers (Espadinha-Cruz, 2012). Thus, in the context of interoperability, it is necessary to identify barriers in collaboration to achieve the best quality and service, resulting in lower costs for the final customer.
From the IT perspective, among all the quantitative methods, simulation is undoubtedly one of the most powerful techniques to apply, as a Decision Support System (DSS), within a SC environment (Terzi & Cavalieri, 2004).The ultimate success of SC simulation, however, is
determined by a combination of the analyst’s skills, the chain members’ involvement, and the modelling capabilities of the simulation tool (Zee & Vorst, 2005). In this dissertation, Arena simulation software was used to satisfy the emergence of SCM needs.
The main focus of the present dissertation is based on the future research work proposed by Espadinha-Cruz (2012), whose methodology makes a practical exposition of how to assess interoperability in LARG practices using subjective information (Espadinha-Cruz, 2012). The SC simulation model provided in this dissertation address the second branch of conceptual framework proposed by Espadinha-Cruz (2012), which is related to the question “How do we evaluate the effect of the interoperability degree of LARG practices in the SC performance?”. To answer this question it is necessary to establish a link between the interoperability degree of LARG practices and SC performance, through KPI’s that help monitor the practices’ implementation (Espadinha-Cruz, 2012). The combination of the methodology proposed by Espadinha-Cruz (2012) and the simulation model developed in this dissertation provide a complementary and seamless manner to monitor interoperability throughout the SC (Espadinha-Cruz, 2012).
1.2. Objectives
The aim of this dissertation lies on the construction of an automotive SC simulation model for the analysis of the effect of the interoperability degree of LARG practices in the SC performance, through KPI’s such as cost, lead time and service level. The creation of two different scenarios allowed to analyse which one contributes to the best SC performance.
Chapter 1. Introduction
In the second scenario, it will only be considered one practice that can belong not only to the Resilient paradigm, but also to the remaining three paradigms, considering the different opinions of the authors that were found in the literature review. Note that these two scenarios were only considered to obtain different results in order to evaluate if the Resilient practice should be associated to the remaining paradigms. Thus, the question “How do we evaluate the effect of the interoperability degree of LARG practices in the SC performance?” is not directly related with the number of scenarios considered.
In order to simulate and compare these scenarios, it was used a simulation software, namely Rockwell Arena 9.0.
1.3. Methodology
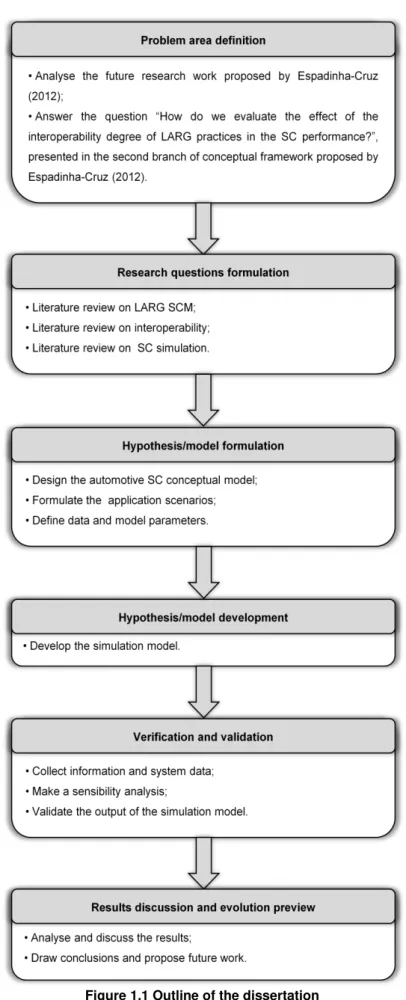
The expected achievements for the present work involve the stages summarised in Figure 1.1.
The first stage consists only in the analysis of the master’s dissertation of Espadinha-Cruz (2012). After defining the objectives based on the future research work proposed by Espadinha-Cruz (2012), an extensive literature review must be made.
Therefore, in the next stage the aim is to understand the LARG practices and interoperability concepts. This literature review research is conducted using the contributions for the project LARG SCM. Then, using the B-on scientific database, Web of Knowledge research platform, run repository and some books, it was possible to make an in-depth study in the SC simulation area and also complement the information provided by the project LARG SCM.
After formulate the research questions, the automotive SC conceptual model is designed based on a journal article written by Carvalho, Barroso, Machado, Azevedo, & Cruz-Machado (2012). Some data and model parameters were defined based on that journal article and the remaining were assumed based on the information encountered in the conducted research.
The fourth stage focuses in the conversion of the automotive SC conceptual model in the simulation model, with the help of simulation software, namely Rockwell Arena 9.0 that uses a SIMulation ANalysis (SIMAN) programming language.
There follows the verification stage, which consists in evaluating if the simulation model is consistent with the designed conceptual model. It is also fundamental to understand if the correct model was built, i.e., validate the output of the simulation model.
Chapter 1. Introduction
4
Chapter 1. Introduction
1.4. Organisation of this dissertation
The dissertation is organised in the following chapters:
The first chapter provides a brief introduction, regarding the scope of the study, the objectives and the research methodology;
Chapters 2 and 3 refer to the literature review of the topics SCM and interoperability, respectively;
In chapter 4, a brief literature review about SC simulation is presented. Furthermore, this chapter describes the automotive SC along with the conceptual model and every data and parameters that are assumed for the simulation model development. Finally, the simulation model results are presented, followed by a sensibility analysis;
The main conclusions and suggested research work are presented in the final chapter;
2.1. Paradigms and practices review
2.1.1. Lean
2.1.2. Agile
2.1.3. Resilient
2.1.4. Green
2.2. Paradigms combination
2.3. Characteristics
2.4. Performance measurement
Chapter 2.
Supply Chain Management
In today’s global market, organisations have focused their strategies on inter-functional and inter-organisational integration and coordination across the intricate network of business relationships (Lambert & Cooper, 2000; Min & Zhou, 2002). This new way of doing business allows answering to an increasing rate of change, providing the right products and services on time, with the required specifications, at the right place to the customer (Carvalho, Azevedo, & Cruz-Machado, 2011). In this context, Supply Chains (SC’s) have become a key concept among the organisations to achieve overall competitiveness.
A SC can be described as a network that links various agents, from the customer to the supplier, through manufacturing and services so that the flow of materials, money and information can be effectively managed to meet the business requirements (Stevens, 1989). In other words, extends from the original supplier or source to the ultimate customer (Blanchard, 2010).
Currently there is the assumption that SC’s compete instead of organisations (Christopher & Towill, 2000). So, the term Supply Chain Management (SCM) appears to determine, mainly by the market, the success or failure of SC. In literature review there are present many definitions of SCM, in which some of them are presenting in Table 2.1. All these definitions have some concepts in common, such as strategic collaboration, business process management and coordination, production and inventory management and Value Added (VA) for final customer (Cabral, 2011).
Chapter 2. Supply Chain Management
8
Table 2.1 Definitions of SCM
Definition Source
“Process for designing, developing, optimising and managing the internal and external components of the supply system, including material supply, transforming materials and distributing finished products or services to customers, that is consistent with overall
objectives and strategies.”
(Spekman, Jr, & Myhr, 1998)
“The systemic, strategic coordination of the traditional business
functions and the tactics across these business functions within a particular company and across businesses within the SC, for the purposes of improving the long-term performance of the individual companies and the SC as a whole.”
(Mentzer et al., 2001)
“Based on the integration of all activities that add value to customers starting from product design to delivery.”
(Gunasekaran & Ngai, 2004)
“The coordination of production, inventory, location, and
transportation among the participants in a SC to achieve the best mix of responsiveness and efficiency for the market being served.”
(Hugos, 2006)
“A set of approaches utilized to efficiently integrate suppliers, manufacturers, warehouses, and stores, so that merchandise is produced and distributed at the right quantities, to right locations, and at the right time, in order to minimize system wide costs while satisfying the service level requirements.”
(Simchi-Levi, Kaminsky, & Simchi-Levi, 2008)
2.1. Paradigms and practices review
In the definition of SCM there are four paradigms that have emerged to achieve the upmost competitiveness. The Lean, Agile, Resilient and Green (LARG) paradigms have thus far been explored individually, or by integrating only a couple, e.g., Lean vs. Agile (Naylor, Naim, & Berry, 1999) or Lean vs. Green (Kainuma & Tawara, 2006). Nevertheless, the ability to integrate these four different management paradigms may help SC to become more efficient, streamlined and sustainable (Carvalho, et al., 2011).
Chapter 2. Supply Chain Management
The implementation of these practices, which can belong to one or more paradigm, and the measurement of different impact on each paradigm, can improve SCM performance (Cabral, 2011).
2.1.1. Lean
The Lean Management (LM) paradigm, developed by Ohno (1998) of the Toyota Motor Corporation in Japan, forms the basis for the Toyota Production System with two main pillars:
‘autonomation’ and ‘Just-In-Time (JIT)’ production.
There are many definitions of Lean philosophy in literature and all of them have the same principles. According to Womack, Jones, & Roos (1991), the Lean paradigm is an approach which provides a way to do more with less human effort, equipment, time and space, while coming closer to customer requirement. Motwani (2003) argued that LM is an enhanced of mass production. Reichhart & Holweg (2007) had extended the concept of Lean production to the downstream or distribution level: “We define Lean distribution as minimizing waste in the downstream SC, while making the right product available to the end customer at the right time and location”.
Several authors have highlighted Lean key principles, such as: respect for people (Treville & Antonakis, 2006), quality management (Brown & Mitchell, 1991), pull production (Brown & Mitchell, 1991) and mistake-proofing (Stewart & Grout, 2001). At the operational level, these principles led to a number of techniques, like: Kanban, 5S, visual control, takt-time, Poke-yoke and Single Minute Exchange of Dies (SMED) (Melton, 2005). In addition to these techniques manufacturing practices, such as JIT, Total Productive Maintenance (TPM) and Total Quality Management (TQM) are used to eliminate various types of waste (Melton, 2005).
Table 2.2 shows a set of Lean practices that was selected to assess various levels of the SC to contribute to waste elimination and cost reduction.
Table 2.2 Lean practices
SCM practice Source
L1: Customer relationships
(Anand & Kodali, 2008; Berry, Christiansen, Bruun, & Ward, 2003; Doolen & Hacker, 2005)
L2: JIT (Focal Firm, FF)
(Anand & Kodali, 2008; Berry, et al., 2003; Gurumurthy & Kodali, 2009; Mahidhar, 2005;
Shah & Ward, 2003)
Chapter 2. Supply Chain Management
10
SCM practice Source
L4: JIT (First tier Suppliers, 1tS FF)
(Anand & Kodali, 2008; Berry, et al., 2003; Gurumurthy & Kodali, 2009; Mahidhar, 2005;
Shah & Ward, 2003)
L5: Pull flow
(Anand & Kodali, 2008; Doolen & Hacker, 2005; Gurumurthy & Kodali, 2009; Mahidhar, 2005;
Shah & Ward, 2003)
L6: Supplier relationships/long-term business relationships
(Anand & Kodali, 2008; Berry, et al., 2003; Gurumurthy & Kodali, 2009; Mahidhar, 2005;
Shah & Ward, 2003)
L7: TQM
(Berry, et al., 2003; Doolen & Hacker, 2005; Gurumurthy & Kodali, 2009; Mahidhar, 2005;
Shah & Ward, 2003)
2.1.2. Agile
The SC objective is to delivering the right product, in the right quality, in the right condition, in the right place, at the right time, for the right cost (Azevedo, et al., 2011a). To overcome these conditions, SC’s must be adaptable to future changes to respond appropriately to market requirements and changes (Azevedo, et al., 2011a). In this context, the concept of Agile manufacturing was coined by a group of researchers at Iaccoca Institute of Lehigh University in USA, in 1991 (Yusuf, Sarhadi, & Gunasekaran, 1999).
The origins of agility as a business concept lies in flexibility, named Flexible Manufacturing Systems (Christopher, 2000). Agility is a business-wide capability that embraces organisational structures, Information Systems (IS), logistics processes, and, in particular, mindsets (Christopher, 2000).
Chapter 2. Supply Chain Management
Nonetheless, a SCM paradigm should not be considered as a unique solution to a system. In this perspective, the designation Leagile emerged to divide the part of the SC that responds directly to the customer (demand is variable and high product variety) from the part that uses forward planning and strategic stock to buffer against the demand variability (demand is smooth and products are standard) (Naylor, et al., 1999). This means the Lean principles are followed up to the decoupling point and Agile practices are followed after that point.
Agile practices reflect the ability to respond quickly to unpredictable changes. Table 2.3 shows some Agile practices that can be implemented in different levels of the SC.
Table 2.3 Agile practices
SCM practice Source
A1: Ability to change delivery times of
supplier’s order (Swafford, Ghosh, & Murthy, 2008)
A2: Centralized and collaborative planning (Agarwal, et al., 2007)
A3: To increase frequencies of new product introduction
(Agarwal, et al., 2007; C.-T. Lin, Chiu, & Chu, 2006; Swafford, et al., 2008)
A4: To reduce development cycle times (Swafford, et al., 2008)
A5: To speed in improving customer service (Agarwal, et al., 2007; Swafford, et al., 2008)
A6: To use IT to coordinate/integrate
activities in design and development (Agarwal, et al., 2007; Swafford, et al., 2008)
A7: To use IT to coordinate/integrate activities in manufacturing
(Agarwal, et al., 2007; C.-T. Lin, et al., 2006; Swafford, et al., 2008)
2.1.3. Resilient
Many organisations designed their SC’s with the principal objective of minimizing cost or optimising service (Tang, 2006). However, today’s market is continuously affected by environmental and external actions, which inserts the concept of resilience as a way to cope with higher levels of turbulence and volatility. Resilience is seen in materials science and engineering as the ability of a material to return to its original state, when it is changed or deformed elastically.
Chapter 2. Supply Chain Management
12
The goal of SC resilience analysis and management is to prevent the shifting to undesirable states, i.e., the ones where failure modes could occur (Azevedo, et al., 2011b). In SC’s systems, the purpose is to react efficiently to the negative effects of disturbances (which could be more or less severe) (Azevedo, et al., 2011b). The aim of resilience strategies has two manifolds (Haimes, 2006):
To recover the desired values of the states of a system that has been disturbed, within an acceptable time period and at an acceptable cost;
To reduce the effectiveness of the disturbance by changing the level of the effectiveness of a potential threat.
The principles of designing resilience in SC are outlined by (Christopher & Peck, 2004): selecting SC strategies that keep several options open; re-examining the ‘efficiency vs.
redundancy’ trade-off; developing collaborative working across SC’s to help mitigating risk; developing visibility to a clear view of upstream and downstream inventories, demand and supply conditions, and production and purchasing schedules; improving SC velocity through streamlined processes, reduced in-bound lead times and NVA time reduction.
However, resilience is not always desirable if an organisation intends to increase profitability. For instance, Lean paradigm purpose is to have a low inventory level for reducing inventory cost, which makes it less Resilient. Therefore, the implementation of hybrid solutions that combine the previous paradigms with resilience could be difficult in some production scenarios (Espadinha-Cruz, 2012).
Table 2.4 shows a set of Resilient practices that can be implemented in different level in the chain, reflecting the entity ability to cope with unexpected disturbances.
Table 2.4 Resilient practices
SCM practice Source
R1: Creating total SC visibility (Iakovou, Vlachos, & Xanthopoulos, 2007)
R2: Developing visibility to a clear view of
downstream inventories and demand conditions (Christopher & Peck, 2004)
R3: Flexible supply base/flexible sourcing (Tang, 2006)
R4: Flexible transportation (Tang, 2006)
R5: Lead time reduction (Christopher & Peck, 2004; Tang, 2006)
R6: Sourcing strategies to allow switching of
suppliers (Rice & Caniato, 2003)
R7: Strategic stock
Chapter 2. Supply Chain Management
2.1.4. Green
In the past decades, environmental issues and global warming are becoming a subject of concern to organisations. Environment is the main focus of Green Supply Chain Management (GSCM) but, instead of focusing on the way environmental agents affect SC’s, Green concerns
with the effects of SC’s activity on environment (Rao & Holt, 2005). The increased pressure from society and environmentally conscious consumers had lead to rigorous environmental regulations, such as the Waste Electrical and Electronic Equipment Directive in the European Union, forcing the manufacturers to effectively integrate environmental concerns into their management practices (Paulraj, 2009; Rao & Holt, 2005).
Although ecologically adopted legislative requirements, ecological responsiveness also led to sustained competitive advantage, improving their long-term profitability (Paulraj, 2009). GSCM has emerged as an organisational philosophy by which to achieve corporate profit and market-share objectives by reducing environmental risks and impacts while improving the ecological efficiency of such organisations and their partners (Rao & Holt, 2005; Sarkis, 2003).
According to Srivastava (2007), GSCM is an integrating environment thinking into SCM, including product design, material sourcing and selection, manufacturing processes, delivery of the final product to the consumers as well as end-of-life management of the product after its useful life. GSCM can reduce the ecological impact on industrial activity without sacrificing quality, cost, reliability, performance or energy utilization efficiency; meeting environmental regulations to not only minimize ecological damage but also to ensure overall economic profit (Srivastava, 2007).
In term, the impact of the antecedents and drivers for a Green SC may be diverse across
different SC’s with different manufacturing processes, with different raw materials, conversion
processes, product characteristics, logistics/reverse logistics activities (Routroy, 2009).
The GSCM practices should aim at the reduction of environment impact. Table 2.5 shows some GSCM practices.
Table 2.5 Green practices
SCM practice Source
G1: Environmental collaboration with suppliers
(Holt & Ghobadian, 2009; Hu & Hsu, 2010; Lippmann, 1999; Vachon, 2007; Zhu, Sarkis, & Lai, 2007, 2008a, 2008b)
G2: Environmental collaboration with the customer
Chapter 2. Supply Chain Management
14
SCM practice Source
G3: Environmental monitoring upon suppliers
(Holt & Ghobadian, 2009; Hu & Hsu, 2010; Paulraj, 2009; Vachon, 2007; Zhu,
et al., 2008a)
G4: ISO 14001 certification
(Holt & Ghobadian, 2009; Hu & Hsu, 2010; Rao & Holt, 2005; Vachon, 2007;
Zhu, et al., 2007, 2008a, 2008b)
G5: Reverse logistics
(Hu & Hsu, 2010; Lippmann, 1999; Rao & Holt, 2005; Routroy, 2009; Vachon, 2007;
Zhu, et al., 2007)
G6: To reduce energy consumption
(González, Sarkis, & Adenso-Díaz, 2008; Holt & Ghobadian, 2009; Paulraj, 2009;
Rao & Holt, 2005)
G7: To reuse/recycling materials and packaging
(Holt & Ghobadian, 2009; Paulraj, 2009; Rao & Holt, 2005; Vachon, 2007)
2.2. Paradigms combination
In today’s business environment the challenge is to integrate the previous four paradigms on
the same SC. It may be difficult to categorize an organisation as being Lean, Agile, Resilient or Green. Therefore, it is essential to extend knowledge of the trade-offs between these four paradigms, assessing their contribute for efficiency, streamlining and sustainability of SC’s.
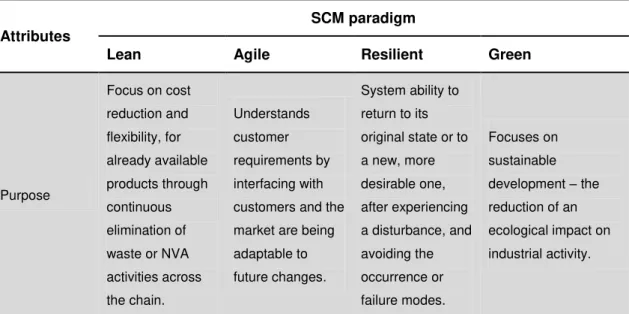
Table 2.6 presents the principal attributes of Lean, Agile, Resilient and Green Supply Chains (LARG SC’s), based on 10 attributes.
Table 2.6 LARG attributes (Carvalho, et al., 2011)
Attributes
SCM paradigm
Lean Agile Resilient Green
Purpose
Focus on cost reduction and flexibility, for already available products through continuous elimination of waste or NVA activities across the chain. Understands customer requirements by interfacing with customers and the market are being adaptable to future changes.
System ability to return to its original state or to a new, more desirable one, after experiencing a disturbance, and avoiding the occurrence or failure modes.
Chapter 2. Supply Chain Management
Attributes
SCM paradigm
Lean Agile Resilient Green
Manufacturing focus
Maintains a high average utilization rate uses JIT practices, “pulling” the goods through the system based on demand.
Has the ability to respond quickly to varying customer needs (mass customization); it deploys excess buffer capacity to respond to market requirements.
The emphasis is on flexibility (minimal batch sizes and capacity redundancies); the schedule planning is based on shared information.
Focuses on efficiency and waste reduction for environmental benefit and development of remanufacturing capabilities to integrate reusable/remanufactu red components. Alliance (with suppliers and customers)
May participate in traditional alliances such as partnerships and joint ventures at the operational level.
Exploits a dynamic type of alliance known as “virtual
organisation” for product design.
SC partners join an alliance network to develop security practices and share knowledge. Inter-organisational collaboration involving transferring or/and disseminating Green knowledge to partners and costumer cooperation.
Organisational structure
Uses a static organisational structure with few levels in the hierarchy.
Creates virtual organisations with partners that vary with different product offerings that change frequently.
Creates a SC risk management culture.
Creates an internal environmental management system and develops environmental criteria for risk-sharing. Approach to choosing suppliers Supplier attributes involve low cost and high quality.
Supplier attributes involve speed, flexibility, and quality.
Chapter 2. Supply Chain Management
16
Attributes
SCM paradigm
Lean Agile Resilient Green
Inventory strategy Generates high turns and minimizes inventory throughout the chain. Makes decisions in response to customer demands.
Strategic emergency stock in potential critical points.
Introduces
reusable/remanufactu red parts in the material inventory; reduces replenishment frequencies to decrease carbon dioxide emissions; reduces redundant materials. Lead time focus Shortens lead time as long as it does not increase cost.
Invests aggressively in ways to reduce lead times.
Reduces lead time.
Reduces
transportation lead time as long it does not increase carbon dioxide emissions. Product design strategy Maximizes performance and minimizes cost. Designs products to meet individual customer needs.
Postponement.
Eco-design and incorporation of complete material life cycle for evaluating ecological risks and impact.
Product variety Low. High. High.
For a multiproduct analysis environmental management decisions become increasingly complex. Market
Serves only the current market segments, with a predictable demand.
Acquires new competencies, develops new product lines, and opens up new markets with a volatile demand.
Have the capabilities to act on and anticipate changes in markets and overcome demand risk. Demands more environmentally-friendly practices.
Chapter 2. Supply Chain Management
In terms of product variety, an Agile and Resilient organisation must produce a high variety of products, while Lean paradigm is focused to produce improvements in resource productivity. As concerns about the Green, multiproduct analysis depends on the environmental impact.
Although these four paradigms seem to be contradictory, it would be ideal to combine two or more paradigms. The managers have to overcome these challenges, reconciling divergent paradigms to find the best strategies for their SC’s.
2.3. Characteristics
To develop a fully integrated SC, it is necessary the evaluation of the paradigms practices contribution for SC performance. Since it would be difficult to analyse all possible relationships between performance measures and the paradigm implementation (designed by “management
characteristics”), the study was limited to the principal paths between the Key Performance Indicators (KPI’s) and management characteristics (Carvalho, et al., 2011).
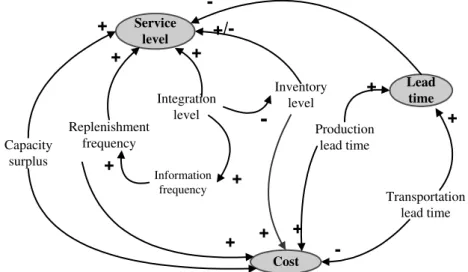
Figure 2.1 contains the causal diagram with the performance indicators, namely service level, lead time and cost, and management characteristics relationships.
Figure 2.1 Performance indicators and management characteristics relationships (Carvalho, et al., 2011)
The causal diagram represented in Figure 2.1 depicts that, for example, the KPI “service level” is affected positively by the replenishment frequency (it increases the capacity to fulfil rapidly the material needs in SC) (Holweg, 2005), capacity surplus (a slack in resources will increases the capacity for extra orders production) (Jeffery, Butler, & Malone, 2008) and integration level (the ability to co-ordinate operations and workflow at different tiers of the SC allow to respond to
changes in customer’ requirements) (Gunasekaran, Lai, & Edwincheng, 2008). The lead time reduction improves the service level (Agarwal, et al., 2007).
-Chapter 2. Supply Chain Management
18
High inventory levels generate uncertainties (Vorst & Beulens, 2002), leaving the SC more vulnerable to sudden changes (Marley, 2006), and therefore reducing the service level in volatile conditions. There are some relationships between the management characteristics, for instance, the inventory level is affected negatively by the increasing of the integration level (since it increases the procurement flexibility, minimizing the need for material buffers),
decreasing the flexibility to meet current customers’ demand (Carvalho, et al., 2011). This impact will reflect in Lean (we should have low inventory level to decrease the carrying cost) and Resilient (with low inventory level, we lose our capacity to respond to unexpected disruptions) paradigms and/or perhaps in Green (Cabral, 2011).
The trade-offs between LARG paradigms must be understood to help companies and SC’s to become more efficient, streamlined and sustainable (Carvalho, et al., 2011). To this end, it is necessary to develop a deep understanding of the relationships (conflicts and commitments) between the LARG paradigms, exploring and researching their contribute for the sustainable competitiveness of the overall production systems in the SC (Carvalho, et al., 2011).
Table 2.7 shows an overview of main synergies and divergences between the LARG paradigms.
Table 2.7 Paradigms synergies and divergences overview (Carvalho, et al., 2011)
Lean Agile Resilient Green
Information frequency -
S
yne
rg
ies
Integration level
Production lead time
Transportation lead time
Capacity surplus Dive
rg
ence
s
Inventory level
Replenishment frequency
There are evidences that the LARG paradigms are completed by each other (Carvalho, et al., 2011). The implementation of these paradigms in the SC creates synergies in the way that some SC characteristics should be managed, namely, “information frequency”, “integration
level”, “production lead time” and “transportation lead time” (Carvalho, et al., 2011). However,
the impact of each paradigm implementation in the characteristic’s magnitude may be different
Chapter 2. Supply Chain Management
However, the Resilient paradigm, although it prescribes this reduction in lead times, it is not so compulsive, since the objective is to increase the SC visibility and capability to respond to unexpected disturbance (Carvalho, et al., 2011).
2.4. Performance measurement
The performance evaluation is an indispensable management tool to better SCM. Hence, performance measures are established to achieve goals and are provided with the intent to monitor, guide and improve across the different entities on the SC, and can encompass a variety of different metrics (Espadinha-Cruz, 2012). Research contributions from Azevedo, et al. (2011b) provide a set of performance measures that can be seen in Table 2.8.
Table 2.8 SC performance measures (Azevedo, et al., 2011b)
Measures Metrics Source
E con o mic P e rf o rman ce Cost
Cost per operating hour (Pochampally, Nukala, & Gupta, 2009)
Manufacturing cost (Christiansen, Berry, Bruun, & Ward, 2003)
New product flexibility (Pochampally, et al., 2009)
Efficiency
Operating expenses (Jiang, Frazier, & Prater, 2006)
Overhead expense (Jiang, et al., 2006)
Environmental costs
Costs for purchasing environmentally friendly materials
(Zhu, Sarkis, & Geng, 2005)
Cost of scrap/rework (Christiansen, et al., 2003)
Disposal costs (Tsai & Hung, 2009)
Fines and penalties (Hervani, Helms, & Sarkis, 2005)
R & D expenses ratio (Pochampally, et al., 2009)
Recycling cost = transport
+ storage costs (Tsai & Hung, 2009)
Environmental revenues
Cost avoidance from
Chapter 2. Supply Chain Management
20
Measures Metrics Source
Revenues from ‘green’
products (Hervani, et al., 2005)
E n vir o n m ent al P er fo rman ce Business wastage
Hazardous and toxic material output
(Hervani, et al., 2005; Zhu, et al., 2005)
Percentage of materials
recycled/re-used (Beamon, 1999)
Percentage of materials
remanufactured (Hervani, et al., 2005)
Solid and liquid wastes (Zhu, et al., 2005)
Total flow quantity of scrap (Beamon, 1999; Tsai & Hung, 2009)
Emissions
Air emission (Zhu, et al., 2005)
Energy consumption (Hervani, et al., 2005; Zhu, et al., 2005)
Green house gas
emissions (Hervani, et al., 2005)
Green image
Number of
fairs/symposiums related to environmentally conscious manufacturing the
organisation participate
(Pochampally, et al., 2009)
O p er atio n al P e rf o rman c e Customer satisfaction After-sales service
efficiency (Pochampally, et al., 2009)
Out-of-stock ratio (Kainuma & Tawara, 2006)
Rates of customer complaints
(Cai, Liu, Xiao, & Liu, 2009; Soni & Kodali, 2009)
Delivery
Delivery reliability (Soni & Kodali, 2009)
On time delivery (Pochampally, et al., 2009; Soni & Kodali, 2009)
Responsiveness to urgent
deliveries (Soni & Kodali, 2009)
Inventory levels Finished goods equivalent units
(Goldsby, Griffis, & Roath, 2006)
Chapter 2. Supply Chain Management
Measures Metrics Source
Level of safety stocks (Sheffi & Rice, 2005)
Order-to-ship (Goldsby, et al., 2006)
Quality
Customer reject rate (Christiansen, et al., 2003)
In plant defect fallow rate (Christiansen, et al., 2003; Hugo & Pistikopoulos, 2005)
Increment products quality (Pochampally, et al., 2009)
Time
Cycle times (Martin & Patterson, 2009)
Delivery lead time (Soni & Kodali, 2009)
Lead time (Naylor, et al., 1999) Inventory levels
O
p
er
atio
n
al
P
e
rf
o
rman
c
3.1. Concept review
3.2. Business interoperability
3.3. Interoperability measurement
3.4. Perspectives of interoperability
3.4.1. Syntax
3.4.2. Semantics
3.4.3. Pragmatics
Chapter 3.
Interoperability
Interoperability issues arise whenever systems or organisations need to exchange information and work together to achieve common goals (Espadinha-Cruz, 2012). In today’s economy, networked business models are becoming an indisputable reality which allows organisations to offer innovate products and services and the efficient business conduction (Legner & Lebreton, 2007). However, there are many barriers in internal and external relationships, namely conceptual, technological and organisational.
In Supply Chain Management (SCM) context, it is needed to be as efficient as possible in the planning and execution processes, in order to have an internal and external stable network (Espadinha-Cruz, 2012). However, even in a well-structured and integrated network, interoperability issues are always presents (Espadinha-Cruz, 2012).
Interoperability has been often discussed from a purely technical perspective, focusing on technical standards and Information Systems (IS) architectures (Legner & Lebreton, 2007). During its research, Legner & Lebreton (2007) feel that there was a lack of systematic analysis of strategic, organisational and operational issues associated with interoperability. Most of publications have explored interoperability in specific industry domains where compatibility is still low, such as: public sector (Guijarro, 2007; Kaliontzoglou, Sklavos, Karantjias, & Polemi, 2005; Otjacques, Hitzelberger, & Feltz, 2007; Roy, 2006), health care (Eckman, Bennett, Kaufman, & Tenner, 2007; Egyhazy & Mukherji, 2004), manufacturing (Brunnermeier & Martin, 2002; H.-K. Lin, Harding, & Shahbaz, 2004) and telecommunications (Moseley, Randall, & Wiles, 2004).
3.1. Concept review
In literature review, several definitions of the concept of interoperability exist. This concept has been constantly varying as the concern for the subject increases (Espadinha-Cruz, 2012). Most organisations extend this preoccupation to business level (Espadinha-Cruz, 2012).
Chapter 3. Interoperability
24
Table 3.1 Interoperability definitions
Definition Source
“The ability of two or more systems or components to exchange
information and to use the information that has been exchanged.” (IEEE, 1990)
“The capability to communicate, execute programs, or transfer data among various functional units in a manner that requires the user to have little or no knowledge of the unique characteristics of those units.”
(ISO, 1993)
“The ability of a system to communicate with peer systems and access
their functionality.” (Vernadat, 1996)
“The ability of systems, units, or forces to provide services to and accept services from other systems, units, or forces, and to use the services so exchanged to enable them to operate effectively together.”
(DoD, 1998)
“Ability of interaction between enterprise software applications.” (IDEAS, 2003)
“The ability of information and communication technology systems and
of the business processes they support to exchange data and to enable sharing of information and knowledge.”
(IDA, 2004)
“(1) The ability to share information and services;
(2) The ability of two or more systems or components to exchange and use information;
(3) The ability of systems to provide and receive services from other systems and to use the services so interchanged to enable them to operate effectively together.”
(OpenGroup, 2009)
Looking at all these definitions, one can deduce that the interoperability is the ability of two or more systems to share and use information in order to operate effectively together with the objective to create value. Nevertheless, to DoD (1998) interoperability is more than systems and interaction with systems to electronic exchange information. In this definition it is also exposed the human perspective. These perspectives have been extended to the enterprise reality, enclosing Information Technology (IT) structures, business processes and strategy (Espadinha-Cruz, 2012).
3.2. Business interoperability
Chapter 3. Interoperability
In the context of the ATHENA project, business interoperability is defined as “the organisational
and operational ability of an enterprise to cooperate with its business partners and to efficiently establish, conduct and develop IT-supported business relationships with the objective to create
value” (ATHENA, 2006). Based on this definition, business interoperability involves specific characteristics of the inter-organisational design of a company’s external relationships (ATHENA, 2006). It extends the more technical focussed notion of interoperability to cover organisational and operational aspects of setting up and running IT-supported relationships (ATHENA, 2006). As such, business interoperability builds on the concept of networkability (Osterle, Fleisch, & Alt, 2001; Wigand, Picot, & Reichwald, 1997) which is a continuation of coordination theory and sees coordination as the management of relationships of dependence (ATHENA, 2006).
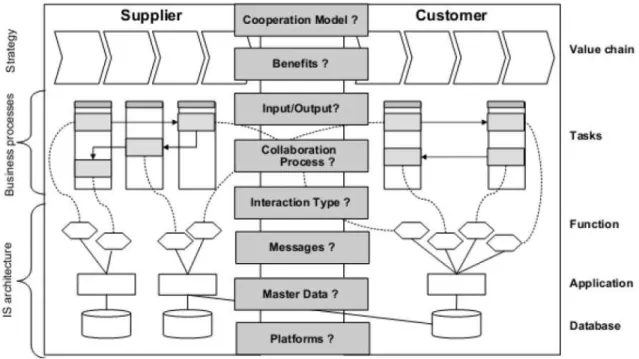
Figure 3.1 depicts the hierarchical nature of business interoperability that most architectural and model based approaches to the subject stress at (Zutshi, 2010).
Figure 3.1 Different aspects of interoperability (ATHENA, 2006)
This figure shows that any model of business interoperability would comprise of the strategy at the highest level, followed by business process and the IS architecture coming at the lowest level (Zutshi, 2010). Business interoperability requires the multi-layered collaboration with each level complementing the other for the smooth functioning of the overall collaboration (Zutshi, 2010).
Chapter 3. Interoperability
26
3.3. Interoperability measurement
The measurement of interoperability is part of the sensitive analysis of identification and improvement of problems of interoperability (Espadinha-Cruz, 2012). In the context of business interoperability, Legner & Lebreton (2007) argue that research efforts must be spent in finding out which level of interoperability a firm struggle for. The first proposed step is to define where a firm currently is and where it should be (Legner & Lebreton, 2007). For this purpose, interoperability frameworks, such as DoD (1998) and EIF (2004), already provide a concept to perform such kind of assessment but the determination of the target level of interoperability still remains, to a greater extent, heuristic. For instance, in a strongly IT-supported automotive Supply Chain (SC), interoperability level is expected to be high, in order to deal with the complexity of products (Espadinha-Cruz, 2012).
This considerations lead to the introduction of the concept of optimal interoperability (Espadinha-Cruz, 2012). Since is not possible to assign a target to optimal level of interoperability valid for all types of collaboration, this level should be established for each type of business (Espadinha-Cruz, 2012). For example, IS in the tourism industry especially related to hotel booking cannot be so tightly integrated as tourism agencies want to target the maximum reach of hotels and lodges (Zutshi, 2010).
In the literature, interoperability measurement is addressed by two different kinds: qualitative and quantitative. Whereas the first approach refers to model-driven approaches, the quantitative approach is used to estimate states of lack of interoperability (Espadinha-Cruz, 2012).
3.4. Perspectives of interoperability
In literature review it is possible to conclude that the study of interoperability consists on three principal phases: syntactic, semantic and pragmatic (Espadinha-Cruz, 2012).
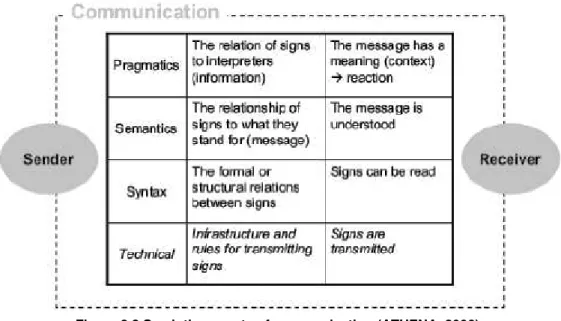
In the communication theory, the semiotics view defines it as a transmitting message from a sender to a receiver using a channel (ATHENA, 2006). As depicted in Figure 3.2, this communication involves three subjects (ATHENA, 2006):
Syntax –studies the structure of the message;
Semantics – refers to the relation between signs and the objects to which they apply
and enable the receiver of a message to understand it;
Pragmatics - adds some aspects of the practice to a better understanding of the
theory.
Chapter 3. Interoperability
Similarly, in business interoperability aspects of semantics and pragmatics are related to a message, whereas technical interoperability is more related to syntactical and infrastructure aspects (ATHENA, 2006)
Figure 3.2 Semiotic aspects of communication (ATHENA, 2006)
3.4.1. Syntax
In traditional grammar, syntax is the “arrangement of words (in their appropriate forms) by which
their connection and relation in a sentence are shown” or “the department of grammar which
deals with the established usages of grammatical construction and the rules deducted
therefrom” (Oxford English Dictionary). Veltman (2001) refers to it as “grammars to convey semantics and structure”.
In interoperability, the syntactic phase is characterized by describing various sets of rules and principles that describe the language and structure for the information (Espadinha-Cruz, 2012). If two or more systems are capable of communicating and exchanging data, they exhibit syntactic interoperability (Espadinha-Cruz, 2012). For instance, XML (Extensible Markup Language) is seen as a mark-up idiom for structured data on web (Veltman, 2001). Hence, with syntax in the traditional sense, the challenges of syntactic interoperability become (Veltman, 2001):
a) Identifying all the elements in various systems; b) Establishing rules for structuring these elements;
c) Mapping, bridging, creating crosswalks between equivalent elements using schemes etc.;
Chapter 3. Interoperability
28
3.4.2. Semantics
Semantics is defined as the meanings of terms and expressions (Veltman, 2001). It focuses on the relation between signifiers (in linguistic, words, phrases and symbols), and what they stand for, their denotation (Espadinha-Cruz, 2012). Hence, semantic interoperability is “the ability of IS to exchange information on the basis of shared, pre-established and negotiated meanings of
terms and expressions”, and is needed in order to achieve other types of interoperability work (Veltman, 2001).
Besides the technological perspective, in medicine, for instance, the definition of the aorta must be the same around the world if doctors in Berlin, Rio, Shanghai, Sydney and Los Angeles all have to operate on the heart (Veltman, 2001).
The role of semantic interoperability is to develop a deep understanding of the structure beyond the information (Espadinha-Cruz, 2012). If the syntax, on the one hand, governs the structure of data (XML and Structured Query Language, SQL), on the other hand, the semantics should regulate the meaning of the terms in the expression, and make it compatible between systems (Espadinha-Cruz, 2012). To achieve semantic interoperability, both sides must refer to a common information exchange reference model (Espadinha-Cruz, 2012). The content of the information exchange requests are explicitly defined: what is sent is the same as what is understood (Espadinha-Cruz, 2012). If there is any context sensitivity to the way terms are used, then the context must also be specified as part of the information using those terms (Espadinha-Cruz, 2012). To ensure semantic interoperability, the meaning of the syntactic elements should be understood by collaborating systems (Asuncion & van Sinderen, 2010).
3.4.3. Pragmatics
Pragmatics or pragmatism is derived from the Greek etymology that means “to do”, "to act” or
“to be practical” (Asuncion & van Sinderen, 2010). It describes the process where theory is extracted from practice, and applied back to practice to form what is called intelligent practice (Espadinha-Cruz, 2012).
4.1. General overview
4.2. Storyline
4.3. Model development: an automotive Supply Chain
4.3.1. Supply Chain characterization
4.3.2. Characteristics and assumptions
4.3.3. Conceptual model
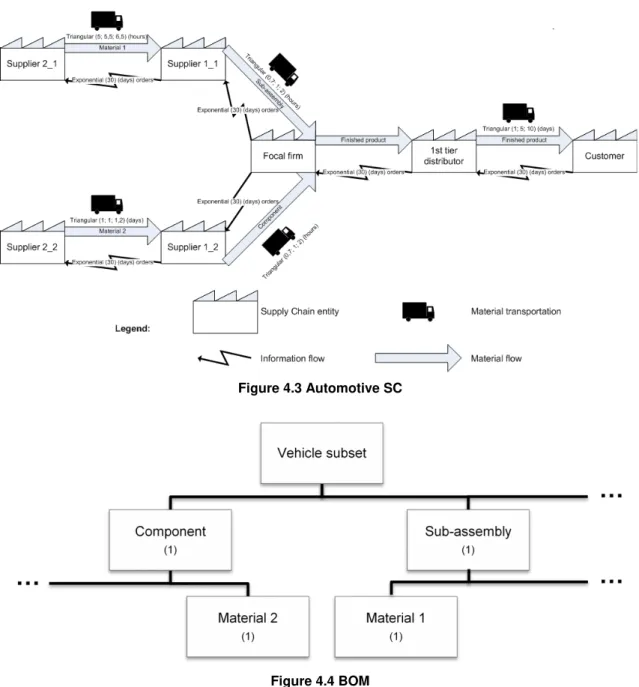
4.3.4. Input data and parameters
4.3.5. Simulation model
4.4. Results and discussion
Chapter 4.
Supply Chain simulation
In Supply Chain Management (SCM) context, there are still evident problems to overcome, particularly in designing, evaluating and optimising Supply Chains (SC’s). From the Information Technology (IT) perspective, among all the multi-decisional techniques supporting a logistics network, simulation appears as an essential tool that allow the quantitative evaluation of benefits and issues deriving from a co-operative environment. This combination should provide the basis for a realistic simulation model, which is both transparent and complete (Zee & Vorst, 2005). The need for transparency is especially strong for SC’s as they involve (semi)autonomous parties each having their own objectives (Zee & Vorst, 2005). Mutual trust
and model effectiveness are strongly influenced by the degree of completeness of each party’s
insight into the key decision variables (Zee & Vorst, 2005).
The choice of the level of detail is also an important issue in SC models (Persson & Araldi, 2009). Despite the model’s level of detail being one of the major difficulties is SC simulation, it is not uncommon to simulate at a level of detail that does not match the objective of the analysis (Persson & Araldi, 2009).
4.1. General overview
In the past two decades, a large number of simulation tools for SC analysis have been developed (Zee & Vorst, 2005). Some of these tools are internal packages developed and used by a single company (Zee & Vorst, 2005). Besides these, some commercially available packages were also developed (Zee & Vorst, 2005). Most of these packages are not built from scratch, but concern applications of general-purpose simulation languages, such as, for example, Arena (Kelton, Sadowski, & Sadowski, 1998), Micro Saint (Micro Analysis & Design, 1998), and Extend (Imagine That, 1997).
Chapter 4. Supply Chain simulation
30
The main reasons to use discrete-event simulation for system analysis in SCM are (Persson & Araldi, 2009):
The possibility to include dynamics;
The simplicity of modelling.
However, its suitability does not guarantee adequate decision support, that is, mutually accepted candidate SC scenarios for which a high performance is indicated (Zee & Vorst, 2005). After all, simulation boils-down to a heuristic search for good quality solutions led by people (Zee & Vorst, 2005). Therefore, the success of a simulation study largely depends on the joint availability and use of the skills of the analyst and the chain members, as well as the facilities offered by the simulation tool (Zee & Vorst, 2005).
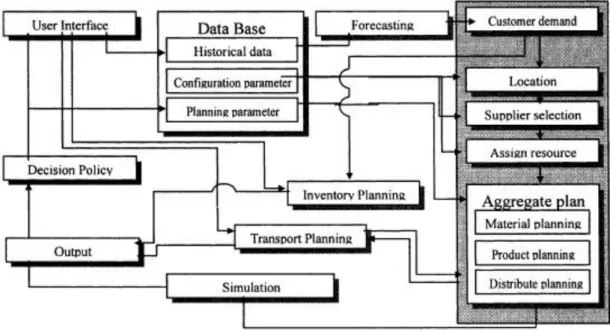
Figure 4.1 illustrates the basic process flow that is useful for SC simulation (Lee, et al., 2002). This procedure first reads all data required by a graphic user interface (Lee, et al., 2002). This includes products, market, sales data, and detailed data on the operation of each facility in the SC (Lee, et al., 2002). Customer demand is then calculated through a forecasting method based on historical data (Lee, et al., 2002). After that optimisation modules (supplier selection, location, inventory, transportation, etc.) are run with the configuring and planning parameter in the database (Lee, et al., 2002).
Figure 4.1 Basic process flow for SC simulation (Lee, et al., 2002)
4.2. Storyline
Chapter 4. Supply Chain simulation
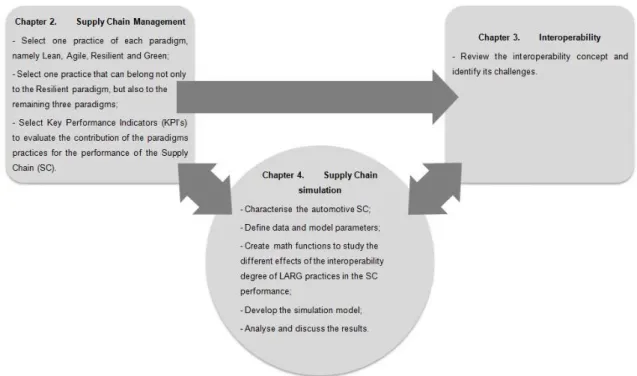
Figure 4.2 Summary of contributions to this thesis
From Figure 4.2 it can be seen that, in the context of this dissertation, SCM, interoperability and SC simulation may be directly and/or indirectly related. To achieve global success, SC’s need to overcome many barriers in internal and external relationships, namely conceptual, technological and organisational. Therefore, the implementation of Lean, Agile, Resilient and Green (LARG) practices without interoperability issues is extremely important to an effective SCM. In this perspective, simulation can help in the decision-making processes through the evaluation and comparison of virtual scenarios.
From the Information Technology (IT) perspective, among all the multi-decisional techniques supporting a logistics network, simulation appears as an essential tool that allow the quantitative evaluation of benefits and issues deriving from a co-operative environment.
In first instance, some LARG practices were selected from a SCM perspective. Considering these LARG practices, which were selected based on literature review, it were defined two different scenarios. Note that the selected LARG practices, as well as the scenarios description will be discussed with more detail at the middle of chapter 4. The analysis of both scenarios was made through Key Performance Indicators (KPI’s) such as cost, lead time and service level.
These KPI’s were selected in order to evaluate the performance of the automotive SC.