COMPUTER METHODS FOR ANALYSIS AND OPTIMIZATION OF ENERGY COMSUMPTIONS
Rotaru Simona
Spiru Haret University Faculty of Financial–Accounting Management Craiova, Romania Street Brazda lui Novac, No. 4 , [email protected], tel 0251598265
Bardas Petru
Spiru Haret University Faculty of Financial–Accounting Management Craiova, Romania Street Brazda lui Novac, No. 4, [email protected], tel 0251598265
Ghiţă Mirela Claudia
Spiru Haret University Faculty of Financial–Accounting Management Craiova, Romania Street Brazda lui Novac, No. 4, [email protected], tel 0251598265
Cocoşilă Mihaela
Spiru Haret University Faculty of Financial–Accounting Management Craiova, Romania Street Brazda lui Novac, No. 4, [email protected], tel 0251598265
The implementation of sustainable development in Romania and the abrupt increase of prices for fussil fuels have imposed more serious activies for the examination of the energy consumption in different industrial sectors. Here, the asynchronous electric motors represent the main loads; therefore the energy consumption in electrical drives has to be careffuly watched. The achievement of various procedures to improve energy efficiency, compulsory imposes an energy balance who aims to illustrate the existent profile of energy consumption .
The study presents an industry case study about estimation of operating systems functioning that use variable speed motors, highlighting the necessity and appropriateness of using informatic instruments that provide calculations needed to elaborate energy balance and by that, to determine the measures to increase energetic efficiency.
Keywords: energy efficiency, electric drive, energy balance, power factor, informatic instruments. Cod Jel: M15
Energy and Sustainable Development
Along with complex phenomena such as the explosive rate at which the world`s population continues to increase, the associated and inevitable increase in energy consumption and the reality of the environment`s decline, humanity is faced with three very perilous problems:– Economic Growth, Energy and Resource consumption, and Protecting the environment– in other words, the world is faced with an unprecedented dilemma.
For the world consumption of primary energy forecast, several important studies have been done in the last years by prestigious world organizations in developed countries.
An example of such a study is that conducted by the World Energy Council (WEC) and named Energy for Tomorrow`s World. Within this study, at which specialists and organizations of tens of countries took place, were analyzed four scenarios of world primary energy consumption evolution until 2020, compared to the situation of 1960 and 1990, both on a global level, and geographical areas.
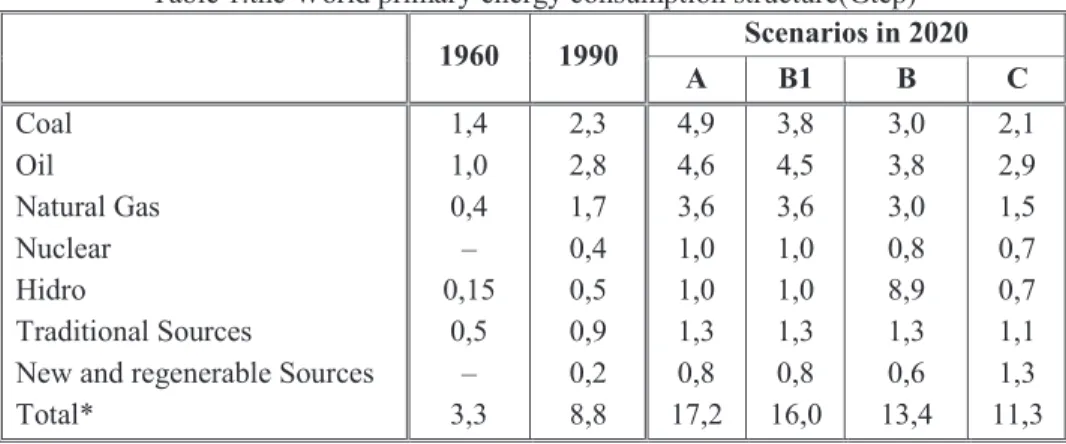
The main results of this study are summarized in Table 1.
Table 1.the World primary energy consumption structure(Gtep)
1960 1990 Scenarios in 2020
A B1 B C
Coal Oil Natural Gas Nuclear Hidro Traditional Sources
New and regenerable Sources Total* 1,4 1,0 0,4 – 0,15 0,5 – 3,3 2,3 2,8 1,7 0,4 0,5 0,9 0,2 8,8 4,9 4,6 3,6 1,0 1,0 1,3 0,8 17,2 3,8 4,5 3,6 1,0 1,0 1,3 0,8 16,0 3,0 3,8 3,0 0,8 8,9 1,3 0,6 13,4 2,1 2,9 1,5 0,7 0,7 1,1 1,3 11,3 *Differences owned to approximation
Scenarios:A – High economic development; B – reference; B1 – reference to lower energy intensity; C – .organic You can notice the following:
– While the world primary energy consumption increased 2.7 times between 1960 and 1990 a substantially smaller increase for the 1990–2020 period (28 95 %).
5.4 – 8.2 Gtep compared to 4.5 Gtep in 1990 and 1.4 Gtep in 1960; we can conclude that from the total increased consumption mentioned for 2020, the hidrocarbon ratio will reach 47 – 51% compared to 51% in 1990 and 42% in 1960, denying the pessimistic forecast made a decade ago.
In any of the scenarios, the nuclear energy does not exceed 1 Gtep in 2020, compared to a total consumption of 11.3 – 17.2 Gtep.
Energetic efficiency reflects the relationship between the production of a system and imputed energy. Improving of energetic efficiency means achieving the same effect with a small amount of energy and involves the allocation of material and human resources, whose efficient use must be analyzed. Major sources of energetic inefficiency and loss of energy that occur in materials, devices, equipment, technologies, due to their low quality (thermal insulation, building materials, heat exchangers, pumps, compressors, fans, burners, heating boilers, electrical equipment, appliances, lighting, metering, energointensive technologies, facilities, stolen energy).
Favorable factors for promoting energetic efficiency in Romania are represented by the law, institutions and existing regulations, the relatively high price of energy and fuels. Unfavorable factors (which paradoxically outperforms favorable factors) are owned to the fact that energetic efficiency is downplayed, the responsible institutions are not very active, the energetic efficiency programs are only declarative, without any practical outcome, energy audits are formal, unstimulating penalties, bad management, difficult financing.
The study presents an industry case study about estimation of operating systems functioning that use variable speed motors, highlighting the necessity and appropriateness of using informatic instruments that provide calculations needed to elaborate energy balance and by that, to determine the measures to increase energetic efficiency.
The balance of electric power to act asynchronous short circuit electric motor
An electric drive system (SAE) is represented by all elements that converting electrical energy into mechanical energy, in order to carry out a technological process. As a rule, a SAE is composed of three main components, shown in Figure 1.616
– electric engine (ME) – sub–assembly which performs mechanical conversion;
– the transmission (OT) – sub–assembly which ensures transmission of motion from the electric motor to involved car;
– machine work (ML) – sub–assembly making technological process;
– other items included in supplying device (DA) equipment such as power devices, switching, control, regulation and protection, and in which, usually, loss of significantly electricity does not appear.
General equation of energetic power balance of a SAE is expressed as617: Wi = Wu + ΔWp + Wr [kWh], (1)
Wi – the input energy in the contour balance, representing the amount between outside induced energy and that generated within the contour, [kWh];
Wu – useful energy consumed for the technological process [kWh]; ΔWp – losses of energy inside the contour, [kWh];
WR – energy released outside contour, [kWh]. Where the energy losses have the expression: ΔWp = ΔWda + ΔWme + ΔWot [kWh], (2)
ΔWda – loss of energy in power supply device, made by supply equipment, switching, control, regulation and protection, [kWh];
ΔWme – energy losses in electric motor, the sub–assembly which ensures mechanical conversion [kWh];
ΔWot – energy losses in the transmission, the sub–assembly which ensures motion transmission from the electric motor to involved car
In previous relationship, the engine power losses consist of the following elements: ΔWme = ΔWCu + ΔWFe + ΔWmot [kWh], (3)
ΔWCu – losses in wrapping [kWh];
ΔWFe – losses in the magnetic circuit, [kWh];
ΔWmot – losses in engine power, [kWh]; Since in practice, losses in the machine and in the transmission are difficult to be determined separately, they are regarded as global mechanical losses:
ΔWmec = ΔWml + ΔWot [kWh], (4)
In some situations it is difficult to separate mechanical losses in the SAE from the losses in ferromagnetic circuit of electrical machine; in these cases total energy and mechanic losses in iron and electrical power system are highlighted:
ΔWFe,m = ΔWmec + ΔWFe + ΔWmot [kWh], (5) Energetic losses in wrapping are calculated by the relationship ΔWCu = 3 * K2f * I2m * Re * τf * 10–3 * ki * ku * ks [kWh], (6) KF – form factor of the current;
Im – average intensity of electric current within the time frame to which the balance refers; Re – equivalent resistance of electric current wrapping , [Ω]
Where the equivalent resistance is: Re = R1 + R2 [Ω] (7)
R1 – the resistance on phase of stator wrapping, [Ω];
R2 – the resistance on phase of rotor wrapping reported to stator.
The equivalent mechanical energy losses in asynchronous motor with rotor in short circuit are determined as the sum of the losses in the magnetic circuit (ΔWFe) and of mechanical losses in the engine(ΔWmot);.
ΔWFe+mot = ΔWFe + ΔWmot = {P0 – 3 * R0 * I20 * 10–3}* τf * ki * ku * ks [kWh], (8)
while the energetic equivalent of mechanical losses in transmission and the working car has the expression: ΔWmec = {P0m – 3 * Re * I20m * 10–3}* τf * ki * ku * ks – ΔWFe+mot [kWh], (9)
Losses of electricity in the power cord are determined by the expression: ΔWlinie = 3 * K2f * I2m * Rlinie * τf * 10–3 * ki * ku * ks [kWh], (10)
Useful energy is calculated from the expression (1), where incoming energy is determined by measurements made at the supply panel jacks of electric actuators and losses are calculated using the expressions outlined above. Thus: Wu = Wi – ΔWp [kWh], (11) and
ΔWp = ΔWlinie + ΔWFe+mot + ΔWCu + ΔWmec [kWh], (12) Analysis of implementing energy efficiency measures
To highlight the possible measures that can be implemented in order to improve energetic efficiency of an asynchronous electric motor a case is presented of foundries. For the considered contour an actual active energy balance is established so that input energy is the energy absorbed from electric network, energy that can be measured, and the useful energy is represented by mechanical energy developed at the end of the kinematic chain, determined by the expression (11).
On base the results obtained of energetic power balance, proposed to improve power factor
Power factor is defined as the ratio of active power P and apparent power S of the system (fig. 3). In the sine curve system, we can define the cosine angle between voltage and current (fig. 2). Line current of AC machine contains two components: magnetism current (produces the magnetic flux which occur in the machine, but creates a reactive power Q) and the power producing current (which is a current interacting with the magnetic flux to produce the torque of the machine).
The torque of the machine: C=KC*Φ*IP
Where:
Kc is the constant torque
Φ is the flow of magnetism between the iron Ip is the current which produces the torque, the power
For an electrical installation of an established apparent electrical power, the maximum of active power, i.e. efficiency maximum, is obtained at a power factor as high as it can (closer to unity) , a de–phased between voltage and current as low as possible, so to a reactive power consumption of distribution network as low as possible618. From the relationship cos j=P/S appears that the problem of improving the power factor is actually the problem of reducing reactive power absorbed by the consumer of a network.
A low power factor has a number of negative consequences for the functioning of electrical installation, including: – increasing active power loses; – extra investments ; – increasing voltage loses in the network; – reducing energy capacity installations.
Power factor improvement is achieved through:
– technical and organizational methods (natural methods/ways) that consist in the application of measures for streaming the operation, with reduced costs and without being equipped with additional facilities;
– methods of compensation of reactive power by using specialized sources of reactive power.
The most popular method to improve the power factor to a system of distribution with low voltage is to use the power condensers.
The condensers for improving the power factor are available in a wide range of rated reactive powers. The reactive power Qc which has to be installed to raise the power factor from a value cos
j
1to a value cosj
2 is based on the active power absorbed by the consumer619.Qc=P(tg
j
1– tgj
2)The studied consumer that absorbs an active power P=1000kW at a natural power factor cos
j
1=0,6. Apparent power is S1=P/cosj
1=1000/0,6=1667 kVA and current I1=P/Ö
3×
U×
cosj
1=1000×103/Ö3×380×0,6=2532 A. Thereactive power Qc needed to improve the power factor to a neutral value cos
j
2=0,92 is QC=1000(1,333–0,426)=907 kVAr. Increasing the power factor to a value cos
j
2=0,92 leads to an apparent power S2=P/cosj
2 =1000/0,92=1087kVA and a current I2=P/ Ö3 ×U ×cos j2=1000×103/Ö3×380×0,92=1651 A, both values well below
the previous ones. A battery of condensers is chosen Qbc = 920 kVAr. The improved power factor becomes cos j=1000/Ö10002+(1000×1,333–920)2=0,924
Following the improvement of power factor from cos j1=0,6 to cos j2=0,92
– reduce the apparent power with (1667–1087)/1667=0,348 → 34,8% – reduce loss of power with 1–(1651/2532)2=0,575 → 57,5%
Is an analysis technical–economic analysis of reactive power compensation. The economic efficiency of reactive power compensation is pointed out by the method of updated total expenditures. Choosing the best method and development in time of the facilities to compensate the reactive power in the consumer ‘s installations is made by comparing the total updated expenditures for each variant (natural ways/solutions, specialized sources, solutions for placements), analyzing the situation without compensation (corresponding to the natural power factor), and compensation solutions at different levels of the power factor.
Example of calculating the costs
Three things are taken into account in the payment bill: 1. The cost of consumed energy Cec = 0,38 lei/ KWh 2. The cost of the total required power Cpc = 41,8 lei / KW 3. The additional costs due to the power factor below 85%
The paid penalties depend on the minimum power factor ηm , the actual power factor η, and the total required power Ptc620.
Csfp = (ηm – η) Ptc* Cpc/ η
The factory used in a month 240000KWh x 0,38 = 91200 lei The demand of total power was 1700kW x 41,8 = 71060 lei
The paid penalties for a low power factor (70%) 15 x 1700 x 41,8/70 = 15227 lei
For processing experimental data and implementing mathematical relations presented above, we have developed a computer application which purpose is to calculate the necessary elements of the energetic balance according to the electric drive; based on the results, the application displays the corresponding graphs.
The application was made in the Access program. Input data, consisting of the catalog characteristics of engine and experimental determinations are stored in tables, and the results are presented in table reports and diagrams621 (fig. 5).
619 Ferrandis F., Amantegui J., Pazos F. J., Power factor correction within industrial sites: experiences regarding, CIRED Barcelona 2003. 620 Cziker A., Chindris M. – Managementul energiei electrice, Casa Cărţii de ştiinţă, Cluj–Napoca, 2004.
Fig. 5 Update interface
Conclusions
The concept of sustainable development of energy sector has become lately a main concern of our country specialists. As a result, actions have been initiated in order to align to European legislation in the field and also practical activities to implement the energy management principles both in industry and tertiary622.
In industry, the most widely spread electric receptors are the asynchronous motors, so that energy consumption in electrical systems they are integrated in should be carefully monitorized. The implementation of energetic efficiency improving measures mandatory requires an energy audit, which to highlight the real status of consumption way.
In this circumstance, the electricity balance is being developed chiefly to obtain necessary information to determine quantitatively the various components that characterize in terms of energy the operation regimes of electrical installations. Based on these experimental data and on their processing, solutions are established and measures that can be taken for a more efficient use of electricity.
The study presents a computer application that allows to determine components of balance of energy for electric drive systems with asynchronous motors with rotor in short circuit.
The results provided both in table and in diagrams, allow to analyze the actual consumption way and to determine measures to improve energy efficiency in order to reduce consumption.
References
1. Carabogdan I. Gh. S.a. – Bilanturi energetice. Probleme şi aplicaţii pentru ingineri. Editura Tehnică, Bucureşti, 1986.
2. Cziker A., Chindris M. – Managementul energiei electrice, Casa Cărţii de ştiinţă, Cluj–Napoca, 2004.
3. Cziker A., Chindris M. – Analiza pierderilor reale de putere in reţelele electrice de joasă tensiune. Energetica, nr.4, aprilie 2006, pag. 143–148.
4. Ferrandis F., Amantegui J., Pazos F. J., Power factor correction within industrial sites: experiences regarding, CIRED Barcelona 2003, R2_35.
5. Rotaru S., Ghiţă M. – Programarea în Access, Editura Universitaria, Craiova, 2005.
6. Zobaa A. F., Comparing Power Factor and Displacement Power Factor Corrections Based on IEEE Std. 18– 2002, ICHQP 2004.
7. ***– ARCE.ICEMENERG. Ghid de elaborare şi analiză a bilanţurilor energetice, Bucureşti 2003.