Analysis of Lattice Size, Energy Density and Denaturation
for a One-Dimensional DNA Model
Gabriel Gouvea Slade, Natalia Favaro Ribeiro, Elso Drigo Filho, Jose Roberto Ruggiero Department of Physics, Sao Paulo State University, São Josédo Rio Preto, Brazil
Email: [email protected]
Received January 21,2012; revised February 30, 2012; accepted March 7, 2012
ABSTRACT
There are several mechanical models to describe the DNA phenomenology. In this work the DNA denaturation is stu- died under thermodynamical and dynamical point of view using the well known Peyrard-Bishop model. The thermody-namics analysis using the transfer integral operator method is briefly reviewed. In particular, the lattice size is discussed and a conjecture about the minimum energy to denaturation is proposed. In terms of the dynamical aspects of the model, the equations of motion for the system are integrated and the results determine the energy density where the denatura- tion occurs. The behavior of the lattice near the phase transition is analyzed. The relation between the thermodynamical and dynamical results is discussed.
Keywords: DNA Mechanical Model; Peyrard-Bishop Model; Lattice Size; Thermal Denaturation
1. Introduction
The DNA molecule contains the genetic information and it is responsible for the transmission of hereditariness [1]. Since the discovery of its double helix structure done by Watson and Crick [2], researchers of several areas of science concentrated their attention to understand stru- ctural and functional aspects of this complex molecule. In the transcription and replication phenomena of DNA the ribbons separation in the double helix is an important effect, because it is necessary to expose the nitrogen bases to the solution. This means that large amplitudes and highly located motions are necessary and the dyna- mic of the molecule should be nonlinear.
Several models have been proposed to describe the DNA [3]. One of these is the Peyrard-Bishop (PB) model, proposed at 1989 to study DNA denaturation using sta- tistical mechanics [4]. The original model consists of a pair of one dimensional lattice of harmonic oscillators; the adjacent oscillators of each lattice are bonded by a nonlinear Morse potential mimicking the hydrogen bond of the real molecule. The main feature of this model is to describe the separation of the double strand in terms of the average stretching of the base pairs.
The PB model and some variations [5-7] have been used to study the dynamics [8-10] and the thermodyna- mics [11-13] of DNA. From the dynamical point of view, there are studies about localized energy modes [14] that were identified as precursors of the denaturation and transcription process. These modes could also prescribe
the dynamic of DNA in room temperature, in which large amplitude and highly localized motions had been experi- mentally verified [15,16]. From the thermodynamical point of view, the original model describes quantitatively the expected results for the DNA denaturation tempe- rature. Recently, it has been discussed modifications in the original model in order to include a more abrupt phase transition [17].
In this work, we analyze the thermodynamical and dynamical aspects of the PB model and relate these two approaches. In the literature the study of nonlinear lat- tices is done for a different number of oscillators [8,18, 19]. Besides that, other works discuss the possibility of phase transition to finite lattices [20,21]. The main ob- jective of the paper is to suggest a criterion to fix the mi- nimum size of the lattice. In order to get this result, we use the transfer integral operator method [22] and calcu- late the error committed in the partition function of the system. Thermodynamic results also lead to conjecture a minimum energy per base pair for occurrence of the lattice phase transition. This threshold energy can also be verified from dynamical results. We propose that the phase transition can be dynamically observed by follow- ing the time evolution of the position of the oscillators for different energies.
2. The Peyrard-Bishop Model
the interaction between them is described by a nonlinear potential. The three-dimensional aspects of the helicoi- dally structure are not considered and only the motions perpendicular to the strands are analyzed [4]. The nu- cleotides positions are denoted by uj and vj, respec- tively, with . For simplicity, we assume that the chains are homogeneous, i.e., all masses and all elastics constants are equal.
1, 2, , j N
The Hamiltonian of the model for a homogeneous chain is expressed as:
2 2 2 1 1 2 2 1 2 2 exp 1 2 NPB j j
j j j
j j j j
m k
u u
H u v
k
v v D a u v
(1) The last term in Equation (1) correspond to the Morse potential used to describe the hydrogen bonds, the pa- rameters D and a are related, respectively, with the depth and width of the potential well, k is the elastic constant of the harmonic potential used to simulate the stacking in- teraction and m is the mass. The Hamiltonian (1) can be uncoupled by introducing new variables
2 j j j
u v
x
and
2 j j j
u v
y . The HPB Hamiltonian can be written as the sum of two terms, one of them depending only on x variable representing a chain of harmonic os-cillators and it is not important for our analysis here. On the other hand, the Hamiltonian dependent on y variable can be written as
2 2 1 1 2 2 2exp 2 1
N
j j
y j j
j
m k
y y
H y
D a y
(2)This Hamiltonian represents a chain of harmonic os-cillators with the additional on site Morse potential that carries the nonlinearity of the model.
3. Thermodynamical Analysis
The thermodynamic analysis of the system is described by the partition function Z expressed in terms of the variable representing the average stretching of the base pairs (yn), i.e.,
1
1
exp
d exp ,
N
n n
n
Z y H y
y H y y
n (3)where N is the number of base pairs in the chain, 1
B k T
, kB is the Boltzmann constant, T is the tem-
perature and H y
n,yn1
is the uncoupled Hamiltonianof the model, given by Equation (2).
The transfer integral operator method [22] is used to determine the thermodynamical properties from the par- tition function. This method allows relating the partition function with eigenfunctions n and eigenvalues n given by the following pseudo-Schrödinger equation:
2 2 2 1 d 2 d1 2π ln 2
i n i i
n n
V y y
k y y k
i
(4)
where V y
i is the Morse potential. From the solutions of Equation (4), the partition function can be obtained by the sum exp
n
n
Z
N . However, in the thermo- dynamical limit in which the number of particles is very large ( ), the partition function is dominated by the ground state. For this reason, the analysis of the problem is usually limited to determine the energy eigen- function and eigenvalue for the ground state.N
The characterization of the phase transition for DNA molecule is done following the dependence of an order parameter with the temperature of the system. Usually, the order parameter is the average stretching of base pairs (<y>) [4,11].
The eigenfunctions that are solution of the pseudo- Schrödinger Equation (4) can be characterized as a pro- bability density. In this way, the average stretching of the base pairs can be obtained from the equality:
2 2 d d y y y y
(5)There are several methods that can be used to deter- mine the solutions of Equation (4), for example, the La- place transforms [23] and by using the factorization me- thod [24]. Then, the eigenenergy and eigenfunction for the ground state of Morse potential are known (see, for example, references [4,11]):
1/ 2
1/ 2
2
0 1/ 2
2
2 exp
2 1 1
exp 2 ,
2 d ay M d a d d d ay e (6) and
1/ 2 2
0 2
1 ln
2 2π 4
M
k a D a
k k
where the condition
1/ 2 1 2d kD
a
must be ob- served in order to exist bond states.
From the ground state eigenfunction given by (6), the average stretching of base pairs can be found by using Equation (5). To this end it is necessary to fix the pa- rameters which characterize the model. Following the reference [25], the better parameters for Morse potential to adjust to DNA are D = 0.03 eV and a = 2.81 Å–1 and the elastic constant to the harmonic potential is k = 0.06 eV·Å–2. Using these parameters, the behavior of <y> with temperature has an increase in the average stretching of the base pairs, indicating the thermal denaturation of the DNA molecule in the temperature range from 300 to 350 K.
Other approach to determine the melting temperature can be made by noting that the eigenfunction obtained from Equation (4) must be quadratically integrable. Then, it is possible to determine from the eigenfunction (6) a critical temperature of the phase transition ( C). The eigenfunction (6) is quadratically integrable only if d is higher than 0.5. For d lower or equal 0.5 the system does not have a discrete bond states and the square of the wave function integrated in all space diverges. Then, the critical temperature is obtained from and it is given by
T
0.5
C
T d
2 C
B kD T
ak
(8)
Substituting the parameters D, a, k and the Boltzmann constant, kB 8.617 105
eV K
, in Equation (8) the value of the critical temperature is, approximately, 350 K. The reference [1] indicates that the denaturation tempe- rature of the DNA molecule varies in the range 318 to 372 K, depending on the nucleotides composition of the chain. In this way, the obtained critical temperature is consistent with experimental results.
The thermodynamical treatment of the Peyrard-Bishop model to DNA was realized assuming a very large num- ber of oscillators in the chain. In this limit, the excited states to the Morse potential were disregard. If the num- ber of oscillators is not large, it is necessary to estimate the numerical error in this approach. The partition func- tion (3), written in terms of the eigenvalues of Equation (4), can be rearranged in the following form:
0 1
0 1 0
exp
exp exp
exp 1 exp
n
Z N
N N
N N
(9)
Then, the first order error in the partition function is
1 0
exp N . It is important to note that the se- ries (9) must be convergent otherwise the thermodynamic
limit could not be valid to none value of the particles number N. So the higher terms in (9) are always lower than the first one. In order to estimate the value of N, we should know the difference between the energy eigen- values 1 and 0. This estimative can be done re- membering that the Morse potential permits bond states to the values of 0,1, 2, , 1
2 n d
, with
1/ 2
d k
a
D . Using the parameters given above and the temperature equal to 300 K, the value obtained to
1 2 d
is approximately 0.08. This means that there is
only one bond state inside the potential well at this tem- perature, the ground state. Increasing the temperature above 350 K even the ground state will be out of the po- tential well. On the other hand, a discrete first excited state appears only for temperature lower than 150 K.
Thus, for the temperature range of interest, the first excited state is in the continuum part of the spectrum. In this case, the difference between the ground state and the first energy level of the continuum spectrum can be esti- mated as the value of the depth of the well, D, minus the value of the ground state energy, 0, i.e.,
1 0 D 0
N
. Consequently, the error by disre- garding the first state above the ground state is
exp( ). From the used parameters and consider- ing the size of the chain equal to 21 oscillators, the error in the partition function by disregarding the second term in the expansion (9) at 300 K is lower than 10–5. This result indicates that a chain with 21 oscillators can be considered as being sufficiently large to disregard the states above the ground state. This procedure can be ado- pted to control the error in terms of the lattice size. It is important to observe that for the system close the de- naturation temperature, the eigenvalue 0 is close the top of the potential well, i.e., becomes minor. Then, the continuum levels of the spectrum become more and more important to the description of the system.
Considering the above arguments, the characterization of the phase transition of the DNA molecule by the thermodynamical formalism can be done admitting that all the base pairs have sufficient energy to break the Morse potential, i.e., when the oscillators have energy above the potential well. In this way, when the energy of each base pair is equal to or higher than D, the wave function is no more quadratically integrable and the phase transition occurs. An alternative way to analyze this relation between the melting process and the energy of each base pair is to note that the energy density of the lattice can be related with the melting temperature by the relation B
E
is 350 K, we can predict that the energy density neces- sary to denaturation is E 0.03 eV oscillator
N . One
observes that this value is the same that was used to the depth of the potential well D which reinforce the previ- ous arguments. Summarizing, from this analysis, the de- naturation occurs when the energy per oscillator is at least equal to the depth of the Morse potential well.
4. Dynamical Study of the Model
In this section the dynamical results for the Peyrard- Bishop model are discussed. The numerical calculation can be simplified if we introduce dimensionless variables:
2 j a yj
and
1
2 2
2 Da t m
. The Hamiltonian (2)
can be rewritten as a function of a single parameter:
2 2 2
1 1
1 1 1
exp 1
2 2 2
N
j
j j j
j
H
C (10) where d
d
,
2 4
k C
Da
and Hy 2DH . So the equations of motion are given by:
1 1 2
exp
2
exp
j C j j j j j
(11) We integrate the equations of motion using the tenth order Runge-Kutta Nystrom method [26]. The initial condition is such that only the central oscillator of the chain is excited and all its energy is kinetic. Then, at time
all oscillators are in their equilibrium position and at rest with the exception of the central oscillator that has an initial velocity. The periodic boundary conditions is used, i.e., 0
0 t
N
and N11. Following the previ- ous discussion (Section 3), the number of oscillators used to perform the simulation is 21.
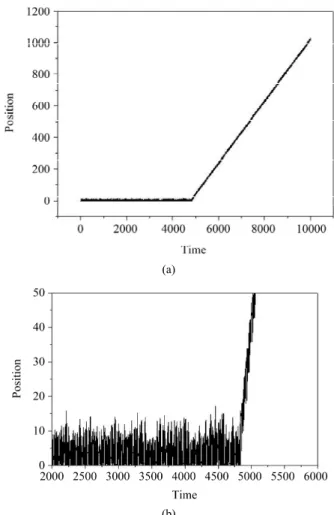
In Section 3, we conjecture that the denaturation hap- pens if each oscillator shares an energy corresponding to the depth of the Morse potential well, D. By using the dimensionless variables, as writing in (10), this depth is tracked back to the value 0.5. In order to characterize the denaturation, we follow the position value (y) of each oscillator and its Morse potential energy as a function of the time. We consider that the chain reaches the denatu- ration when all the oscillators get the Morse potential equal to or larger than 0.5. In this case all the hydrogen bonds should be broken and the double strand should be separated. Figure 1 shows the position y of all the oscil- lators superposed as a function of the time. In this simu- lation it is used and the energy density is 0.7857. Thus, in Figure 1 there are 21 curves superposed, there is one curve for each site of the lattice. When all the oscillators acquire energy of the Morse potential equiva-
21 N
(a)
(b)
Figure 1. (a) Position of each of the oscillators superposed as a function of the time; (b) A zoon in the region where the
onsite potential is broken down. N = 21 and E 0.7857
N .
lent to the depth of the well, the positions of all oscilla- tors begin to rise constantly, so the chain starts a uniform translation motion. Once y represents the separation of a base pair, this behavior characterizes qualitatively the broken of the hydrogen bonds and consequently the DNA denaturation.
Figure 2. Hydrogen bond of each oscillator in function of the time. Black color represents the formed bonds, while white color represents the broken bond. N = 21 and
0.881 E
N .
represented by black color and the broken hydrogen bond is indicated by the white color.
Finally we analyze the energy density in the model. Then we simulate different energy densities and verify the necessary time to denaturation. This result is pre- sented in Figure 3. We note that small values of the en- ergy density correspond to high values of time to obtain the denaturation. The results suggest also that an asymp- totic behavior could be achieved for energy density near 0.5, which is the well depth, in accordance with the thermodynamic results. Others initial conditions were tested and the results are qualitatively in agreement with these.
5. Conclusions
In this work we studied the thermodynamic and dynamic properties of the one dimensional model to study the DNA macromolecule. The thermodynamical analysis inferred that a chain of 21 oscillators should be sufficient large to analyze the behavior of the system for room temperatures (300 K), once that the error in the partition function is about 10–5 when despising the excited states of the Schrödinger-type Equation (4). It is important to observe that, if the system is near the denaturation temperature, the thermodynamic results indicate that it is necessary a large chain to describe its properties, otherwise the error in the partition function becomes significant.
It is suggested a dynamical approach to analyze the thermal denaturation by studying the stretching of the base pairs (y) for each oscillator on the lattice. This ana- lysis permits to observe that the formation of bubbles is
Figure 3. Energy density of the system as a function of the necessary time to occur denaturation. N = 21.
part of the melting process. The minimum energy density needed to the denaturation is related with the energy of the potential well, i.e., it is necessary that all oscillators of the chain get energy higher than the parameter D of the Morse potential to get the melting. The dynamical calculations of the model, in a lattice of 21 oscillators, show that the denaturation occurs when the energy densi- ties tends to the value of D. However, for the obtained results the energy is always higher than that indicated from thermodynamics analysis. Two causes can be iden- tified to this behavior, first the energy in the dynamic si- mulation are not localized only in the Morse potential, part of it can be localized in the harmonic potentials. Other cause is related with the fact that the thermody- namics results indicate that near the denaturation tem- perature it is necessary a larger chain to describe the sys- tem. Nevertheless the behavior of the chain is in agree- ment with the DNA phenomenology and both formalisms converge to the same result.
6. Acknowledgements
The authors are grateful to Capes and CNPq for the fi- nancial support.
REFERENCES
[1] W. Saenger, “Principles of Nucleic Acid Structure,” Springer-Verlag Press, New York, 1984.
doi:10.1007/978-1-4612-5190-3
[2] G. B. Watson and F. H. Crick, “Molecular Structure of Nucleic Acids—A Structure for Deoxiribose Nucleic Acid,” Nature, Vol. 171, 1953, pp. 737-738.
doi:10.1038/171737a0
[3] L. Yakushevich, “Nonlinear Physics of DNA,” Wiley Series in Nonlinear Science, Chichester, 1998.
doi:10.1103/PhysRevLett.62.2755
[5] T. Dauxois, M. Peyrard and A. R. Bishop, “Entropy- Driven DNA Denaturation,” Physical Review E , Vol. 47, No. 1, 1993, pp. 44-47. doi:10.1103/PhysRevE.47.R44
[6] M. Joyeux and S. Buyukdagli, “Dynamical Model Based on Finite Stacking Enthalpies for Homogeneous and In-homogeneous DNA Thermal Denaturation,” Physical Re-view E, Vol. 72, No. 5, 2005, Article ID: 051902. doi:10.1103/PhysRevE.72.051902
[7] M. Peyrard, S. Cuesta-López and G. James, “Nonlinear Analysis of the Dynamics of the DNA Breathing,” Jour-nal of Biological Physics, Vol. 35, No. 1, 2009, pp. 73-89. doi:10.1007/s10867-009-9127-2
[8] E. Zamora-Sillero, A. V. Shapovalov and F. J. Esteban, “Formation, Control, and Dynamics of N Localized Structures in the Peyrard-Bishop Model,” Physical Re-view E, Vol. 76, No. 6, 2007, Article ID: 066603. doi:10.1103/PhysRevE.76.066603
[9] S. Zdravkovic and M. V. Sataric, “DNA Dynamics and Big Viscosity,” International Journal of Modern Physics B, Vol. 17, No. 31-32, 2003, pp. 5911-5923.
doi:10.1142/S0217979203023513
[10] J. De Luca, E. Drigo Filho, A. Ponno and J. R. Ruggiero, “Energy Localization in the Peyrard-Bishop DNA Mo- del,” Physical Review E, Vol. 70, No. 2, 2004, Article ID: 026213. doi:10.1103/PhysRevE.70.026213
[11] M. Peyrard, “Nonlinear Dynamics and Statistical Physics of DNA,” Nonlinearity, Vol. 17, No. 2, 2004, pp. 1-40. doi:10.1088/0951-7715/17/2/R01
[12] G. Weber, “Sharpe DNA Denaturation Do to Solvent Interaction,” Europhysics Letters, Vol. 73, No. 5, 2006, p. 806. doi:10.1209/epl/i2005-10466-6
[13] N. F. Ribeiro and E. Drigo Filho, “Using a One-Dimen- Sional Lattice Applied to the Thermodynamic Study of DNA,” Journal of Physics: Conference Series, Vol. 246, 2010, Article ID: 012037.
doi:10.1088/1742-6596/246/1/012037
[14] G. G. Slade, E. Drigo Filho and J. R. Ruggiero, “Stability of Breathres in Simple Mechanical Models for DNA,” Journal of Physics: Conference Series, Vol. 246, 2010, Article ID: 012039.
doi:10.1088/1742-6596/246/1/012039
[15] S. W. Englander, N. R. Kallenbach, A. J. Heeger, J. A. Krumhansl and A. Litwin, “Nature of the Open State in Long Polynucleotide Double Helix—Possibility of Soli-ton Excitations,” Proceedings of the National Academy of Sciences, Vol. 77, No. 12, 1980, pp. 7222-7226. doi:10.1073/pnas.77.12.7222
[16] J. L. Leroy, M. Kochoyan, T. Huynh-Dinh and M.
Guéron, “Characterization of Base-Pair Opening in the Deoxynucleotide Duplexes Using Catalyzed Exchange of the Imino Proton,” Journal of Molecular Biology, Vol. 200, No. 2, 1988, pp. 223-238.
doi:10.1016/0022-2836(88)90236-7
[17] M. Peyrard, S. Cuesta-López and D. Angelov, “Experi-mental and Theoretical Studies of Sequence Effects on the Fluctuation and Melting of Short DNA Molecules,” Journal of Physics: Condesed Matter, Vol. 21, No. 3, 2009, Article ID: 034103.
doi:10.1088/0953-8984/21/3/034103
[18] J. M. Silva, E. Drigo Filho and J. R. Ruggiero, “Localiza-tion and Delocaliza“Localiza-tion of Energy in a Peyrard-Bishop Chain,” The European Physical Journal E: Soft Matter and Biological Physics, Vol. 29, No. 2, 2009, pp. 245-251. doi:10.1140/epje/i2009-10475-9
[19] B. S. Alexandrov, L. T. Wille, K. Ø. Rasmussen, A. R. Bishop and K. B. Blagoev, “Bubble Statistics and Dy- namics in Double-Stranded DNA,” Physical Review E, Vol. 74, No. 5, 2006, Article ID: 050901.
doi:10.1103/PhysRevE.74.050901
[20] N. Theodorakopoulos, “Thermodynamic Instabilities in One-Dimensional Particle Lattices: A Finite-Size Scaling Approach,” Physical Review E, Vol. 68, No. 2, 2003, Ar-ticle ID: 026109. doi:10.1103/PhysRevE.68.026109
[21] S. Buyukdagli and M. Joyeux, “Theoretical Investigation of Finite Size Effects at DNA Melting,” Physical Review E, Vol. 76, No. 2, 2007, Article ID: 021917.
doi:10.1103/PhysRevE.76.021917
[22] D. J. Scalapino and M. Sears, “Statistical Mechanics of One-Dimensional Ginzburg-Landau Fields,” Physical Re- view B, Vol. 6, No. 9, 1972, pp. 3409-3416.
doi:10.1103/PhysRevB.6.3409
[23] G. Chen, “The Exact Solutions of the Schrodinger Equa-tion with the Morse Potential via Laplace Transforms,” Physical Review A, Vol. 326, No. 1-2, 2004, pp. 55-57. doi:10.1016/j.physleta.2004.04.029
[24] E. D. Filho and R. M. Ricotta, “Morse Potential Energy Spectra through the Variational Method and Supersym- metry,” Physics Letters A, Vol. 269, No. 5-6, 2000, pp. 269-276. doi:10.1016/S0375-9601(00)00267-X
[25] R. A. S. Silva, E. D. Filho and J. R. Ruggiero, “A Model Coupling Vibrational and Rotational Motion for DNA Molecule,” Journal of Biological Physics, Vol. 34, No. 5, 2008, pp. 511-519. doi:10.1007/s10867-008-9111-2
[26] C. Tsitouras, “A Tenth Order Sympletic Runge-Kutta- Nystrom Method,” Celestial Mechanics and Dynamical Astronomy, Vol. 74, No. 4, 1999, pp. 223-230.