Global slowing of network oscillations in mouse neocortex by diazepam
Claudia Scheffzük
a
, Valeriy I. Kukushka
b
, Alexei L. Vyssotski
c
, Andreas Draguhn
a
, Adriano B.L. Tort
d
,1
,
Jurij Branka
ck
a
,*
,1
aInstitute for Physiology and Pathophysiology, University Heidelberg, Im Neuenheimer Feld 326, 69120 Heidelberg, Germany bDniepropetrovsk National University, Dniepropetrovsk, Ukraine
c
Institute of Neuroinformatics, University of Zürich/ETH, Zürich, Switzerland
dBrain Institute, Federal University of Rio Grande do Norte, Natal, Rio Grande do Norte, Brazil
a r t i c l e
i n f o
Article history: Received 1 July 2012 Received in revised form 23 August 2012
Accepted 16 September 2012
Keywords:
In vivo electrophysiology
Localfield potential
Neuronal oscillations Brain rhythms Sleep-wake cycle Cross-frequency coupling
a b s t r a c t
Benzodiazepines have a broad spectrum of clinical applications including sedation, anti-anxiety, and anticonvulsive therapy. At the cellular level, benzodiazepines are allosteric modulators of GABAA receptors; they increase the efficacy of inhibition in neuronal networks by prolonging the duration of inhibitory postsynaptic potentials. This mechanism of action predicts that benzodiazepines reduce the frequency of inhibition-driven network oscillations, consistent with observations from human and animal EEG. However, most of existing data are restricted to frequency bands beloww30 Hz. Recent data suggest that faster cortical network rhythms are critically involved in several behavioral and cognitive tasks. We therefore analyzed diazepam effects on a large range of cortical network oscillations in freely moving mice, including theta (4e12 Hz), gamma (40e100 Hz) and fast gamma (120e160 Hz) oscillations. We also investigated diazepam effects over the coupling between theta phase and the amplitude fast oscillations. We report that diazepam causes a global slowing of oscillatory activity in all frequency domains. Oscillation power was changed differently for each frequency domain, with characteristic differences between active wakefulness, slow-wave sleep and REM sleep. Cross-frequency coupling strength, in contrast, was mostly unaffected by diazepam. Such state- and frequency-dependent actions of benzodiazepines on cortical network oscillations may be relevant for their specific cognitive effects. They also underline the strong interaction between local network oscillations and global brain states.
Ó2012 Elsevier Ltd. All rights reserved.
1. Introduction
Benzodiazepines, like diazepam (DZ), are positive allosteric
modulators of the GABA
Areceptor that act by potentiating the
agonistic potency of the natural ligand GABA (for a recent review, see
Tan et al., 2011). At the cellular and synaptic level, benzodiazepines
can enhance the amplitude of inhibitory postsynaptic events,
prolong their duration and increase tonic inhibition. At the network
level this results in reduced excitability and in characteristic
alter-ations of rhythmic activity patterns. Increased cycle length of
inhibition-driven activity reduces the frequency of network
oscillations, while increased inhibition ef
fi
cacy enhances coherence
of the multi-neuronal rhythmic activity (Whittington et al., 1996). In
line with this, DZ decreases the frequency of hippocampal theta
oscillations during REM sleep (Monmaur,1981), walking (Caudarella
et al., 1987) and during active exploratory behavior (Van Lier et al.,
2004).
However, mammals express a large variety of different
region-and state-dependent network patterns, most of which involve an
important role of inhibition (Whittington and Traub, 2003;
Mann
and Paulsen, 2007). These patterns cover a wide spectrum of
frequencies and support different behavioral and cognitive functions
(Buzsáki, 2006). Therefore, multiple frequency domains have to be
analyzed to assess the effects of benzodiazepines at the network
level and relate them to their behavioral or cognitive actions.
Moreover, different oscillations can occur simultaneously and can
be systematically coupled. For example, multiple fast oscillations
co-exist in hippocampal CA1 of freely moving rats, with a layer-speci
fi
c
coupling to theta phase (Scheffer-Teixeira et al., 2012;
Belluscio et al.,
2012). Interactions between different rhythms are related to
task-speci
fi
c cognitive performance both in humans (Axmacher et al.,
Abbreviations:ANOVA, analysis of variance; aWk, active waking state; CFC,cross-frequency coupling; DZ, diazepam; PSD, power spectral density; EEG, elec-troencephalogram; GABA, gamma-aminobutyric acid; MI, modulation index; NREM, non REM sleep; phREM, phasic REM sleep; qWk, quite waking; REM, rapid eye movement sleep; toREM, tonic REM sleep.
*Corresponding author. Tel.:þ49 (0)6221 544053; fax:þ49 (0)6221 546364.
E-mail address:[email protected](J. Brankack).
1 Both authors contributed equally to the present study.
Contents lists available at
SciVerse ScienceDirect
Neuropharmacology
j o u r n a l h o m e p a g e : w w w . e l s e v i e r . c o m / l o c a t e / n e u r o p h a r m
0028-3908/$esee front matterÓ2012 Elsevier Ltd. All rights reserved.
2010;
Canolty and Knight, 2010;
Fell and Axmacher, 2011) and
animals (Tort et al., 2008,
2009). Moreover, cross-frequency coupling
(CFC) also varies with vigilance state across the sleep-wake cycle
(Scheffzük et al., 2011;
Branka
ck et al., 2012). Similar to single
oscillation frequencies, synaptic inhibition is also critical for certain
forms of CFC (Wulff et al., 2009). Together, these
fi
ndings suggest that
altering GABAergic inhibition could change the characteristics of
neuronal oscillations and their coupling.
Here we investigated the effects of DZ on the EEG of freely
behaving mice during different vigilance states. Power spectra were
analyzed for three frequency domains: theta (4
e
12 Hz), gamma
(40
e
100 Hz) and fast gamma (120
e
160 Hz) oscillations. In
addi-tion, coupling between theta and fast oscillation patterns was
analyzed before and after DZ administration. We found that DZ
induces a global slowing of EEG oscillations in all frequency
domains independent of behavioral state whereas power changes
induced by DZ depend on the behavioral state and differ between
frequency domains: theta power decreased only in active waking,
gamma power increased in active waking but decreased during
REM sleep, whereas fast gamma power decreased in all behavioral
states. Despite of the power changes and the shift in frequency, DZ
left the strength of interactions between simultaneous oscillations
(CFC) largely intact. Our data therefore show a general slowing of
cortical network oscillations by benzodiazepines, which occurs
with altered power content and preserved CFC.
2. Methods and materials
2.1. Ethics statement
This study was carried out in accordance with guidelines of the European Science Foundation (Use of Animals in Research, 2001), the U.S. National Institutes of Health Guide for the Care and Use of Laboratory Animals (Guide for the Care and Use of Laboratory Animals, 1996) and has been approved by the Governmental Super-visory Panel on Animal Experiments of Baden Württemberg at Karlsruhe (35-9185.81/G-30/08). All efforts were made to minimize animal suffering and to reduce the number of animals used. Due to the behavioral aspect of the study, alternatives to in vivo techniques were not available.
2.2. Animal care and housing conditions
Male C57BL/6N mice were purchased at 28 or 45 days of age from Charles River (Sulzfeld, Germany). For a minimum of two weeks they were housed in groups of
four tofive inside a ventilated Scantainer (Scanbur BK A/S Denmark) on an inverted
12/12-h light/dark cycle with light on between 8:00 p.m. and 8:00 a.m. Animals had free access to water and food. After electrode implantation, mice were housed individually throughout the experiment.
2.3. Animal preparation
Ten male C57BL/6N mice were anesthetized with isoflurane in medical oxygen
(4% isoflurane for induction, 1.5e2.5% for maintenance,flow rate: 1 l per min).
Anesthetized animals were placed in a stereotactic apparatus with a custom-made inhalation tube. For analgesia, 0.1 mg/kg of buprenorphin was injected subcutane-ously prior to and 8 h after surgery. After exposure of the skull bone, two stainless
steel watch screws were permanentlyfixed in the skull. One screw was used for EEG
recording and placed over the left lateral parietal association cortex (2 mm posterior of bregma, 1.5 mm lateral to the midline). In mice this neocortical region covers the dorsal hippocampus permitting reliable recording of the theta rhythm with comparable amplitudes among different animals. A second screw over the cere-bellum served as ground and reference electrode. The impedance of the epidural
screw electrodes was 7.1 kOhm at 100 Hz (range: 6.8e7.6) and 3.0 kOhm at 1 kHz
(range: 3.0e3.1). Two pairs of varnish-insulated nichrome wires (100mm, glued
together) cut at an angle of 45were implanted into the right hippocampal CA1 area
and a single nichrome wire into the ventral hippocampus for a different set of experiments. Due to the limited number of recording channels, we omitted parallel recording of EMG. For staging of vigilance state we used data from three-dimensional accelerometry (see below).
2.4. Electrophysiology and recording of behavior
One week after surgery, experiments began with a 2-h session in a Phenotyper home cage (Noldus Information Technology, Wageningen, Netherlands) measuring
30 cm30 cm with free access to food and water. EEG recordings were performed
with a miniaturized data logger (Neurologger 2A), an advanced version of the
device previously described (Vyssotski et al., 2006, 2009) with the reference
connected to ground. The input impedance of all recording channels including reference was larger than 30 MOhm. Four channels of EEG signals were
bandpass-filtered (1e700 Hz, 3 dB, attenuation 6 dB/octave) and digitized by an on-board
A/D-converter (6400 Hz per channel) after amplification at1000 (input range of
1 mV). Samples were stored in the on-board 512 MB memory at a rate of 1600 Hz.
The dimensions of the neurologger were 231513 mm and the total weight
was 3.6 g with two batteries (Renata ZA 10; Itingen, Switzerland). This weight includes the neurologger itself (1.4 g), the add-on accelerometer/infrared synchronization board (0.4 g), batteries (0.6 g), battery holders as well as protective casing. The head implant (electrodes, wires, contacts and dental acrylic) had an additional weight of 0.7 g. Special care was taken to habituate the mice to the recording chamber and weight of data logger. The movement of the mice was not
visibly altered (for details, seeBrankack et al., 2010). Prior to thefirst full-length
recording of 10 h, all animals went through 3 habituation sessions. These were performed during the light period and contained epochs of data logger recordings
with increasing duration from 2e3 h to 4 h in the third night. After each trial, the
phenotyper cage was carefully wiped with 70% EtOH to remove all odor traces of previous animals, the cage bedding was removed and stored in a clean box so that it could be used again for the same subject. At the end of the experiment, data was downloaded onto a personal computer for further analysis. Animal behavior was continuously recorded by the video tracking system Ethovision XT 7.1 (Noldus Information Technology, Wageningen, Netherlands).
2.5. Drug preparation
Diazepam (SigmaeAldrich) was prepared in a 10% (2-Hydroxypropyl)-b
-cyclo-dextrin solution (SigmaeAldrich). The same solvent was used as vehicle in control
experiments. Diazepam was injected intraperitoneally in doses of 1, 2, or 4 mg/kg (Straub et al., 2010) in a random order with inter-injection intervals of at least 48 h. The injected volume was 10 ml/kg. Each injection was followed by data acquisition for a period of 10 h, starting 30 min after injection of drug or vehicle.
2.6. Data analysis
Continuous EEG recordings of 10 h duration from the circadian quiet phase (from 9:00 p.m. to 7:00 a.m.) of ten male animals were used for analysis. Data was imported into a MATLAB-based program (The Mathworks Inc., Natick, MA) using
both built-in- and custom-written routines. Visual classification of REM-sleep, non
REM-sleep (NREM), quiet waking (qWk) and active wakefulness (aWk) was based on: 1) three-dimensional accelerometer activity (aWk distinguished by prominent signals); 2) the amount of high amplitude-low frequency delta activity in the
neocortex (characteristic for NREM); 3) regular theta (4e12 Hz) oscillations
(indic-ative of REM or aWk). For a detailed description of behavioral staging, seeBrankack
et al. (2010). Waking states with movement were reliably and automatically detected by crossing a threshold in the summed integral of all three accelerometer dimensions. The remaining time corresponded to NREM sleep, drowsiness or immobile waking. Manual scoring in two animals revealed that less than 1% of the time spent in immobility consisted of qWk while most of the immobility corre-sponded to drowsiness and NREM sleep. For analyzing the sleep-wake cycle we therefore did not distinguish waking immobility as a separate state in the present study. REM sleep is heterogeneous and can be divided into tonic and phasic REM (Sakai et al., 1973), the latter characterized by brief periods of increased theta amplitude and frequency, ponto-geniculo-occipital spikes, muscle twitches, increased eye movements and vegetative arousal (Montgomery et al., 2008). Phasic REM was detected with a MATLAB program based on methods adapted from Mizuseki et al. (2011)and covered less than 3% of total REM duration (for detailed
analysis of phasic versus tonic REM, seeBrankack et al., 2012). In addition, latency
from vehicle or drug application to thefirst occurrence of NREM and REM sleep was
identified. Baseline data on aWk, tonic and phasic REM in the absence of diazepam
have been described elsewhere (Brankack et al., 2012).
Power spectral density (PSD) estimation was done by means of the Welch
periodogram method using the built-in MATLAB function‘‘pwelch’’from the Signal
Processing Toolbox. We employed 50% overlapping Hamming windows with
a length of 4 s. To estimate“peak frequency”in the gamma and fast gamma range we
first removed a 1/ffit from the PSD, and then smoothed the remaining PSD using
a 20-Hz moving average. For an illustration of this procedure seeSupplementary
Fig. 1. Band power was defined as the area under the curve of the corresponding frequency domain.
The stability of theta oscillations was estimated by the width of the peak
observed in the PSD (seeFig. 3B). Power values between 0 and 30 Hz werefitted by
a Gaussian curve. For this procedure, we only took into account values above
a minimal level chosen to provide the bestfit (usually 20 or 30% of peak theta power).
Theta peak width was then defined as the standard deviation of the Gaussianfit.
For general estimation of DZ effects on oscillation frequency, we calculated the
mean frequency in the 0e20 Hz and 20e160 Hz ranges, respectively (seeFig. 5).
frequencyFjby the area under the curve for the analyzed band. The mean frequency
is then obtained bySjFjPj.
To measure the intensity of phase-amplitude coupling, we used the modulation
index (MI) as described in detail inTort et al. (2010). The MI is capable of assessing
coupling between two frequency ranges of interest: a slower phase-modulating (fp)
and a faster amplitude-modulated (fa) frequency. The comodulation map is obtained
by expressing the MI of multiple frequency pairs in a pseudo color scale (for further
details, seeTort et al., 2008andTort et al., 2010).
2.7. Statistics
Data are expressed as means and standard error of the mean (S.E.M.). For group
comparisons of normally distributed data (KolmogoroveSmirnov test), we used
repeated measures ANOVA and as a post test Tukey’s Multiple Comparison Test. For
data with non-Gaussian distribution, we used the nonparametric Friedman test
and as a post test Dunn’s Multiple Comparison Test. Different significance levels
are shown infigures with one to three asterisks (*: p<0.05, **:p <0.005,
***:p<0.0005).
3. Results
Effects of diazepam (DZ) on vigilance and EEG activity were
analyzed by injecting single doses of the drug or vehicle,
respec-tively, in 10 freely behaving male mice. DZ was tested at 1, 2 and
4 mg/kg of body weight.
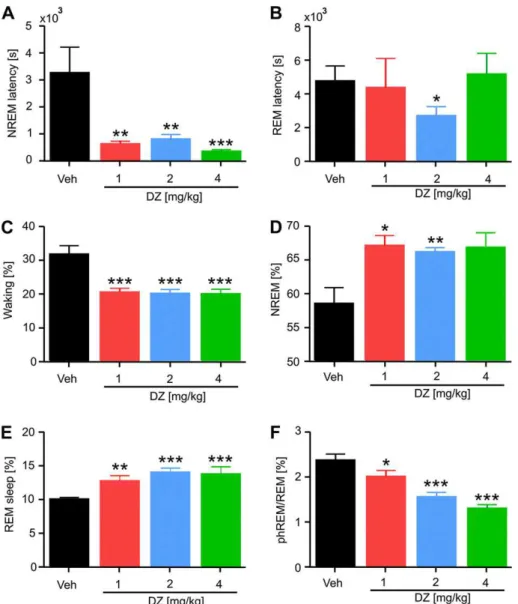
3.1. Diazepam effects on sleep-wake cycle
At all concentrations, DZ signi
fi
cantly shortened the latency to
the
fi
rst NREM episode (Fig. 1A). In contrast, REM sleep latency was
largely unaffected (Fig. 1B). Consistent with a sedating action of DZ,
all three doses strongly suppressed waking time (Fig. 1C) and
signi
fi
cantly prolonged NREM sleep (Fig. 1D). REM sleep was also
signi
fi
cantly prolonged by all three doses of DZ (Fig. 1E). In contrast
to total REM duration, the fraction of phasic REM (see
Methods)
was strongly suppressed by DZ from 2.4
0.1% to 1.3
0.1%
(Fig. 1F). Interestingly, most effects of DZ were not dose-dependent
(see
Fig. 1A
e
E), indicating that 1 mg/kg of body weight is already
a saturating dose for its effects on vigilance. However, this ceiling
effect was not apparent for the fraction of phasic REM within REM
sleep, which was linearly related to DZ dose (Fig. 1F).
3.2. EEG power spectra and cross-frequency coupling under
baseline conditions
Neocortical
fi
eld potentials (EEG) are strongly state-dependent.
In our recordings,
fi
ve different states were detected (see
Methods):
Fig. 1.Diazepam (DZ) changes the distribution of sleep-wake states. DZ decreased NREM latency at all doses (A), whereas REM latency (B) was mainly unaffected (except for
a decrease after 2 mg/kg DZ). DZ reduced the time spent in waking (C), while it increased NREM sleep (D) and REM sleep (E). Phasic REM (F) was suppressed by DZ. Means (N¼10)
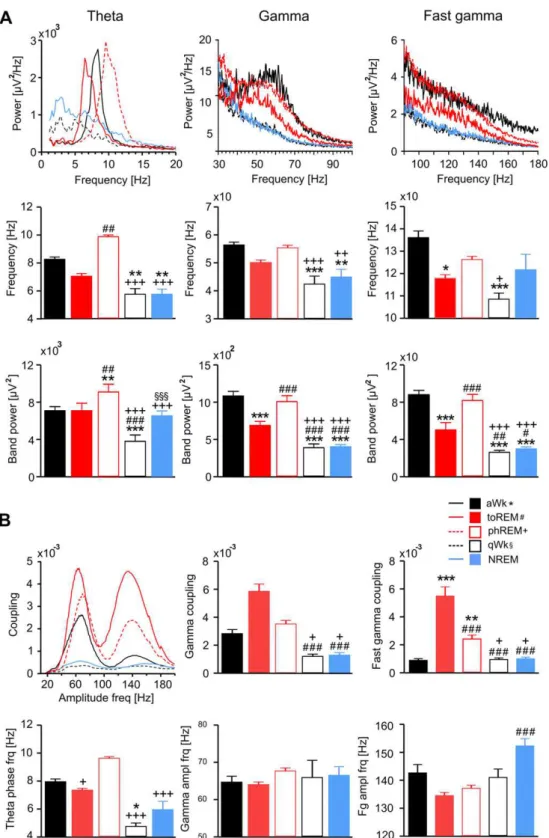
Fig. 2.Power spectral content (A) and theta phase coupling of fast oscillations (B) vary strongly across the sleep-wake cycle. Five different states are shown: active waking (aWk,
black solid lines and blackfilled bars), quiet waking (qWk, black dotted lines, black open bars), Non REM sleep (NREM, blue solid lines, bluefilled bars), tonic REM sleep (toREM, red
solid lines, redfilled bars) and phasic REM sleep (phREM, red dotted line, red open bars). (A) The upper row shows mean power spectra for theta, gamma and fast gamma frequency
ranges (N¼10). Notice prominent theta, gamma and partly fast gamma power peaks present only in the three“theta states”(aWk, toREM and phREM) but not in the two“
non-theta states”(qWk, NREM). The middle row depicts peak frequencies (meansS.E.M.). The lower row depicts band power values. The“theta states”differ significantly both in
frequency and power of theta, gamma and fast gamma from the“non-theta states”(*: significances in reference to aWk; #: in reference to toREM;þ: in reference to phREM;x: in
reference to qWk). (B)Upper left: Theta phase coupling strength for frequencies between 20 and 200 Hz.Upper middle and right panels: Theta-gamma coupling strength is
significantly larger during“theta states”compared to“non-theta states”. Theta-fast gamma coupling is significantly larger during REM sleep states compared to aWk, qWk and
NREM.Lower panels: peak frequency values for theta phase (left), gamma (middle) and fast gamma amplitudes (meansS.E.M.; symbols of significances as in A). Baseline data
active wakefulness (aWk), quiet wakefulness (qWk), Non REM
(NREM), tonic and phasic REM sleep. Power spectra were computed
from 30 s of activity per animal and behavioral state. Prominent
peaks in the theta range (4
e
12 Hz) were present during aWk and
both types of REM sleep, while qWk and NREM showed greater
power in the delta (1
e
4 Hz) range (Fig. 2A). Peak frequency of theta
power was 9.6 Hz in phasic REM, 8.4 Hz in aWk, and 6.4 Hz in tonic
REM. Similar to theta, oscillations in the gamma (40
e
100 Hz) and
fast gamma (120
e
160 Hz) ranges were largely restricted to aWk
and the two REM states, while spectra from NREM sleep and qWk
followed a 1/
f
distribution, with no prominent activity of fast
oscillations. Theta band power was larger during phasic REM as
compared to tonic REM (
p
<
0.0005) and aWk (
p
<
0.05). Gamma
band power was larger during aWk (
p
<
0.0005) and phasic REM
(
p
<
0.005) compared to qWk, NREM and tonic REM (Fig. 2A). Clear
power peaks were apparent in the fast gamma range (120
e
160 Hz)
during both REM states. Power of fast gamma was larger in phasic
and tonic REM than in qWk (
p
<
0.0005) and NREM (
p
<
0.005).
Recent
fi
ndings indicate the functional signi
fi
cance of temporal
relationships between superimposed network oscillations (Tort
et al., 2008;
Axmacher et al., 2010;
Canolty and Knight, 2010). We
next estimated cross-frequency coupling strength between slow
and fast oscillations across the sleep-wake cycle (Fig. 2B). Again,
there were clear differences between vigilance states, with highest
theta-to-high frequency coupling in tonic REM (
p
<
0.0005),
fol-lowed by phasic REM (
p
<
0.05) and aWk (see also
Scheffzük et al.,
2011
and
Branka
ck et al., 2012). As expected, states with low or
negligible theta power (NREM, qWk) showed low coupling
strength. We focused our further analysis on the three states with
prominent peaks in power spectra and cross-frequency coupling
(aWk, phasic REM, tonic REM).
3.3. Effects of diazepam on theta, gamma and fast gamma
oscillations
We next investigated how DZ affects spectral content during
different vigilance states.
Fig. 3A shows the effects of DZ on power
spectra for aWk, tonic REM and phasic REM. Means of ten animals
are shown. In all analyzed frequency bands (theta, gamma, and fast
gamma), DZ dose-dependently shifted peak frequencies toward
slower oscillations (Fig. 3A, see also signi
fi
cant changes in
Fig. 4A, C
and E). In order to estimate the overall effect on oscillation
Fig. 3.Diazepam (DZ) alters the spectral content of neocortical EEG. (A) The effect of DZ on power spectral densities in the theta (left column), gamma (middle column) and fast
gamma (right column) ranges are shown for the three states with prominent theta oscillations: active waking (aWk), tonic REM (toREM) and phasic REM (phREM). All graphs show
means (S.E.M.) of ten mice. Color line code: vehicleeblack; 1 mg/kg DZered; 2 mg/kg DZeblue; 4 mg/kg DZegreen. (B) DZ did not change theta power peak width (see
Methods) during aWk (left); DZ decreased theta peak width in toREM (middle) and increased it in phREM (right). Means and S.E.M. are shown. Significances: *p<0.05, **p<0.005,
frequencies, we calculated the mean frequency in two spectral
bands (0
e
20 Hz and 20
e
160 Hz, respectively). These values were
signi
fi
cantly decreased by DZ at all three doses in all three vigilance
states (Fig. 5). To assess the effect of DZ on the regularity of theta
oscillations, we estimated the width of the theta peak by
fi
tting
a Gaussian curve to the PSD (see
Methods). Narrower peak widths
mean that theta oscillations vary less in instantaneous frequency
compared to wider peaks. We found that DZ caused a signi
fi
cant
narrowing of the theta peak during tonic REM (Fig. 3B). In contrast,
DZ induced a widening of the theta peak in phasic REM, while having
no effect on theta peak width during aWk. Therefore, the frequency
of theta oscillations becomes more regular with DZ during tonic
REM, and more variable during phasic REM. This result suggests that
the network mechanisms giving rise to theta oscillations in phasic
and tonic REM have different dependence on GABA
Areceptors.
DZ differentially affected oscillatory power depending on
vigi-lance state and frequency band (Fig. 3A, for signi
fi
cances see also
Fig. 4B,D and F). Power was calculated as band power, which is
de
fi
ned as the area under the power spectrum curve within
a frequency range of interest. We found that theta band (4
e
12 Hz)
power was selectively decreased by DZ during aWk (Fig. 4B,
p
¼
0.006). The effects of DZ on gamma power were also
state-dependent (Fig. 4D): gamma band power was increased by
diaz-epam (
p
¼
0.0003) in aWk, while it was decreased in phasic REM
(
p
¼
0.0003), and not affected in tonic REM sleep. Fast gamma
oscillations at frequencies
>
100 Hz were clearly apparent in both
types of REM sleep (see PSD curves in
Fig. 3A, middle and lower
right panels), whereas the PSD during aWk showed a less
prom-inent peak (Fig. 3A, upper right panel). DZ decreased fast gamma
band power (120
e
160 Hz) in all three theta states (Fig. 4F; aWk:
p
<
0.0001; tonic REM:
p
¼
0.0024; phasic REM:
p
<
0.0001).
3.4. State-specific effects of diazepam on theta phase coupling
As outlined above, fast and slow oscillations were superimposed
in a phase-dependent temporal order, with prominent
cross-frequency coupling between theta and both gamma bands.
Consistent with previous reports (Scheffzük et al., 2011;
Branka
ck
Fig. 4.Diazepam (DZ) differentially alters power peak frequencies (left panels) and band power (right panels) across behavioral states. DZ decreased peak frequencies of theta,
gamma and fast gamma oscillations (A, C, E) in all vigilance states, while its effect on band power (B, D, F) changed differentially, depending on frequency range and vigilance state.
Means (S.E.M.) of ten animals are shown. (B) Theta band power decreased only in aWk (p¼0.006). (D) Gamma band power increased in aWk (p¼0.0003), was largely unchanged
in toREM and decreased in phREM (p<0.0003). (F) Fast gamma band power decreased in all three theta states (aWk:p<0.0001; toREM:p¼0.0024; phREM:p<0.0001). Color
line code: aWkeblack solid line; toREMered solid line; phREMered dotted line. Peak frequency was estimated by the method illustrated inSupplementary Fig. 1and described
et al., 2012), cross-frequency coupling of gamma and fast gamma to
theta was strongly dependent on vigilance state under baseline
conditions. Most prominent peaks of coupling strength were
detected during tonic REM, but coupling of both fast oscillation
patterns was also clearly apparent in aWk and phasic REM (Fig. 6B).
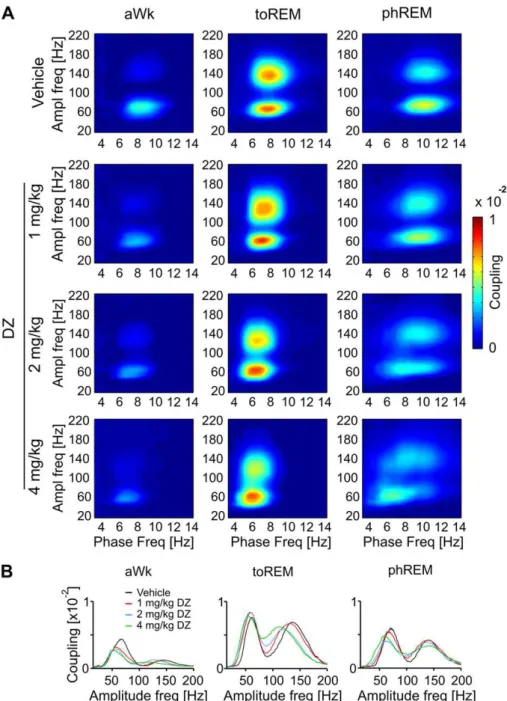
Mean (
N
¼
10) comodulation maps re
fl
ected the decrease in theta
peak frequency induced by DZ as described above (notice shift
toward lower phase frequencies in
Fig. 6A). Likewise, comodulation
analysis revealed that peak gamma frequency coupled to theta was
reduced by DZ during aWk (Fig. 7A, black line,
p
¼
0.0008) and
phasic REM (Fig. 7A, red dotted line,
p
¼
0.0032), but was not
changed in tonic REM (Fig. 7A, red solid line). The peak frequency of
fast gamma modulated by theta (Fig. 7B) decreased after DZ during
aWk (
p
¼
0.0018) and tonic REM (
p
¼
0.0155) but was not changed
in phasic REM.
The strength of theta-gamma coupling during aWk was slightly
but signi
fi
cantly reduced by DZ (Fig. 7C black line,
p
<
0.0001). This
was not the case for both REM states, where DZ had no effect on
cross-frequency coupling strength. Coupling strength between
theta phase and fast gamma oscillations was also not affected by
diazepam in any vigilance states. In summary, DZ-induced changes
in cross-frequency coupling generally re
fl
ected a global slowing of
all oscillation frequencies. The temporal relation between slow and
fast oscillations, however, remained largely preserved.
4. Discussion
Benzodiazepine effects on sleep-wake cycle and EEG spectra
have been investigated over the last thirty years (Krijzer and van
der Molen, 1987;
Van Lier et al., 2004). However, recent evidence
shows the importance of high-frequency network oscillations
(Canolty et al., 2006;
Gaona et al., 2011), which remained largely
unexplored in previous studies. Here we show that diazepam (DZ)
causes an overall slowing of slow and fast
fi
eld oscillations. Using
a series of new analysis tools in combination with a carefully
con-ducted vigilance/behavioral staging, we found that DZ-induced
changes in spectral power depend on vigilance state, whereas
peak frequencies of all major oscillations are decreased by DZ
independently of vigilance state. We also found that the strength of
the coupling between the amplitude of fast oscillations and the
phase of the theta rhythm was largely unaffected by DZ, in spite of
its effects on frequency and power of multiple neuronal oscillations.
4.1. Diazepam effects on sleep
We found a signi
fi
cant effect of diazepam on the sleep-wake
cycle in mice: NREM sleep latency decreased threefold, REM
latency was not affected, the duration of active waking decreased,
NREM and REM duration increased, and the percentage of phasic
REM on total REM decreased. This picture corresponds well to
fi
ndings by
Radulovacki et al. (1984)
who reported similar changes
in the distribution of sleep-wake states in rats (although the
increase in REM sleep duration was not signi
fi
cant in their study).
Our behavioral results are also consistent with two other studies in
rats, which however did not analyze REM sleep states separately
(Coenen and Van Luijtelaar, 1989;
Van Lier et al., 2004). Several
studies reported that DZ decreases sleep latency (Stone, 1979;
Gottesmann et al., 1998;
Kopp et al., 2004b) and increases NREM
duration (Stone, 1979;
Carley et al., 1998;
Mailliet et al., 2001;
Feng
and Gu, 2005). One group also found an increase in REM sleep after
DZ (Feng and Gu, 2005). The effects of DZ on phasic REM have been
analyzed in three previous studies, all consistently reporting
a suppression of phasic REM (Monmaur, 1981;
Gandolfo et al., 1994;
Gottesmann et al., 1998), which is in agreement with the results of
the present study.
Other reports contrast with the results mentioned above and
our own
fi
ndings. Some studies found no signi
fi
cant effects of DZ on
any stage of sleep-waking cycle (Monti et al., 1979;
Tobler et al.,
2001;
Siok et al., 2012). Others reported no change of NREM sleep
duration (Hashimoto et al., 1992;
Renger et al., 2004;
Kopp et al.,
2003,
2004a), a decrease of REM sleep (Carley et al., 1998;
Renger
et al., 2004;
Kopp et al., 2003,
2004a), or even an increase of the
time spent in waking state (Hashimoto et al., 1992). The
inconsis-tency among studies may be caused by the different doses used,
ways of application, species and strains investigated, habituation
procedures, recording conditions, or sleep stage classi
fi
cation. Of
note,
Gottesmann et al. (1998)
separated REM sleep from
a preceding intermediate transition state between NREM and REM
sleep, which can only be distinguished from REM sleep by spindle
activity in the frontal cortex. They found an increase of this
inter-mediate state by DZ at the expense of REM sleep. Since we did not
record from the frontal cortex, we were not able to distinguish this
intermediate state from REM sleep. As a consequence, our REM
sleep de
fi
nition includes the intermediate state, which may explain
why we observed a clear increase in REM sleep after DZ.
4.2. Diazepam effects on EEG power spectra
The most striking effect of DZ is an overall slowing of EEG
frequencies. In accordance with our
fi
ndings, DZ has been
consis-tently reported to decrease theta frequency during active waking
and REM sleep (Monmaur, 1981;
Caudarella et al., 1987;
Gottesmann et al., 1998;
Siok et al., 2012). In addition, we showed
that DZ differentially changes theta power and the regularity of
Fig. 5.Diazepam (DZ) causes a global slowing of neocortical EEG frequencies, for both
slow (0e20 Hz) and high (20e160 Hz) frequency ranges in all three vigilance states
with prominent theta oscillations: active waking (aWk), tonic REM (toREM) and phasic
REM (phREM). Significances: **:p<0.005, ***:p<0.0005 compared to vehicle. See
theta frequency (as inferred by peak width) depending on vigilance
state. After DZ administration, we found that theta oscillations
became more stable (as inferred by a narrower peak width) during
tonic REM sleep and less stable (i.e., larger peak width) during
phasic REM, whereas DZ did not change theta peak width in active
waking. On the other hand, theta band power decreased with DZ
treatment only during active waking.
Previous studies consistently found an increase in beta power by
DZ that is restricted to active waking (Yamamoto, 1985;
Krijzer and
van der Molen, 1987;
Valerio and Massotti, 1988;
Coenen and Van
Luijtelaar, 1989;
Santucci et al., 1989;
Van Lier et al., 2004;
Siok
et al., 2012). Our results suggest that this increase may result
from a slowing of gamma frequencies, which shifts oscillation
power into the beta band. We note that a similar interpretation had
already been given by
Van Lier et al. (2004). The slowing effect of
DZ on gamma frequency is consistent with DZ effects in vitro
(Whittington et al., 1996,
2000). The underlying cellular and
network mechanisms of action of DZ are reviewed in
Whittington
et al. (2000). Shortly, benzodiazepines positively modulate most
molecular subtypes of GABA
Areceptors, resulting in prolonged
duration of inhibitory postsynaptic potentials. The duration of
GABA
Ae
mediated phasic inhibition can, in turn, control the
frequency of gamma oscillations (Whittington et al., 2000).
Here we demonstrate that DZ also decreases the frequency of
fast gamma oscillations (Fig. 4C). Classical EEG studies hardly
investigate frequencies larger than 50 Hz; most are limited to 25 or
30 Hz. In a few studies this upper limit was extended to 100 Hz
(Krijzer and van der Molen, 1987;
Van Lier et al., 2004). There are
Fig. 6.Diazepam (DZ) decreases the frequencies of maximal cross-frequency coupling but leaves coupling strength largely unaffected. (A) Average heat maps of comodulation
strength calculated from 30 s episodes during active waking (aWk), tonic REM (toREM) and phasic REM (phREM) of ten mice, 30 min after treatment with DZ or vehicle. Warm colors represent high coupling strength, cold colors low coupling between theta phase frequency (abscissa) and the amplitude of faster oscillations (ordinate). (B) Theta coupling strength versus amplitude frequency calculated at phase frequencies of maximal coupling are shown for three theta states and different treatments, as labeled. Only theta-gamma
only few reports about DZ effects on network oscillations above
100 Hz (Nishida et al., 2009). Diazepam was shown to affect
hippocampal sharp-wave ripple oscillations (140
e
200 Hz) in vivo
by decreasing their occurrence, amplitude, duration and peak
frequency (Ponomarenko et al., 2004). Although ripple oscillations
have an overlapping frequency range with the fast gamma
oscil-lations (120
e
160 Hz) investigated here, both oscillation patterns
can be distinguished. Most importantly, ripples and fast gamma
oscillations occur during different behavioral states (ripples: qWk
and NREM sleep; fast gamma: aWk and REM sleep) and in different
brain regions (ripples: hippocampal pyramidal layer; fast gamma:
stratum oriens-alveus
and neocortex; see
Scheffer-Teixeira et al.,
2012
and
Scheffzük et al., 2011). To our best knowledge, the
present study is the
fi
rst to report DZ effects on neocortical fast
gamma oscillations.
Similar to the changes in theta power, we found that the effect of
DZ on gamma power also depended on vigilance state. Namely,
following DZ administration we observed that gamma power
increased during active waking, did not change in tonic REM, and
decreased in phasic REM. Due to the simultaneous slowing of
gamma frequencies, the increase in gamma power in active waking
likely corresponds to the beta power increase described earlier (c.f.
above). DZ decreased fast gamma power during the two REM sleep
states whereas it did not change fast gamma power in active
waking. While the cellular and network mechanisms underlying
fast gamma oscillations remain to be established, our results
suggest a critical role for the GABA
Areceptor in their generation.
4.3. Diazepam effects on cross-frequency coupling
To the best of our knowledge, no previous study has investigated
the effects of benzodiazepines on cross-frequency interactions.
Cross-frequency coupling has been previously suggested to play
a role in the execution of several cognitive functions (for a review,
see
Canolty and Knight, 2010), including some that are impaired by
DZ, such as attention and reaction times (Muñoz-Torres et al., 2011).
However, here we found that the strength of phase-amplitude
coupling was largely unaffected by DZ. The exception was a slight
reduction in theta-gamma coupling strength induced by DZ during
active waking. This could be explained by the fact that DZ decreases
locomotor activity (Stanley et al., 2005) and that theta-gamma
coupling correlates with running speed (Chen et al., 2011). In
contrast, DZ did not affect the strength of coupling between theta
and fast-gamma oscillations during active waking, suggesting that
gamma and fast gamma oscillations originate from different
mechanisms. DZ also did not affect theta-gamma (nor theta-fast
gamma) coupling strength during phasic and tonic REM sleep,
which shows that the DZ effect on theta-phase coupling depends
on vigilance state. In contrast to preserved coupling strength during
REM sleep, however, DZ changed the frequencies in which
cross-frequency coupling occurs, mirroring the induced global slowing
of oscillatory power. It is currently unclear whether such change in
peak coupling frequencies would impact the cognitive functions
associated with cross-frequency coupling.
In all, our data suggest that benzodiazepines produce a global
slowing of network oscillations, while having different effects on
the power and interaction of different frequency bands depending
on vigilance state. It remains to be established whether the
frequency- and state-speci
fi
c effects observed at the network level
(EEG) are related to the multiple different, though speci
fi
c,
cogni-tive and behavioral effects of GABA
Areceptor modulators (Korpi
et al., 2002;
Smith and Rudolph, 2012).
Acknowledgments
We thank Dr. Uwe Rudolph and Dr. Kirsten Smith for helpful
discussions and productive suggestions, Mrs. Nadine Zuber and Mr.
Reinhold
Wojciechowski
for
excellent
technical
assistance.
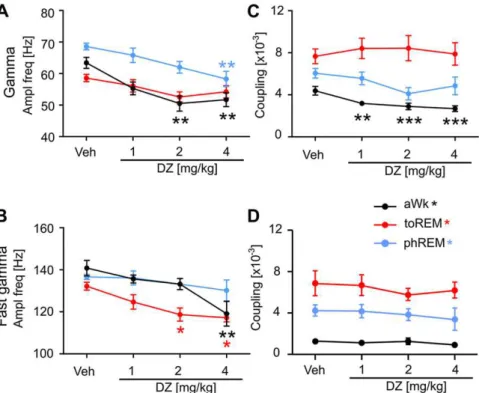
Fig. 7.Diazepam (DZ) decreases the frequency of fast oscillations amplitude-modulated by theta. (A) Gamma amplitude frequency modulated by theta significantly decreased in
active waking (aWk,p<0.005) and phasic REM sleep (phREM,p<0.005) but not in tonic REM sleep (toREM). (B) Fast gamma amplitude frequency decreased in aWk (p<0.005)
and toREM (p<0.05), but not in phREM. (C) Theta-gamma coupling strength decreased only during aWk (p<0.0005), but not in both REM sleep states. (D) Theta-fast gamma
coupling strength was not affected by DZ in any of the theta states. Means (N¼10) and S.E.M. of amplitude frequencies associated with maximal theta-phase coupling are shown.
Supported by Deutsche Forschungsgemeinschaft (SFB 636/B06),
Bernstein Center for Computational Neurosciences (BMBF) and by
Brazilian National Council of Technological and Scienti
fi
c
Devel-opment (CNPq). Some of these results have been presented in
abstract form elsewhere (Scheffzük et al., 2012).
Appendix A. Supplementary data
Supplementary data related to this article can be found at
http://
dx.doi.org/10.1016/j.neuropharm.2012.09.014.
References
Axmacher, N., Henseler, M.N., Jensen, O., Weinreich, I., Elger, C., Fell, J., 2010. Cross-frequency coupling supports multi-item working memory in the human
hippocampus. Proc. Natl. Acad. Sci. U. S. A. 107, 3228e3233.
Belluscio, M.A., Mizuseki, K., Schmidt, R., Kempter, R., Buzsáki, G., 2012.
Cross-frequency phaseephase coupling between theta and gamma oscillations in the
hippocampus. J. Neurosci. 32, 423e435.
Brankack, J., Kukushka, V.I., Vyssotski, A.L., Draguhn, A., 2010. EEG gamma
frequency and sleepewake scoring in mice: comparing two types of supervised
classifiers. Brain Res. 1322, 59e71.
Brankack, J., Scheffzük, C., Kukushka, V.I., Vyssotski, A.L., Tort, A.B.L., Draguhn, A.
Distinct features of fast oscillations in phasic and tonic REM sleep. J. Sleep Res., in press.
Buzsáki, G., 2006. Rhythms of the Brain. Oxford University Press, New York. Canolty, R.T., Knight, R.T., 2010. The functional role of cross-frequency coupling.
Trends Cogn. Sci. 14, 506e515.
Canolty, R.T., Edwards, E., Dalal, S.S., Soltani, M., Nagarajan, S.S., Kirsch, H.E., Berger, M.S., Barbaro, N.M., Knight, R.T., 2006. High gamma power is
phase-locked to theta oscillations in human neocortex. Science 313, 1626e1628.
Carley, D.W., Trbovic, S.M., Radulovacki, M., 1998. Diazepam suppresses sleep
apneas in rats. Am. J. Respir. Crit. Care Med. 157, 917e920.
Caudarella, M., Durkin, T., Galey, D., Jeantet, Y., Jaffard, R., 1987. The effect of
diaz-epam on hippocampal EEG in relation to behaviour. Brain Res. 435, 202e212.
Chen, Z., Resnik, E., McFarland, J.M., Sakmann, B., Mehta, M.R., 2011. Speed controls the amplitude and timing of the hippocampal gamma rhythm. PLoS One 6 (6), e21408.
Coenen, A.M.L., Van Luijtelaar, E.L.J.M., 1989. Effects of diazepam and two beta-carbolines on epileptic activity and on EEG and behaviour in rats with
absence seizures. Pharmacol. Biochem. Behav. 32, 27e35.
Fell, J., Axmacher, N., 2011. The role of phase synchronization in memory processes.
Nat. Rev. Neurosci. 12, 105e118.
Feng, Z., Gu, F., 2005. Power spectral analysis of recovery sleep of sleep deprivation
and hypnotic drug induced sleep. Conf. Proc. IEEE Eng. Med. Bio. Soc. 4, 3593e
3596.
Gandolfo, G., Scherschlicht, R., Gottesmann, C., 1994. Benzodiazepines promote the intermediate stage at the expense of paradoxical sleep in the rat. Pharmacol.
Bioch. Behav. 49, 921e927.
Gaona, C.M., Sharma, M., Freudenburg, Z.V., Breshears, J.D., Bundy, D.T., Roland, J.,
Barbour, D.L., Schalk, G., Leuthardt, E.C., 2011. Nonuniform high-gamma (60e
500 Hz) power changes dissociate cognitive task and anatomy in human cortex.
J. Neurosci. 31, 2091e2100.
Gottesmann, C., Gandolfo, G., Arnaud, C., Gauthier, P., 1998. The intermediate stage
and paradoxical sleep in the rat: influence of three generations of hypnotics.
Eur. J. Neurosci. 10, 409e414.
Guide for the Care and Use of Laboratory Animals, 1996. Institute of Laboratory Animal Research, Commission on Life Sciences. National Research Council. National Academies Press, Washington, D.C.
Hashimoto, T., Hamada, C., Wada, T., Fukuda, N., 1992. Comparative study on the behavioural and EEG changes induced by diazepam, buspirone and a novel anxioselective anxiolytic, DN-2327, in the cat. Neuropsychobiology
26, 89e99.
Kopp, C., Rudolph, U., Keist, R., Tobler, I., 2003. Diazepam-induced changes on sleep
and the EEG spectrum in mice: role of thea3-GABAAreceptor subtype. Eur. J.
Neurosci. 17, 2226e2230.
Kopp, C., Rudolph, U., Tobler, I., 2004a. Sleep EEG changes after zolpidem in mice.
Neuroreport 15, 2299e2302.
Kopp, C., Rudolph, U., Löw, K., Tobler, I., 2004b. Modulation of rhythmic brain
activity by diazepam: GABAAreceptor subtype and state specificity. Proc. Natl.
Acad. Sci. U. S. A. 101, 3674e3679.
Korpi, E.R., Gründer, G., Lüddens, H., 2002. Drug interactions at GABAAreceptors.
Progr. Neurobiol. 67, 113e159.
Krijzer, F.N.C.M., van der Molen, R., 1987. Classification of psychotropic drugs by rat
EEG analysis: the anxiolytic profile in comparison to the antidepressant and
neuroleptic profile. Neuropsychobiology 18, 51e56.
Mailliet, F., Galloux, P., Poisson, D., 2001. Comparative effects of melatonin, zolpi-dem and diazepam on sleep, body temperature, blood pressure and heart rate
measured by radiotelemetry in Wistar rats. Psychopharmacology 156, 417e426.
Mann, E.O., Paulsen, O., 2007. Role of GABAergic inhibition in hippocampal network
oscillations. Trends Neurosci. 30, 343e349.
Mizuseki, K., Diba, K., Pastalkova, E., Buzsáki, G., 2011. Hippocampal CA1 pyramidal
cells form functionally distinct sublayers. Nat. Neurosci. 14, 1174e1181.
Monmaur, P., 1981. Phasic hippocampal activity during paradoxical sleep in the rat:
selective suppression after diazepam administration. Experientia 37, 261e262.
Montgomery, S.M., Sirota, A., Buzsáki, G., 2008. Theta and gamma coordination of hippocampal networks during waking and rapid eye movement sleep.
J. Neurosci. 28, 6731e6741.
Monti, J.M., Altier, H., D’Angelo, L., 1979. The effects of the combined administration
of gamma-hydroxybutyrate and diazepam on sleep parameters in the rat.
J. Neural Transm. 45, 177e183.
Muñoz-Torres, Z., del Rio-Portilla, Y., Corsi-Cabrera, M., 2011. Diazepam-induced changes in EEG oscillations during performance of a sustained attention task.
J. Clin. Neurophysiol. 28, 394e399.
Nishida, M., Sood, S., Asano, E., 2009. In-vivo animation of midazolam-induced
electrocorticographic changes in humans. J. Neurol. Sci. 287, 151e158.
Ponomarenko, A.A., Korotkova, T.M., Sergeeva, O.A., Haas, H.L., 2004. Multiple
GABAA receptor subtypes regulate hippocampal ripple oscillations. Eur. J.
Neurosci. 20, 2141e2148.
Radulovacki, M., Sreckovic, G., Zak, R., Zahrebelski, G., 1984. Diazepam and mid-azolam increase light slow wave sleep (SWS1) and decrease wakefulness in rats.
Brain Res. 303, 194e196.
Renger, J.J., Dunn, S.L., Motzel, S.L., Johnson, C., Koblan, K.S., 2004. Sub-chronic
administration of zolpidem affects modifications to rat sleep architecture. Brain
Res. 1010, 45e54.
Sakai, K., Sano, K., Iwahara, S., 1973. Eye movements and hippocampal theta activity
in cats. Electroencephalogr. Clin. Neurophysiol. 34, 547e549.
Santucci, V., Fournier, M., Worms, P., Keane, P., Bizière, K., 1989. Cerebral-acti-vating (EEG) properties of two inverse agonists and of an antagonist at the
benzodiazepine receptor in the rat. Naunyn-Schmiedeberg’s Arch. Pharmacol.
340, 93e100.
Scheffer-Teixeira, R., Belchior, H., Caixeta, F.V., Souza, B.C., Ribeiro, S.T., Tort, A.B.L.,
2012. Theta phase modulates multiple layer-specific oscillations in the CA1
region. Cereb. Cortex 22, 2404e2414.
Scheffzük, C., Kukushka, V.I., Vyssotski, A.L., Draguhn, A., Tort, A.B.L., Brankack, J.,
2011. Selective coupling between theta phase and neocortical fast gamma oscillations during REM-sleep in mice. PLoS One 6, e28489.
Scheffzük, C., Draguhn, A., Tort, A.B., Brankack, J., 2012. State-specific effects of
diazepam on cross-frequency coupling between theta-phase and high frequency oscillations in the parietal cortex of freely moving mice. Acta Physiol. 204 (S689), 151.
Siok, C.J., Cogan, S.M., Shifflett, L.B., Doran, A.C., Kocsis, B., Hajós, M., 2012.
Comparative analysis of the neurophysiological profile of group II metabotropic
glutamate receptor activators and diazepam: effects on hippocampal and
cortical EEG patterns in rats. Neuropharmacology 62, 226e236.
Smith, K.S., Rudolph, U., 2012. Anxiety and depression: mouse genetics and phar-macological approaches to the role of GABA(A) receptor subtypes.
Neurophar-macology 62, 54e62.
Stanley, J.L., Lincoln, R.J., Brown, T.A., McDonald, L.M., Dawson, G.R., Reynolds, D.S., 2005. The mouse beam walking assay offers improved sensitivity over the
mouse rotarod in determining motor coordination deficits induced by
benzo-diazepines. J. Psychopharmacol. 19, 221e227.
Stone, B.M., 1979. Diazepam and its hydroxylated metabolites: studies on sleep in
healthy man. Br. J. Clin. Pharmacol. 8, 57Se61S.
Straub, C.J., Carlezon Jr., W.A., Rudolph, U., 2010. Diazepam and cocaine potentiate
brain stimulation reward in C57BL/6J mice. Behav. Brain Res. 206, 17e20.
Tan, K.R., Rudolph, U., Lüscher, C., 2011. Hooked on benzodiazepines: GABAA
receptor subtypes and addiction. Trends Neurosci. 34, 188e197.
Tobler, I., Kopp, C., Deboer, T., Rudolph, U., 2001. Diazepam-induced changes in
sleep: role of thea1 GABAAreceptor subtype. Proc. Natl. Acad. Sci. U. S. A. 98,
6464e6469.
Tort, A.B.L., Kramer, M.A., Thorn, C., Gibson, D.J., Kubota, Y., Graybiel, A.M.,
Kopell, N.J., 2008. Dynamic cross-frequency coupling of localfield potential
oscillations in rat striatum and hippocampus during performance of a T-maze
task. Proc. Natl. Acad. Sci. U. S. A. 105, 20517e20522.
Tort, A.B.L., Komorowski, R., Manns, J.R., Kopell, N.J., Eichenbaum, H., 2009. Theta-gamma coupling increases during the learning of item-context associations.
Proc. Natl. Acad. Sci. U. S. A. 106, 20942e20947.
Tort, A.B.L., Komorowski, R., Eichenbaum, H., Kopell, N., 2010. Measuring phase-amplitude coupling between neuronal oscillations of different frequencies.
J. Neurophysiol. 104, 1195e1210.
Use of animals in research, 2001. European Science Foundation Policy Briefings,
second ed. ISRNESF-SPB-01-15, Strasbourg, pp. 1e6.
Valerio, A., Massotti, M., 1988. Electroenecphalographic changes after short-term exposure to agonists of benzodiazepine receptors in the rat. Pharmacol.
Bio-chem. Behav. 29, 791e795.
Van Lier, H., Drinkenburg, W.H.I.M., van Eeten, Y.J.W., Coenen, A.M.L., 2004. Effects
of diazepam and zolpidem on EEG beta frequencies are behavior-specific in rats.
Neuropharmacology 47, 163e174.
Vyssotski, A.L., Serkov, A.N., Itskov, P.M., Dell’Omo, G., Latanov, A.V., Latanov, A.V.,
Wolfer, D.P., Lipp, H.P., 2006. Miniature neurologgers for flying pigeons:
multichannel EEG and action andfield potentials in combination with GPS
recording. J. Neurophysiol. 95, 1263e1273.
Vyssotski, A.L., Dell’Omo, G., Dell’Ariccia, G., Abramchuk, A.N., Serkov, A.N.,
Latanov, A.V., Loizzo, A., Wolfer, D.P., Lipp, H.P., 2009. EEG responses to visual
Whittington, M.A., Traub, R.D., 2003. Interneuron diversity series: inhibitory
interneurons and network oscillations in vitro. Trends Neurosci. 26, 676e682.
Whittington, M.A., Jefferys, J.G.R., Traub, R.D., 1996. Effects of intravenous anaes-thetic agents on fast inhibitory oscillations in the rat hippocampus in vitro. Br. J.
Pharmacol. 118, 1977e1986.
Whittington, M.A., Faulkner, H.J., Doheny, H.C., Traub, R.D., 2000. Neuronal fast oscillations as a target site for psychoactive drugs. Pharmacol. Ther. 86,
171e190.
Wulff, P., Ponomarenko, A.A., Bartos, M., Korotkova, T.M., Fuchs, E.C., Bähner, F., Both, M., Tort, A.B., Kopell, N.J., Wisden, W., Monyer, H., 2009. Hippocampal theta rhythm and its coupling with gamma oscillations require fast inhibition onto parvalbumin-positive interneurons. Proc. Natl. Acad. Sci. U. S. A. 106,
3561e3566.
Yamamoto, J., 1985. Characteristics of the cortical and hippocampal EEG power spectra of rabbits during normal behavioural states and after drug