Brazilian Journal of Physics, vol. 39, no. 2A, August, 2009 431
Critical behavior of the delay-induced chaos transition in a nonlinear model for the immune
response
Elder de Souza, Marcelo Lyra, Iram Gleria Instituto de F´ısica - Universidade Federal de Alagoas
57072970 - Macei´o, AL, Brazil
(Received on 6 January, 2009)
In this paper we analyze a model for the dynamics of the immune system interacting with a target population. The model consists in a set of two-dimensional delayed differential equations. The model is effectively infinite dimensional due to the presence of the delay and chaotic regimes can be supported. We show that a delayed response induces sustained oscillations and larger delay times implies in a series of bifurcations leading to chaos. The characteristic exponent of the critical power law relaxation towards the stationary state is obtained as well as the critical exponent governing the vanishing of the order parameter in the vicinity of the chaotic transition.
Keywords: Delayed systems, Immune response, Chaos
1. INTRODUCTION
Mathematical models for the dynamics of the immune sys-tem received considerable interest in physics literature [1]. The models are simplified versions that try to mimic the com-plex behavior of real systems. In spite of this simplicity, such models can provide insights on the real situation and help to understand the intricate dynamics involved.
The more complicated models may display more accu-rately the complex patterns observed in real data, but there are difficulties concerning numerical estimations of the parame-ters and the meaning of the many interaction terms that ap-pear in such high dimensional models [2]. Alternatively one may propose low dimensional models that present some of the observed basic phenomena. The model of H. Mayeret al proposed in [3] follows this approach. It models the interac-tion of the immune system with a target populainterac-tion (e.gvirus or bacteria). A two dimensional set of differential equations with nonlinear interactions between specific immune compo-nents (the immune competenceE measured by the concen-tration of certain immune cells as, for example, cytotoxic T lymphocytes cells (CTLs), killer T cells, etc) and the target population T (e.g bacteria and viruses) is considered. The model is as follows:
˙
T = rT−kT E ˙
E = pT
u
1+Tν+
sEn
1+En−E,u≤ν. (1) In the above system,r>0 represents the reproduction rate of the target population andk>0 the elimination rate of the targets by the immune cells. The first term in the dynam-ics ofE represents the speed of the processes triggered by the targetsT leading to their elimination byE. For example, non-specific precursor cells or inactivated T-cells are trans-formed into specific helper cells, CTL cells or plasma cells in the presence of targets, producing certain antibodies. All the constants (p,u,ν) are positive and u≤ν. The second term represents the autocatalytic effect of immune responses. Fi-nally, the term−Ereflects the finite lifetime ofE.
In the above model, the complex interactions of the im-mune system with the foreign agentsT are represented by few measurable quantities. The nonlinearities in the dynam-ics ofEandTare the only source of complexity in the model.
Since it is a two-dimensional set of ODE’s, only regular tra-jectories are observed. In many cases real time series data of the immune state look rather irregular, suggesting chaotic be-havior. See for example the data shown in [3] for the number of killer cells versus tumor size during a metastatic process of Fibrosarcoma.
In [5] and [6], the Mayeret. al. model was modified to include time delays and the possibility of delay induced chaos was explored. Here, we also consider variants of (1) with delayed responses. We focus on a simple model given by:
˙
T = rT−bT2−kT E, ˙
E = pT(t−τ) 1+T(t−τ)2+
sE2
1+E2−E. (2)
If b6=0, we are admitting a competition for the limited resources available to the target population. The sigmoid be-havior of1+pTT((t−τt−τ))2 means that the immune system ignores the T population if it is below a given threshold . Furthermore, this term is bounded reflecting the fact that the precursorE population is limited. Our motivation is to search in this sim-ple model some patterns observed in real situations. In the next section, we show that, as expected, the delayed response may induce oscillations inT andE.
It is well known that the introduction of the delay makes the model effectively infinite dimensional. Chaos can thus be observed in one dimensional delayed systems [4].
In the next section we show that the delayed response in-duces sustained oscillations and larger delay times imply in a series of bifurcations leading to chaos. The characteristic exponent of the critical power law relaxation towards the sta-tionary state is obtained as well as the critical exponent gov-erning the vanishing of the order parameter in the vicinity of the chaos transition.
We compute the critical delay-time above which the sta-tionary solution is unstable. The dynamics of the system in the neighborhood of the critical point is characterized by the dynamic critical exponent. We show that the bifurcations evolve to a chaotic regime.
432 Elder de Souza et al.
300 350 400 450 500
t 0.2
0.3 0.4 0.5 0.6
T
FIG. 1:Trajectories for theTpopulation after the initial outbreak forτ>τ∗. Parameters used(r,k,p,s,b) = (3,2,2,1.25,0.3).
0 0.3 0.6 0.9 1.2 1.5
τ 0
0.1 0.2 0.3 0.4 0.5 0.6
A(E)
FIG. 2: a) Amplitudes of oscillation of theEpopulation. Parameters used
(r,k,p,s,b) = (3,2,2,1.25,0.3).
10-2 10-1
τ−τ∗ 10-1
A(T)
FIG. 3: A(T)∝(τ−τ∗)β as τ→τ∗
+. Parameters used (r,k,p,s,b) =
(3,2,2,1.25,0.3). We estimateβ=0.5.
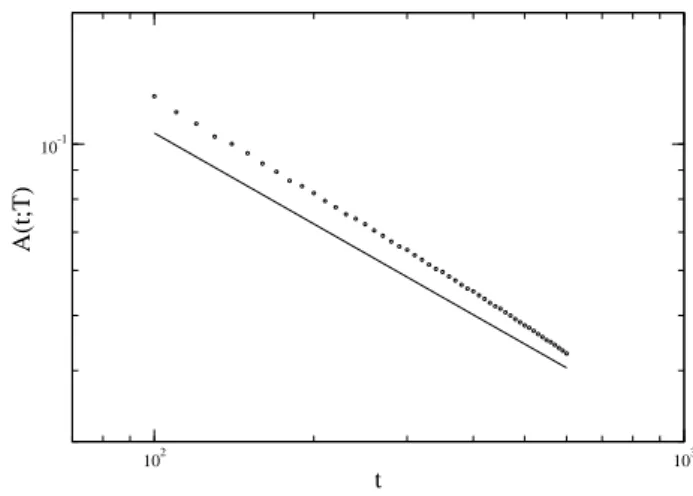
102 103
t
10-1
A(t;T)
FIG. 4:A(t;T)∝t−φ. Parameters used(r,k,p,s,b) = (3,2,2,1.25,0.3). We
estimateφ=0.5.
0 3 6 9 12 15 18 21 24 27 30
τ
0 0,5 1 1,5 2
E_max
FIG. 5:MaximumEas a function of the delay time. A series of bifurcations leading to chaos is observed in caseb6=0.Parameters used(r,k,p,s,b) = (3,2,2,1.25,0.3).
2. SOME RESULTS
Let us consider(r,k,p,s,b) = (3,2,2,1.25,0.3)[3]. The (real) fixed points of system (2) are:
(1) (T1∗,E1∗) = (0,0) (3)
(2) (T2∗,E2∗) = (0.3352282998,1.449715755)
The Jacobian matrix is given by:
J= "r−
2bT∗−kE∗ −kT∗
e−λτp(1−T∗2) (1+T∗2)2
2sE∗
(1+E∗2)2−1 #
; (4)
It is straightforward to show that the trivial stationary solu-tion is unstable for all values ofτ. For null delay, the interior fixed point is stable. Whenτ6=0 the analysis is performed with the help of the following theorem [7]:
Brazilian Journal of Physics, vol. 39, no. 2A, August, 2009 433
0 0.2 0.4 0.6 0.8 1
T
1 1.2 1.4 1.6 1.8 2
E
0 2 4 6 8 10
T
0 0.5 1 1.5 2
E
0 2 4 6 8 10
T
0 0.5 1 1.5 2
E
0 2 4 6 8 10
T
0 0.5 1 1.5 2
E
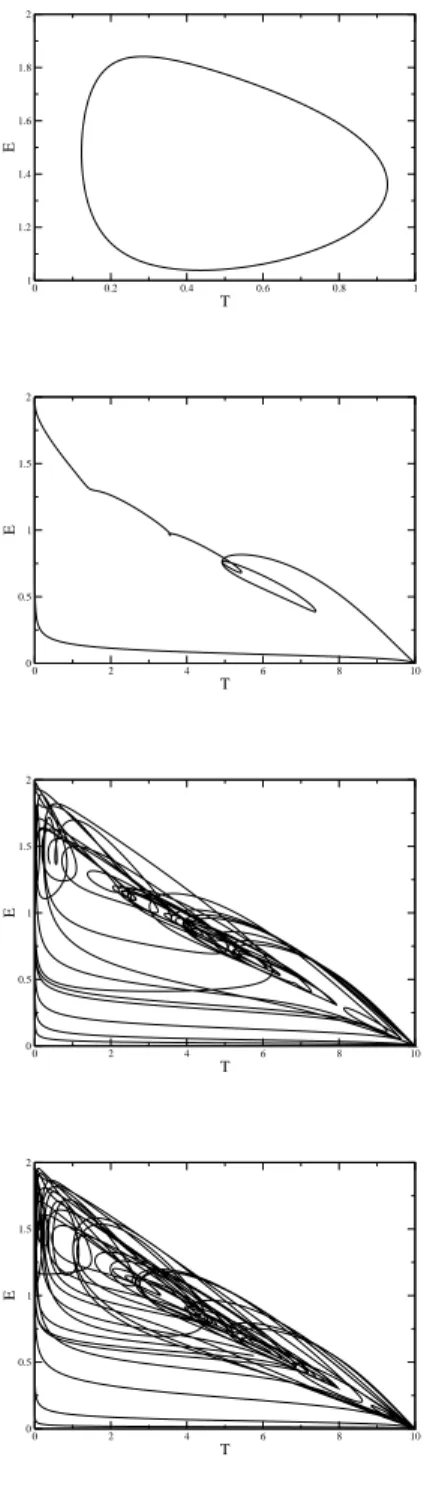
FIG. 6: Typical phase portraits. Parameters used (r,k,p,s,b) = (3,2,2,1.25,0.3). a)τ=1, b)τ=9, c)τ=17, d)τ=28.
Q(λ) are analytic functions in a right half-plane Reλ>
−δ,δ>0which satisfy:
i)P(λ),Q(λ)have no common imaginary zero,
ii) P(−Iy) =P(Iy),Q(−Iy) =Q(Iy),y∈ℜ where the bar means conjugate;
iii)P(0) +Q(0)6=0;
iv)There are at most a finite number of roots of P(λ) + Q(λ)e−λτ=0in the right half plane ifτ=0;
v) F(y) =|P(Iy)|2− |Q(Iy)|2with y∈ℜhas at most a finite number of real zeros.
Then the following statements are true:
a) Suppose F(y) =0has no positive real roots. Then if the
associated fixed point is stable (unstable) forτ=0it remains stable (unstable) for allτ>0.
b) Suppose F(y) =0has at least one positive root and that each positive root is simple. Asτincreases, stability switches may occur. There existsτ∗>0such that P(λ) +Q(λ)e−λτ=0 is unstable for allτ>τ∗. Asτvaries from0toτ∗at most a finite number of stability switches may occur.
The characteristic equation for the interior fixed point is given by:
λ2+Bλ+C+Qe−λτ (5) withB=2.534071424,C=1.190945352,Q=0.961886711. Constructing F(y) as above, we find the following roots forF(y) =0:y= [±0.8837551400,±1.086095210I], which means we are in case b) of the above theorem. In fact, the critical value of the delay, sayτ∗, above which the point loses its stability, can be obtained as follows. Letλ=u+Iω, the critical delay then occurs whenu=0. With this substitution in (5) we obtain:
cos(ωτ∗) = −ω−C
Q (6)
sin(ωτ∗) = Bω Q
which can be solved numerically givingτ∗≈0.823.
From the discussion above, we conclude that ifτ<τ∗the system presents damped oscillations toward the stable equi-librium. A delayτ>τ∗makes this fixed point unstable and, after an initial outbreak in theT population, we expect to ob-serve sustained oscillations in the concentrations ofT andE. Solving (2) with a modified Runge-Kutta method, we show in figure 1 the behavior ofT forτ>τ∗. Note that the min-imumT population is smaller than the equilibrium value of the stationary solution. As pointed out in [4], this may bring advantages to the immune system because other strategies for the elimination ofT may be more efficient when theT con-centration is lower than the equilibrium value.
We characterized the critical behavior atτ=τ∗, by com-puting the amplitude of theEoscillations as a function of the delay-time. In Figure 2, the amplitudes of oscillations (after the transient) for theEpopulation versusτare shown. At the critical delayτ=τ∗, the amplitude decays with a power-law. In figure 3 we consider the amplitudes in theT population, sayA(T). We haveA(T)∝(τ−τ∗)βasτ→τ∗+, withβ=0.5 as seen in figure 3. The damped oscillations also become criti-cal. LetA(t;T)denote the time evolution of the damped oscil-lations. We observed a power-law behaviorA(t;T)∝t−φ, see figure 4. We estimate the critical exponent as beingφ≈0.5 (within the error bar).
434 Elder de Souza et al.
Figure 6 shows some typical phase portraits, where the emergence of chaos can be observed. Figures 6 a) and b) show typical oscillatory behavior forτ>τ∗. We illustrate the series of bifurcations that appears as we increase the delay. Figure 6 c) and d) shows typical chaotic trajectories.
3. CONCLUDING REMARKS
We analyzed a two-dimensional system with delay that models the dynamics of the interaction of the immune com-petenceE with a target population T. Several different be-haviors are present in this model due to the presence of non-linear functions in the dynamics ofE. The dynamics of the delayed model is, in some aspects, richer than that of the orig-inal model. For example, it allows the presence of chaos.
We showed that the delay induces bifurcations and the sta-tionary solution becomes oscillatory above a critical delay.
The characteristic exponents of this bifurcation and the criti-cal dynamics were obtained. Larger delay times induces bi-furcations which ultimately lead to chaos, which is forbidden in the original non-delayed model.
Low dimensional models have the advantage that several phenomena may be viewed as the result of few basic mech-anisms [3]. High dimensional models with many variables may furnish better computational results, but our work rein-forces the fact that simple models, based on a few number of easily interpreted parameters, are able to simulate some phe-nomena observed in real situations.
4. ACKNOWLEDGMENTS
The authors acknowledge financial support from CNPq, CAPES and FAPEAL.
[1] Wang K, Wang W, Pang H, Liu X. Physica D, 2007; 226: 197. [2] Perelson AS and Weisbuch G. Review of Modern Physics, 1997;
69-4: 1219.
[3] Mayer H, Zaenker KS and An der Heiden U. Chaos, 1995; 5-1: 155.
[4] Canabarro A, Iram Gleria and Lyra ML. Physica A, 2004; 342: 234.
[5] Buri´c N , Mudrinic M and Vasovi´c N. Chaos, Solitons and Frac-tals, 2001; 12: 483.
[6] Elder de Souza, Marcelo Lyra and Iram Gleria. pre-print. [7] Cooke KL and Van den Driessche P. Funkcial. Ekvac., 1986; 29: