Multivariate analysis of marketing data -
applications for bricolage market
Mihai FÂNARU
1Abstract: By using concepts and analytical tools for computing, marketing is directly related to the quantitative methods of economic research and other areas where the efficiency of systems performances are studied. Any activity of the company must be programmed and carried out taking into account the consumer. Providing a complete success in business requires the entrepreneur to see the company and its products through the consumers eyes, to act as representative of its clients in order to acquire and satisfy their desires. Through its complex specific activities, marketing aims to provide goods and services the consumers require or right merchandise in the right quantity at the right price at the right time and place. An important consideration in capturing the link between marketing and multivariate statistical analysis is that it provides more powerful instruments that allow researchers to discover relationships between multiple configurations of the relationship between variables, configurations that would otherwise remain hidden or barely visible. In addition, most methods can do this with good accuracy, with the possibility of testing the statistical significance by calculating the level of confidence associated with the link validation to the entire population and not just the investigated sample.
Key-words:marketing, consumer, multivariate statistical analysis, variables
1. Introduction
A good analogy to express the relationship between the information contribution of univariate and bivariate methods on one hand and that of the multivariate, on the other hand, could be for example, just like making a comparison between black&white and color photos. As it can be understood from its name, multivariate means, in the simplest sense, ”many variables considered simultaneously” in the analysis, in most cases involving more than two variables. In this respect, multivariate methods can analyze the networking of several variables analyzed simultaneously, based on a specific model for each individual method.
Most of the techniques identify configurations of similarities or links between variables, or make predictions or estimate the relative importance of each variable in predicting or explaining certain variables.
1
When the researcher seeks to explain, predict or understand marketing variables (especially those which measure the results or effects) it is recommended the use of multivariate techniques to study the dependencies. Whether it is about sales or market shares, product ratings or services, the satisfaction or purchase intent, the decision maker in marketing will be interested to know which variables can explain or influence these results and to learn more about the nature of the link between them.
An important milestone in capturing the dynamic relationship between marketing and multivariate statistical analysis is the research conducted by Jagdish N. Sheth, entitled ”Multivariate revolution in marketing research”. The author presented the framework of the most usefull multivariate statistical techniquesfor marketing research, along with a brief description of each. In addition, the article treats the extremely important role of information technology, hardware and software development for the rapid expansion of the widespread use of these methods. Since then, it is considered that the use of multivariate analysis methods began to increase significantly and this trend will continue in the future.
The main objective of this study is seeking to achieve a comprehensive study that capture the place the consumer stands on in the consumer promotion strategy developed by Dedeman, using a number of multivariate analysis methods. Also the study aims at identifying the main promotional techniques the company uses and analysis of the effect those have on consumers.
2. Methodology of scientific investigation
In order to realise this study several methods of multivariate data analysis were used. The multivariate methods can be classified into methods of analyzing dependencies, characterized in that one or more variables are considered dependencies and another group forming the set of independent variables (factors or predictors) and methods for analyzing interdependencies, aiming grouping data based on covariance similarities between them, allowing the identification of structures (configurations) in the data set; they do not analyze the dependence between variables links.
The main categories of methods for analyzing dependence relations that will be treated are:
¾ factorial analysis – investigates the ties of interdependence between several variables by which to characterize a particular phenomenon by reducing (condensation) the data volume contained in the initial variables and establishing a smaller set of dimensions (factors), aiming at a minimum loss of information. The analysis does not aim to make estimates and predictions, but seeks grouping variables taken into consideration, focusing on the analysis on the interdependencies among them.
number of variables and interdependencies between them. Cohort Analysis, apart from ensuring homogeneity within groups also creates big differences between groups. Most clustering methods are heuristic-based on algorithms and are relatively simple. They are not based on complex models and exhaustive statistical tools, being from this point of view, substantially different methods of multivariate analysis of variance, regression, multiple linear discriminant or the factor analysis. As far as its purpose and work method, groups analysis is interested in the similarity between objects.
¾ multidimensional scaling - is a process in which, using various techniques, the analyzed objects (incentives) are represented by points in a multidimensional perceptual space. The axes of this area are interpreted as attributes with which objects are differentiated from each other and it is assumed that they are the expression of psychological springs through which the respondents form their perceptions and preferences related incentives. Being also a method that focuses on studying the similarities between objects, multidimensional scaling is somewhat the reverse of analysis groups: while group analysis classifies objects according to similarities between them, according to some dimensions prespecified multidimensional scaling extracts the fundamental dimensions of similarities and preferences indicated by consumers.
Although these methods are called to study methods dependencies should be noted that they visit and estimate relationships between variable and does not purport to demonstrate causality between variables (except statements that relate directly to this and meet conditions methodological necessary, specific marketing experiments).
3. Results and discussions
Multivariate analysis of marketing data was conducted based on primary data obtained through quantitative research. The quantitative research took place between 15.01.2016-17.06.2016. The research was conducted on a sample of 384 respondents.
3.1. Cluster analysis
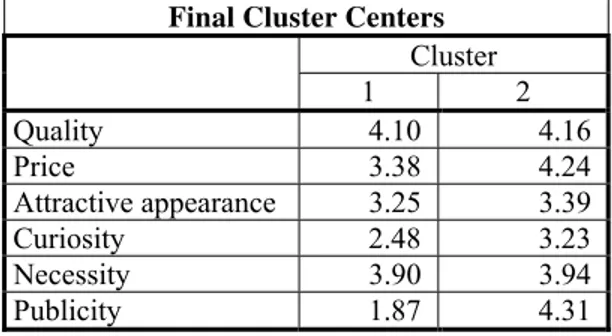
Final Cluster Centers Cluster
1 2
Quality 4.10 4.16
Price 3.38 4.24
Attractive appearance 3.25 3.39
Curiosity 2.48 3.23
Necessity 3.90 3.94
Publicity 1.87 4.31
Table 3.1. The final centers of two clusters
In Table 3.2 are presented the dimensions of the two clusters of the 370 respondents, 140 are part of cluster 1 (which believes that the analyzed variables underlying the purchase of products of the bricolage company Dedeman) while 121 are part of the cluster 2 and are skeptics.
Number of Cases in each Cluster
1 140.000
2 121.000
Valid 261.000 Cluster
Missing 119.000
Table 3.2. The dimensions of two clusters
ANOVA
Cluster Error
Mean Square df Mean Square df F Sig.
Quality .081 1 .951 257 .085 .770
Price 8.017 1 .779 257 10.296 .002
Attractive appearance 1.296 1 1.081 257 1.199 .275
Curiosity 36.310 1 1.433 257 25.339 .000
Need .231 1 1.344 257 .172 .679
Publicity 379.537 1 .639 257 594.258 .000
Table 3.3 Analysis of variance for each variable
differences between groups for which there is rarely reason for the differences to be insignificant.
3.2. The ANOVA analysis
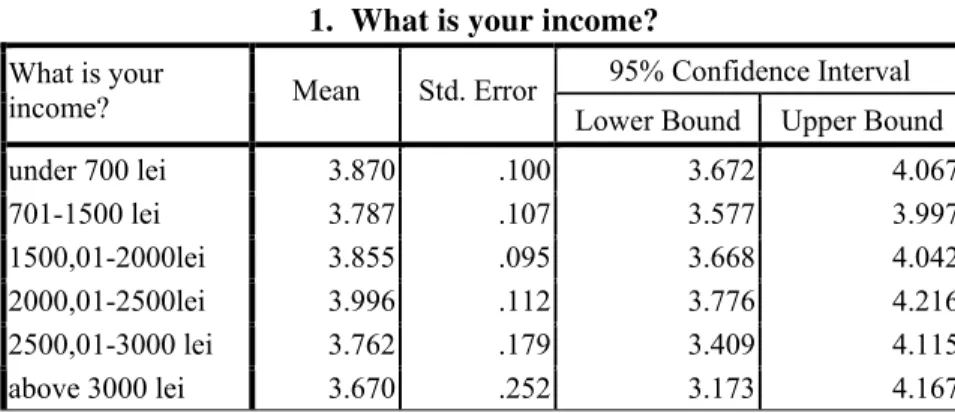
Table 2.4 notes that, in the analyzed sample, there are differences between the 6 groups formed based on income, regarding the degree of satisfaction created by the products sold in Dedeman.
1. What is your income?
95% Confidence Interval What is your
income? Mean Std. Error Lower Bound Upper Bound
under 700 lei 3.870 .100 3.672 4.067
701-1500 lei 3.787 .107 3.577 3.997
1500,01-2000lei 3.855 .095 3.668 4.042
2000,01-2500lei 3.996 .112 3.776 4.216
2500,01-3000 lei 3.762 .179 3.409 4.115
above 3000 lei 3.670 .252 3.173 4.167
Table 3.4 Population income
In table 2.4 is obtained a confidence interval for the total population in those environments. The analysis of these intervals is observed that some overlap, which suggests that between the averages of those categories may not appear differences.
2. What is the highest form of education graduate?
95% Confidence Interval What is the highest form
of education graduate ? Mean Std. Error Lower Bound Upper Bound
secondary education 3.768 .207 3.361 4.176
post secondary school 3.701 .135 3.435 3.966
hight scool 3.806 .149 3.512 4.101
university studies 3.612 .149 3.317 3.906
postgraduate studies 3.521 .211 3.105 3.937
Table 3.5 The opinion regarding Dedeman products based on revenue
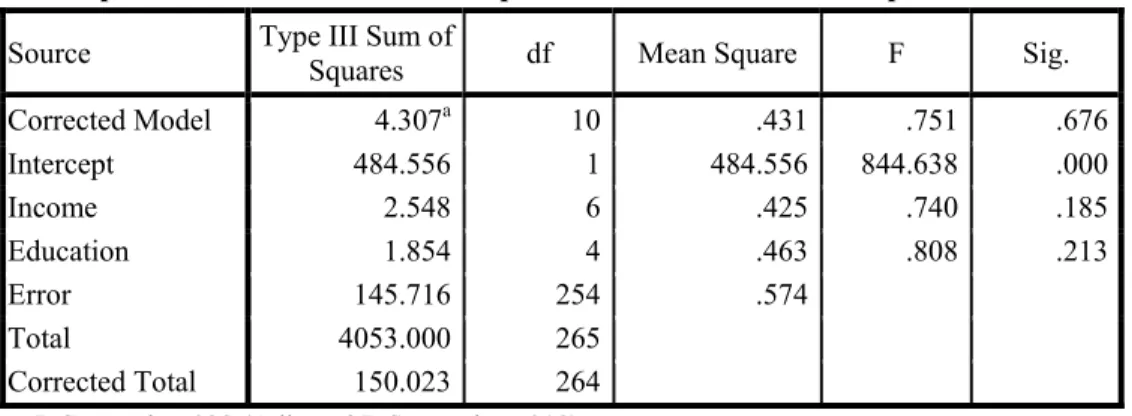
Dependent Variable: What about products that are found in shops Dedeman?
Source Type III Sum of
Squares df Mean Square F Sig.
Corrected Model 4.307a 10 .431 .751 .676
Intercept 484.556 1 484.556 844.638 .000
Income 2.548 6 .425 .740 .185
Education 1.854 4 .463 .808 .213
Error 145.716 254 .574
Total 4053.000 265
Corrected Total 150.023 264
a. R Squared = .029 (Adjusted R Squared = -.010)
Table 3.6 Tests of Between-Subjects Effects
In Table 3.6 the overall average of the image of Dedeman products is computed, which does not take into account the factors group and a confidence interval estimated for the total population. This way we can guarantee a 95% probability that image of Dedeman’s products is between 3.432 and 3.93.
If the case of the variable Income Fcalc=0.72> F0.05;6;254=0.31, so we wil accept the H1 hypothesis that age has a significant influence on the image of Dedeman products.
In a similar way for the variable Education Fcalc=0.80>F0.05;4;254=0.31, which leads us to the conclusion that education has a significant influence on how the products are perceived.
3.3. Main components analysis
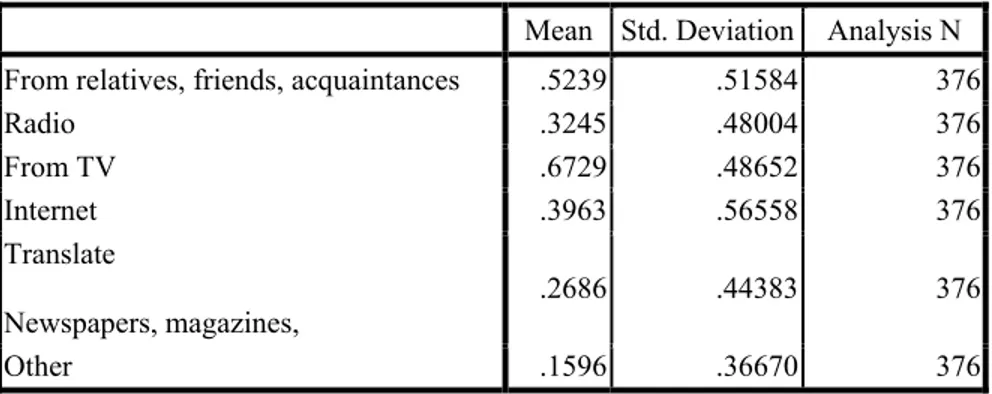
A first category of results refers to the average obtained for each of the variables included in the model. In the table below it can be seen that from the 376 respondents were obtained means for the 6 variables.
Mean Std. Deviation Analysis N
From relatives, friends, acquaintances .5239 .51584 376
Radio .3245 .48004 376
From TV .6729 .48652 376
Internet .3963 .56558 376
Translate
Newspapers, magazines,
Mean Std. Deviation Analysis N
From relatives, friends, acquaintances .5239 .51584 376
Radio .3245 .48004 376
From TV .6729 .48652 376
Internet .3963 .56558 376
Translate
Newspapers, magazines,
.2686 .44383 376
Other .1596 .36670 376
Table 3.7. The means of the variables introduced into the model
Table 3.8. The coefficients correlation matrix of the analyzed variables
There can be observed the relatively high correlations between Internet and TV information sources as well as between the information sources consisting of newspapers and magazines. The small correlations appear between sources of information as radio and TV as well as between sources of information constituted from magazines and other sources.
Correlation Matrix
From relatives, friends, acquaintances
From
radio From Tv Internet
News-papers, magazines,
Other
From relatives, friends, acquaintances
1.000 .205 -.048 -.055 .048 -.048
From radio .205 1.000 -.138 -.003 .078 .099
From Tv -.048 -.138 1.000 .133 .161 -.125
Internet -.055 -.003 .133 1.000 .032 -.074
Newspapers,
magazines, .048 .078 .161 .032 1.000 -.018
Cor-relation
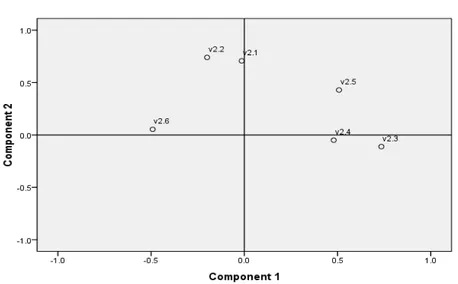
Component Matrixa
Component
1 2
From relatives, friends,
acquaintances .406 .580
From radio .578 .504
From Tv -.672 .317
Internet -.426 .225
Newspapers, magazines -.183 .639
Other .438 -.229
Table 3.9. Component matrix
After extracting those two factors that are the main components, the coefficients of correlation between the variables analyzed and main components are computed. The promotion sources are observed including: radio, relatives, friends, acquaintances and other sources of promotion are strongly correlated with the first component and the information sources include TV, Internet, magazines and newspapers with a second component.
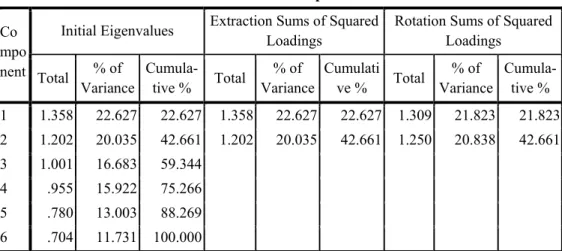
Table 3.10. Total variance explained Total Variance Explained
Initial Eigenvalues Extraction Sums of Squared Loadings
Rotation Sums of Squared Loadings
Co mpo
nent Total % of Variance
Cumula-tive % Total
% of Variance
Cumulati ve % Total
% of Variance
Cumula-tive %
1 1.358 22.627 22.627 1.358 22.627 22.627 1.309 21.823 21.823
2 1.202 20.035 42.661 1.202 20.035 42.661 1.250 20.838 42.661
3 1.001 16.683 59.344
4 .955 15.922 75.266
5 .780 13.003 88.269
Fig. 3.1 Graphical representation of associations between variables and factors
4. Conclusions
This article highlights the utility of applying the multivariate analysis methods in the bricolage market, with the ultimate goal of identifying the factors that influence in significant way the consumer behavior in respect to bricolage products in the current context of globalization and accelerated development. The marketing environment is very complex because of the very nature of the business in the bricolage centers is extremely complex. Bricolage consumer behavior is very dynamic, constantly changing, for this reason it requires constant research.
The multivariate statistical methods of analysis, depending on the relationships which may exist between the variable or dependent variables and independent variables can be grouped into two broad categories: analytical dependencies method (explanatory methods) and methods for analyzing interdependencies (descriptive methods). The analysis method of dependencies explains or provides the evolution of one or more dependent variables based on three or more independent variables.
magazines and other sources. Education and age have a significant influence on the image of Dedeman products, which leads us to the conclusion that education significantly influences how the products are perceived.
5. References
Catoiu I., 2007. Cercetări de marketing. Bucureşti: Ed. Uranus, pp.511-540.
Constantin, C., 2012. Analiza datelor de marketing. Aplicatii in SPSS. Bucureşti: Ed. CH Beck, pp. 200-230.
Duguleană, C. and Duguleană, L., 2015. Energy efficiency and performance indicators of European electricity market. Bulletin of the „Transilvania”
University of Braşov, Vol. 8(57), Series V, No. 1, pp.195-206. Available at:
http://webbut.unitbv.ro/Bulletin/Series%20V/BULETIN%20I%20PDF/23_Du guleana_C.pdf [Accessed 02 October 2016]
Duguleană L. and Duguleană, C., 2015. Analyzing and forecasting the European social climate. Bulletin of the „Transilvania” University of Braşov, Vol. 8(57), Series V, No. 1, pp. 207-224. Available at: http://webbut.unitbv.ro/ Bulletin/Series%20V/BULETIN%20I%20PDF/24_Duguleana_L.pdf
[Accessed 03 October 2016]
Duguleană L., 2006. Some Aspects of Measuring the Socio-Economic Changes in the New Economy. Bulletin of the „Transilvania” University of Braşov, Vol. 13(48), Seria B, pp.303-311, ISSN 1223-964X. Available at: http://but.unitbv.ro/BU2008/Arhiva/BU2006/BULETIN%20B%20PDF/048-B-DUGULEANA%20L.pdf [Accessed 02 October 2016]
Duguleană, L. and Petcu, N., 2005. Metode cantitative in analiza datelor. Ed.Infomarket, pp.72-79.
Macovei I., 2014. Modelarea prin ecuatii structurale in cercetarea de marketing: Aplicatie practica. Ed. Universala, pp. 140-150.
Marques de Sá, J. P., 2007. Applied Statistics Using SPSS STATISTICA, MATLAB and R. Berlin, Heidelberg, New York: Editura Springer.
Petcu, N., 2010. Tehnici de data mining rezolvate în SPSS Clementine. Cluj Napoca: Ed. Albastră, p. 56.
Polgar, K. and Duguleana, L., 2015. Importance of rural areas and the regional profilesof EU member states. Bulletin of the “Transilvania” University of
Braşov, Vol. 8(57), Series V, No. 2. Available at: