HESSD
12, 1599–1631, 2015Groundwater flow processes and mixing in active volcanic systems
A. Hernández-Antonio et al.
Title Page
Abstract Introduction
Conclusions References
Tables Figures
◭ ◮
◭ ◮
Back Close
Full Screen / Esc
Printer-friendly Version
Interactive Discussion
Discussion
P
a
per
|
Discussion
P
a
per
|
Discussion
P
a
per
|
Discussion
P
a
per
|
Hydrol. Earth Syst. Sci. Discuss., 12, 1599–1631, 2015 www.hydrol-earth-syst-sci-discuss.net/12/1599/2015/ doi:10.5194/hessd-12-1599-2015
© Author(s) 2015. CC Attribution 3.0 License.
This discussion paper is/has been under review for the journal Hydrology and Earth System Sciences (HESS). Please refer to the corresponding final paper in HESS if available.
Groundwater flow processes and mixing
in active volcanic systems: the case of
Guadalajara (Mexico)
A. Hernández-Antonio1, J. Mahlknecht1, C. Tamez-Meléndez1, J. Ramos-Leal2, A. Ramírez-Orozco1, R. Parra1, N. Ornelas-Soto1, and C. J. Eastoe3
1
Centro del Agua para América Latina y el Caribe, Tecnológico de Monterrey, Monterrey, Mexico
2
División de Geociencias Aplicadas, Instituto Potosino de Investigación Científica y Tecnológica, San Luis Potosi, Mexico
3
Department of Geosciences, University of Arizona, Tucson, USA
Received: 31 December 2014 – Accepted: 20 January 2015 – Published: 3 February 2015
Correspondence to: J. Mahlknecht ([email protected])
HESSD
12, 1599–1631, 2015Groundwater flow processes and mixing in active volcanic systems
A. Hernández-Antonio et al.
Title Page
Abstract Introduction
Conclusions References
Tables Figures
◭ ◮
◭ ◮
Back Close
Full Screen / Esc
Printer-friendly Version
Interactive Discussion
Discussion
P
a
per
|
Discussion
P
a
per
|
Discussion
P
a
per
|
Discussion
P
a
per
|
Abstract
Groundwater chemistry and isotopic data from 40 production wells in the Atemajac and Toluquilla Valleys, located in and around the Guadalajara metropolitan area, were determined to develop a conceptual model of groundwater flow processes and mixing. Multivariate analysis including cluster analysis and principal component analysis were
5
used to elucidate distribution patterns of constituents and factors controlling ground-water chemistry. Based on this analysis, groundground-water was classified into four groups: cold groundwater, hydrothermal water, polluted groundwater and mixed groundwater. Cold groundwater is characterized by low temperature, salinity, and Cl and Na concen-trations and is predominantly of Na-HCO3type. It originates as recharge at Primavera
10
caldera and is found predominantly in wells in the upper Atemajac Valley. Hydrothermal water is characterized by high salinity, temperature, Cl, Na, HCO3, and the presence
of minor elements such as Li, Mn and F. It is a mixed HCO3 type found in wells from Toluquilla Valley and represents regional flow circulation through basaltic and andesitic rocks. Polluted groundwater is characterized by elevated nitrate and sulfate
concen-15
trations and is usually derived from urban water cycling and subordinately from agri-cultural practices. Mixed groundwaters between cold and hydrothermal components are predominantly found in the lower Atemajac Valley. Tritium method elucidated that practically all of the sampled groundwater contains at least a small fraction of modern water. The multivariate mixing model M3 indicates that the proportion of hydrothermal
20
HESSD
12, 1599–1631, 2015Groundwater flow processes and mixing in active volcanic systems
A. Hernández-Antonio et al.
Title Page
Abstract Introduction
Conclusions References
Tables Figures
◭ ◮
◭ ◮
Back Close
Full Screen / Esc
Printer-friendly Version
Interactive Discussion
Discussion
P
a
per
|
Discussion
P
a
per
|
Discussion
P
a
per
|
Discussion
P
a
per
|
1 Introduction
Active volcanic systems are frequently accompanied by an intense hydrothermal circu-lation, which is controlled by the exchange of mass and energy between groundwater systems, magmatic fluids and hot rock (Di Napoli et al., 2009; Goffand Janik, 2000). The characterization of such hydrothermal systems helps on the one hand to
quan-5
tify its geothermal energy potential and, on the other hand, to assess volcanic-related risks (Di Napoli et al., 2011). Hot springs, mud deposits, fumaroles, vaporization and degassing soils give initial clues about subsurface hydrothermal conditions (Hockstein and Browne, 2000; Navarro et al., 2011). The chemical characterization of fluids and groundwater has been used as an indicator of the subsurface structure and the
ori-10
gin of released fluids when hydrogeological information is scarce (Appelo and Postma, 2005; Henley and Ellis, 1983). Hydrochemical data, such as high electrical conductiv-ity (EC), high temperatures and elevated concentrations of As, B, Br, Cl, Cs, F, Fe, Ge, I, Li, Mn, Mo, Na, Rb, Sb, Ta, U and W denote the presence of hydrothermal fluids in groundwater (Aksoy et al., 2009; Dogdu and Bayari, 2005; Reimann et al., 2003).
15
However, hydrothermal volcanic systems are sometimes difficult to analyse due to the fact that groundwater is a mixture of fluids from various sources, sometimes consisting of shallow meteoric waters from recent infiltration, seawater and hydrothermal water rising from deep hydrothermal reservoirs (Chiodini et al., 2001; Di Napoli et al., 2009; Evans et al., 2002).
20
The combination of different environmental tracer techniques helps elucidate the groundwater’s origin, recharge, flow velocity and direction, residence or travel times, connections between aquifers, and surface and groundwater interrelations (Ako et al., 2013; Appello and Postma, 2005; De Vries and Simmers, 2002; Edmunds and Smed-ley, 2000; Stumpp et al., 2014). These techniques have been applied in large semiarid
25
HESSD
12, 1599–1631, 2015Groundwater flow processes and mixing in active volcanic systems
A. Hernández-Antonio et al.
Title Page
Abstract Introduction
Conclusions References
Tables Figures
◭ ◮
◭ ◮
Back Close
Full Screen / Esc
Printer-friendly Version
Interactive Discussion
Discussion
P
a
per
|
Discussion
P
a
per
|
Discussion
P
a
per
|
Discussion
P
a
per
|
and residence times, especially in fractured rock aquifers. Radioactive tracers like tri-tium (3H) are relatively inexpensive methods to estimate groundwater ages and char-acterize groundwater flow systems. Relatively few studies attempt to quantify mixing between different hydrothermal and cold fluids (Forrest et al., 2013).
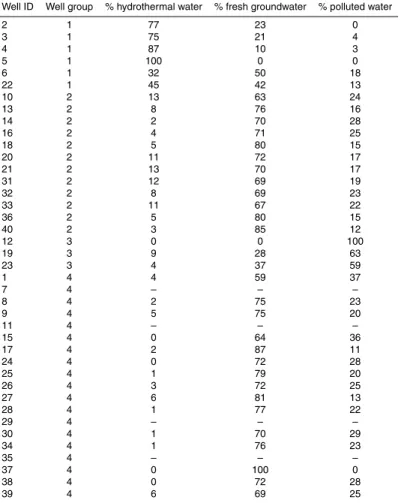
This study was carried out in the Atemajac–Toluquilla aquifer system (ATAS) which
5
underlies the metropolitan area of Guadalajara (∼4.6 million inhabitants) and is located in a complex neotectonic active volcanic system in the Tepic–Zacoalco Rift. Adjacent to this aquifer system is the “La Primavera” caldera. Several survey wells have been drilled up to 3 km deep at La Primavera to explore the potential for geothermal en-ergy (CFE, 2000). Temperatures between 80 and 300◦C have been registered in these
10
wells (Verma et al., 2012), and temperatures higher than 40◦C have been measured in
adjacent springs (Sánchez-Díaz, 2007). The hydrothermal fluids and springs are char-acterized by high concentrations of Na, Cl, SiO2, HCO3, B, F, and TDS. A mixture of
hydrothermal fluids and meteoric-derived water has been identified in the springs of “La Primavera” (Sánchez-Díaz, 2007). While it is assumed that this caldera influences
15
the aquifer system below the metropolitan area, the proportion of hydrothermal fluids and cold water is not clear. The diversity of the chemical results from previous studies has contributed to the difficulty in clearly evaluating the relationship between the fluids (see Results and Discussion section).
This study aims to understand the flow dynamics of groundwater by using the
com-20
bination of statistical and geochemical methods. Water groups and factors that control the groundwater chemical processes were identified using a cluster and principal com-ponent analysis. Environmental tracers were used to assess chemical evolution. Mixing proportions of selected fluids in public wells were quantified by means of a multivariate mixing calculation. This study is the first of its kind to report a comprehensive
under-25
HESSD
12, 1599–1631, 2015Groundwater flow processes and mixing in active volcanic systems
A. Hernández-Antonio et al.
Title Page
Abstract Introduction
Conclusions References
Tables Figures
◭ ◮
◭ ◮
Back Close
Full Screen / Esc
Printer-friendly Version
Interactive Discussion
Discussion
P
a
per
|
Discussion
P
a
per
|
Discussion
P
a
per
|
Discussion
P
a
per
|
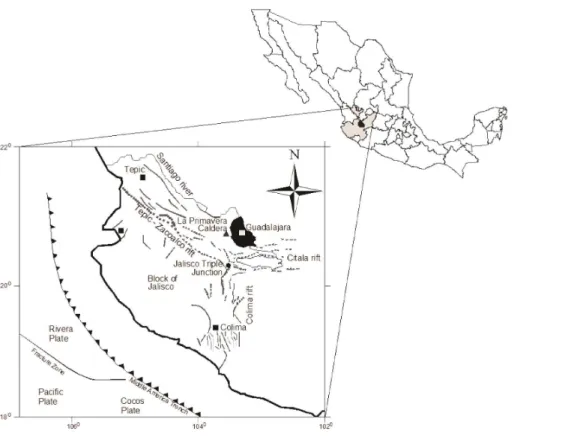
2 Study area
The study area is situated in the central portion of the state of Jalisco (Fig. 1). It belongs to the Lerma–Santiago river system, which drains into the Pacific Ocean. The climate in the study area is semi-warm to sub-humid. The National Water Commission reports an average annual temperature of 20.9◦
C and an average annual precipitation of 904 mm,
5
occurring mostly between May and October. The potential evaporation is on the order of 2000 mm (CONAGUA, 2010).
2.1 Hydrogeological settings
The study area is located in the western portion of the Mexican Volcanic Belt (MVB), a 1000 km-long volcanic arc that crosses central Mexico in E–W direction from the
10
Pacific to the Atlantic Ocean. The MVB originated in the Late Miocene in response to the subduction of the Cocos and Rivera plates below the North American plate along the Middle America Trench. The belt has a composition of intermediate to sili-cic rocks (Alva-Valdivia et al., 2000). The western end of the MVB defines the fault-bounded crustal Jalisco Block (Ferrari et al., 2007; Valencia et al., 2013). The northern
15
and eastern boundaries of this block consist of asymmetric continental rifts formed by tilted blocks with escarpments between 800 and 1000 m (Zárate-del Valle and Si-moneit, 2005); the Tepic–Zacoalco Rift to the north runs in an NW–SE direction, and the Colima Rift to the east runs in an N–S direction; these rifts join the E–W oriented Citala or Chapala Rift in what is known as the Jalisco Triple Junction located 60 km
20
SSW of the city of Guadalajara (Fig. 1). This area is a complex and active neotectonic structure that controls and regulates the development of the rift-floor, limited by normal faults (Michaud et al., 2000; Zárate-del Valle and Simoneit, 2005). The Atemajac and Toluquilla Valleys are located in the lower Tepic–Zacoalco Rift and are bordered by hills, volcanic cones (El Cuatro, San Martín), plateaus (Tonalá) and volcanic calderas
25
HESSD
12, 1599–1631, 2015Groundwater flow processes and mixing in active volcanic systems
A. Hernández-Antonio et al.
Title Page
Abstract Introduction
Conclusions References
Tables Figures
◭ ◮
◭ ◮
Back Close
Full Screen / Esc
Printer-friendly Version
Interactive Discussion
Discussion
P
a
per
|
Discussion
P
a
per
|
Discussion
P
a
per
|
Discussion
P
a
per
|
These valleys consist of a relatively thin cover of Quaternary lacustrine deposits overlying a thick section of Neogene volcanic rocks including silicic domes, lava and cinder cones, lithic tuffs (Tala tuff), basalts, ignimbrites and other pyroclastic rocks, andesites and volcanic breccia, and a basement consisting of Oligocene granite (Campos-Enríquez et al., 2005; Gutiérrez-Negrín, 1988; Urrutia et al., 2000). The
prin-5
cipal aquifer, termed the Upper Aquifer unit, consists of the alluvium and underlying Neogene rocks. It is up to 700 m thick, and water is extracted from depths of up to 300 m below the surface (Sánchez-Diaz, 2007).
The water in the alluvial deposits and volcanic rocks in the upper aquifer unit is unconfined to semi-confined and moves under a natural hydraulic gradient that reflects
10
the topography. In the Atemajac Valley, groundwater recharges in the normal fault NE from the La Primavera caldera from rainfall infiltration and flows in an SW–NE direction, while the flow in Toluquilla Valley starts in El Colli and moves in NW–SE direction (Figs. 1 and 2).
2.2 Hydrothermal system
15
The La Primavera caldera, with a diameter of∼10 km, borders the study area to the west. It is a very young (Late Pleistocene) volcanic complex underlain by a magma chamber whose top reaches a depth of 4 km (Verma et al., 2012). Drilling has re-vealed that the oldest units consist of granitic and granodioritic rocks found mainly at a depth of approximately 3000 m. These rocks are mainly overlain by andesitic rocks
20
approximately 1150 m thick. The third lithologic unit, which is approximately 100 m thick, consists of rhyolites. The uppermost unit is a sequence of lithic tuffs and mi-nor andesite with an average thickness of approximately 750 and 1000 m, respec-tively (Campos-Enríquez et al., 2005; Urrutia et al., 2000; Verma et al., 2012). The system is characterized by an asymmetric structure with NW–SE regional basalt
lin-25
HESSD
12, 1599–1631, 2015Groundwater flow processes and mixing in active volcanic systems
A. Hernández-Antonio et al.
Title Page
Abstract Introduction
Conclusions References
Tables Figures
◭ ◮
◭ ◮
Back Close
Full Screen / Esc
Printer-friendly Version
Interactive Discussion
Discussion
P
a
per
|
Discussion
P
a
per
|
Discussion
P
a
per
|
Discussion
P
a
per
|
measured at the bottom of exploratory wells that were drilled up to 3 km deep, vary from 80 to 300◦
C (Verma et al., 2012). It appears that heated meteoric water as-cends along fault or fracture zones to near surface depths and supplies springs with temperatures of >40◦C (Venegas et al., 1985). The hydrothermal fluids are
charac-terized by very high concentrations of Na (679–810 mg L−1
), Cl (865–1100 mg L−1
),
5
SiO2 (943–1320 mg L− 1
), B (75–150 mg L−1) and TDS (2810–4065 mg L−1)
(Maciel-Flores and Rosas-Elguera,1992), while the springs are of Na-Cl-HCO3 type with rel-atively high concentrations of Na (260–331 mg L−1
), Cl (85–185 mg L−1
), SiO2 (209–
253 mg L−1), HCO
3 (395–508 mg L− 1
), B (10.8–12.3 mg L−1), F (8.5 mg L−1) and TDS
(1071–1240 mg L−1), indicating a mixture between hydrothermal fluids and local
rain-10
water origin with ratios of 1 : 2 to 1 : 10 (Gutiérrez-Negrín, 1988; Sánchez-Diaz, 2007).
3 Methods
3.1 Field and laboratory
Water samples were collected from 40 production wells in March 2011 using stan-dard protocols. The samples were analyzed for major and minor ions, trace elements
15
and isotopes (δ2H, δ18O, 3H). Field parameters such as temperature, pH, electrical
conductivity (EC), and dissolved oxygen (DO), were measured using portable meters (Thermo, Orion). Alkalinity was determined in the field by volumetric titration (0.02 N H2SO4) of filtered water samples to pH 4.3. At each sampling site, new and pre-rinsed
low density polyethylene bottles were filled with filtered (0.45 µm) sample water. Cation
20
and silica samples were acidified with ultrapure HCl to pH<2, and all of the
sam-ples were stored in the laboratory at a constant temperature of 4◦
C. Dissolved cations and anions were determined by inductive-coupled plasma mass spectrometry (ICP-MS) and ion chromatography, respectively. Duplicates of selected samples were an-alyzed using inductive-coupled plasma optical emission spectrometry (ICP-OES) and
25
HESSD
12, 1599–1631, 2015Groundwater flow processes and mixing in active volcanic systems
A. Hernández-Antonio et al.
Title Page
Abstract Introduction
Conclusions References
Tables Figures
◭ ◮
◭ ◮
Back Close
Full Screen / Esc
Printer-friendly Version
Interactive Discussion
Discussion
P
a
per
|
Discussion
P
a
per
|
Discussion
P
a
per
|
Discussion
P
a
per
|
Water isotopes were analyzed at EIL, University of Waterloo, Canada. To conduct deuterium (2H) analyses, sample water was reduced on hot manganese (512◦
C) and the released hydrogen was analyzed by GC-MS. To conduct oxygen-18 (18O) analy-ses, water was equilibrated with CO2. Preparation and extraction took place on a fully automated system vessel attached to a VG MM 903 mass spectrometer. The2H and
5 18
O results are reported asδ-values with respect to the VSMOW (Vienna Standard
Mean Ocean Water) standard. The samples were analyzed for tritium (3H) by a liquid scintillation counter after electrolytic enrichment.
3.2 Interpretation
A preliminary description of water chemistry and identification of possible processes
10
was performed using a correlation analysis. A hierarchical cluster analysis (HCA) or-ganized samples into classified groups which were evaluated according to their geo-graphic correspondence. A principal component analysis (PCA) elucidated the main controls on groundwater chemistry. All of the statistical calculations were performed using Minitab version 17.1 (Minitab, 2013).
15
The multivariate mixing and mass balance model, or M3 (Laaksoharju et al., 2008), was used to help to understand groundwater composition. The main aim of M3 is to differentiate between what is due to mixing and what is due to water-rock reactions. The M3 method compares the measured groundwater composition of each sample to the selected reference water and reports the changes in terms of mixing and
reac-20
tions. A PCA is used to summarize the groundwater data by using the majority of the dissolved groundwater constituents Ca, Na, Mg, K, Cl, SO4 and HCO3in combination
with the isotopesδ2H, δ18O and3H. The outcome of the analyses can be visualized
as a scatter plot (PCA plot) for the first two principal components. The observations inside the polygon of the PCA plot are compared to the previously chosen reference
25
HESSD
12, 1599–1631, 2015Groundwater flow processes and mixing in active volcanic systems
A. Hernández-Antonio et al.
Title Page
Abstract Introduction
Conclusions References
Tables Figures
◭ ◮
◭ ◮
Back Close
Full Screen / Esc
Printer-friendly Version
Interactive Discussion
Discussion
P
a
per
|
Discussion
P
a
per
|
Discussion
P
a
per
|
Discussion
P
a
per
|
study, the following sample compositions were used as reference waters: AT5 – highest temperature and salinity as the reference for hydrothermal fluids; AT12 – low temper-ature and elevated salinity as the reference for polluted or anthropogenically impacted water; and AT37 – low temperature and salinity as the reference for local groundwater. Although none of these selected reference waters are considered end members, they
5
were selected as most representative for the purpose of the present study to determine the amounts of each mixture.
4 Results and discussion
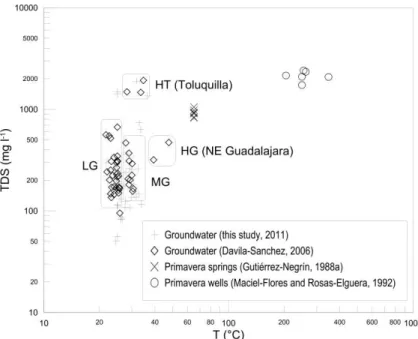
Sánchez-Diaz (2007) used groundwater temperature and total dissolved solids as crite-ria to classify wells in hydrothermal water from Toluquilla (HT), hydrothermal water from
10
springs NE of Guadalajara (HG), non-hydrothermal, local groundwater (LG), and mixed groundwater (MG) with both HT and LG (Fig. 3). Considering different sets of historical and new data, this classification is too subjective, especially in the lower TDS range. Furthermore, some inconsistencies between correlation results from different sampling campaigns show that the interpretation is not straightforward. The Mg concentration,
15
for example, decreases with increasing temperature as expected from hydrothermal fluids (Panichi and Gonfiantini, 1981); on the other hand, an increasing Mg trend at low temperatures is observed indicating saline groundwater. Finally, it was not clear if there are different sources of hydrothermal or saline waters that affect the local groundwater. These complications motivated us to use multivariate techniques instead of commonly
20
HESSD
12, 1599–1631, 2015Groundwater flow processes and mixing in active volcanic systems
A. Hernández-Antonio et al.
Title Page
Abstract Introduction
Conclusions References
Tables Figures
◭ ◮
◭ ◮
Back Close
Full Screen / Esc
Printer-friendly Version
Interactive Discussion
Discussion
P
a
per
|
Discussion
P
a
per
|
Discussion
P
a
per
|
Discussion
P
a
per
|
4.1 Multivariate statistics
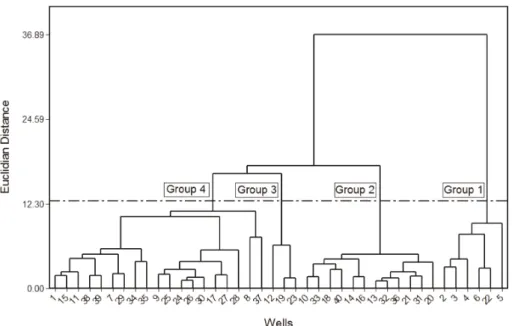
Table 1 shows the concentrations of measured groundwater elements, field parameters and isotopic ratios, along with the hydrochemical classification.
The classification of waters was performed with HCA using 20 variables (pH, tem-perature, EC, DO, Na, K, Ca, Mg, Cl, HCO3, SO4, NO3-N, Sr, SiO2, Fe, F, Zn,
3
H,
5
2
H,18O). With the help of Ward’s linkage rule iteratively neighboring points (samples) were linked through a similarity matrix (Ward, 1963). The squared Euclidian distance was selected as the similarity measurement. The second method was a PCA. For both cluster algorithms, lognormal distributed data were previously log-transformed, and all of the variables standardized (z-scores). The HCA samples were classified into 4 major
10
groups as represented by the dendrogram in Fig. 4 and median values (Table 2). The values for Li, Mn and Ba were not considered in the cluster analysis, because most samples had concentrations below the detection limit.
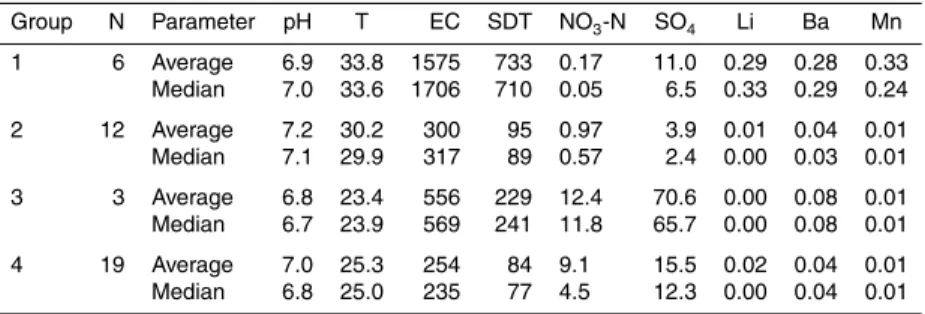
Group 1 (n=6) had the highest temperatures (average 33.8◦C), high salinity (EC
=
1575 µS cm−1), and low NO
3-N (0.17 mg L− 1
) and 3H (0.73 TU) values, along with
15
traces of Li, Mn and Ba that were possibly due to geothermal influence. These waters were of mixed HCO3 type, as shown in the Piper diagram (Fig. 5), and located in the
central area of Toluquilla. Group 2 (n=12) had slightly lower temperatures (30.2◦C),
with considerably lower salinity (300 µS cm−1) and3H activity similar to that of group 1.
Chloride concentrations are low (3.5 mg L−1
) compared to the other groups. Wells from
20
group 2 were found mainly in the eastern and southern region of the study area. These waters were of Na-HCO3to mixed HCO3type. The smallest group 3 (n=3) represents
the coldest waters (23.4◦C), that had variable salinity (EC
=556 µS cm−1), and the
highest SO4(70.6 mg L− 1
), NO3-N (12.4 mg L− 1
),3H (2.1 TU) values, and relatively ele-vated Na (52.2 mg L−1) and Cl (38.9 mg L−1) concentrations. These waters were a
mix-25
ture of Na-SO4to mixed HCO3type, located in urban and agricultural areas, possibly
indicating anthropogenic pollution. Finally, group 4 (n=19) was cold (25.3◦C), similar
to group 3, with low salinity (254 µS cm−1), and elevated NO
3-N (9.1 mg L− 1
HESSD
12, 1599–1631, 2015Groundwater flow processes and mixing in active volcanic systems
A. Hernández-Antonio et al.
Title Page
Abstract Introduction
Conclusions References
Tables Figures
◭ ◮
◭ ◮
Back Close
Full Screen / Esc
Printer-friendly Version
Interactive Discussion
Discussion
P
a
per
|
Discussion
P
a
per
|
Discussion
P
a
per
|
Discussion
P
a
per
|
(15.5 mg L−1) values. These predominantly Na-HCO
3 to mixed HCO3 type waters are
located in the western portion of the aquifer system in areas of elevated altitude where most of the recharge takes place. Figure 5 shows that groups 3 and 4 are relatively similar compared to the other two groups.
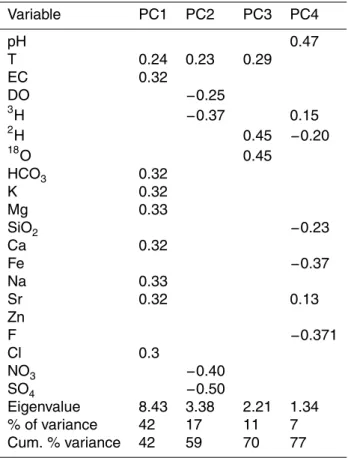
A factor analysis transformed the 20 variables into a reduced number of factors.
5
The PCA, which loads most of the total variance onto one factor, was used in this study. The factors were extracted through the principal components method. Varimax rotation, where one factor explains mostly one variable, was selected. For fixing the maximum number of factors to be extracted, only factors with eigenvalues higher than one were taken into consideration (Kaiser normalization).
10
Table 3 shows that 4 factors may explain 77 % of the variance. Factor 1 (42 % of the variance) largely represents high salinity. The correlations of temperature, Na and Cl indicate hydrothermal influence, while HCO3, Na and Sr could be connected to
miner-alization and rock dissolution processes, and cationic exchange. In factor 2 (17 %) the temperature is inversely related with DO,3H, and to a lesser degree, NO3 and SO4,
15
suggesting that this factor represents water affected by human activities, either urban or agricultural. In addition, Table 1 shows that waters affected by human activities are most evaporated. Sulfate could be related to contamination due to the infiltration of commonly applied sulfate-based fertilizers during the rainy season. This occurs be-cause all the wells are undersaturated with regard to gypsum, indicating that the water
20
does not move through deposits of this mineral. In factor 3 (11 %) the relationship be-tween 2H and 18O reveals the existence of recharge water. This factor is generated almost entirely by the linear relationship between O and H isotopes. The relation with temperature indicates the recharge conditions at different recharge sites. Factor 4 (7 %) may be indicative of dissolution of minerals that contain F. The study of Sánchez-Díaz
25
HESSD
12, 1599–1631, 2015Groundwater flow processes and mixing in active volcanic systems
A. Hernández-Antonio et al.
Title Page
Abstract Introduction
Conclusions References
Tables Figures
◭ ◮
◭ ◮
Back Close
Full Screen / Esc
Printer-friendly Version
Interactive Discussion
Discussion
P
a
per
|
Discussion
P
a
per
|
Discussion
P
a
per
|
Discussion
P
a
per
|
4.2 Isotope hydrology
The δ2H vs. δ18O graph shows that the analyzed groundwater is of meteoric origin
with variable evaporation and hydrothermal effects (Fig. 6a and b). Group 1 (hydrother-mal influenced) waters, collected in Toluquilla, have a narrow range ofδ18O (−9.4 to −8.8 ‰) and δ2H (−67 to−68 ‰) values. They tend to fall slighly below and parallel
5
to the RMWL, possibly indicating different climate conditions during recharge. The in-creased Cl concentrations compared to other groups evidences mixture with hydrother-mal fluids (Fig. 6b). Group 2 waters, collected in the eastern and southern part of the ATAS, have δ18O values ranging from −9.6 to −8.6 ‰, and δ2H values from −63 to
−71 ‰. These waters fall along the regional meteoric water line. Group 3 waters
(in-10
fluenced by anthropogenic pollution) are quite different from the rest; they haveδ18O
values ranging from −7.9 to −5.7 ‰, and δ2H values from −59.6 to −47.5 ‰, and are stronlgy affected by evaporation (Fig. 6b). The enriched outlier AT12 represents groundwater from a recreational park with lagoons. Group 4 waters, mostly from La Primavera recharge area, are covering a relative wide range of values compared to
15
group 1 and 2. Theirδ18O signatures vary from−10.3 to−8.4 ‰, and theirδ2H
sig-natures from −72.2 to −63.9 ‰. The overlapping of group 1, 2 and 4 indicates that aquifer formations are mostly hydraulically interconnected. Although altitude variations are in the order of only 400 m around La Primavera Caldera, this seems to be enough to generate an altitude effect (Fig. 6c).
20
Tritium results indicate that groundwater within the study area includes both pre-modern (pre-1950s) and pre-modern recharge. The values range from 0.3 to 3.0 TU which indicates a contribution from modern water in every sampled site (Table 1). The majority of waters with3H lower than 1.0 TU are in the southern portion of the aquifer system.
4.3 Mixing patterns with M3
25
HESSD
12, 1599–1631, 2015Groundwater flow processes and mixing in active volcanic systems
A. Hernández-Antonio et al.
Title Page
Abstract Introduction
Conclusions References
Tables Figures
◭ ◮
◭ ◮
Back Close
Full Screen / Esc
Printer-friendly Version
Interactive Discussion
Discussion
P
a
per
|
Discussion
P
a
per
|
Discussion
P
a
per
|
Discussion
P
a
per
|
The calculation results indicate that the proportion of hydrothermal fluids within group 1 wells is between 32 and 87 % (Fig. 7, Table 4), while the proportion is lower than 13 % within the other three groups. On the other hand, anthropogenically impacted waters within group 3 show proportions between 59 and 63 %, while all of the other groups are lower than 36 %. These results validate the initial selection of groups based on
5
cluster analysis. Geographically, groundwater with elevated hydrothermal proportions is located in the south to southeastern area (Toluquilla), and elevated proportions of polluted groundwater are located mostly in the urbanized area of Guadalajara. Sam-ples AT7, AT11, AT29, AT35 and AT38 lie outside the polygon in Fig. 7 and have thus been excluded from evaluation. However, note that they represent local groundwaters
10
and indicate that the selected reference waters are only an approximation of unknown end members, so the polygon may not include all of the samples.
4.4 Groundwater flow system of Guadalajara
The hydrogeological Atemajac–Toluquilla system is located in the northeastern area of the Tepic–Zacoalco Rift, a complex and active neotectonic structure. Local
ground-15
water recharge for Atemajac–Toluquilla Valley originates from rainfall mainly over the La Primavera caldera in the central western portion of the study unit. It flows in the upper alluvial sediments towards the valley floor and Santiago River. It is character-ized by low temperature, and SDT, Cl and Na concentrations, and is of predominantly Na-HCO3type. This kind of groundwater predominates in the western Atemajac Valley. 20
Underground heat flow suggests the existence of a magma chamber below the La Primavera caldera, which provides hydrothermal fluids observed on surface ex-pressions such as the La Soledad solfatara and the Cerritos Colorados geothermal field. These emerging fluids circulate towards the deeper Atemajac–Toluquilla aquifer unit specifically below Santa Anita and Toluquilla. Calcedonia geothermometers
indi-25
cir-HESSD
12, 1599–1631, 2015Groundwater flow processes and mixing in active volcanic systems
A. Hernández-Antonio et al.
Title Page
Abstract Introduction
Conclusions References
Tables Figures
◭ ◮
◭ ◮
Back Close
Full Screen / Esc
Printer-friendly Version
Interactive Discussion
Discussion
P
a
per
|
Discussion
P
a
per
|
Discussion
P
a
per
|
Discussion
P
a
per
|
culation through fault zones and an active volcanic center, and water-rock interactions. These waters are of mixed HCO3 type. They are representative of the southwestern
portion (Toluquilla Valley).
Polluted waters infiltrate mainly from urban water cycling and, to a minor degree, from agricultural plots. This waters are characterized by low temperature, variable salinity,
5
high concentrations of nitrate and sulfate and, elevated concentrations of chloride and sodium, and are of Na-SO4to mixed HCO3type.
The isotopic composition of groundwater indicates interconnectivity between water from deeper and shallow rock materials. Practically all groundwater sampled contains at least a small fraction of modern water. The proportions of hydrothermal fluids in
10
sampled well waters ranged from 13 (cold groundwater) to 87 % (hydrothermal water), while the proportion of polluted water is between 0 and 63 %. Figure 8 shows two schematic flow sections of Atemajac and Toluquilla valley.
5 Conclusions
This work represents the first time that groundwater flow dynamics of Guadalajara
re-15
gion have been analyzed and characterized by using a suite of statistical and geochem-ical methods. Geochemgeochem-ical methods have been combined with multivariate statistgeochem-ical analysis and the multivariate mixing and mass-balance model (M3) to determine the mixing patterns of different fluids when considering fresh groundwater, hydrothermal fluids and human impacted waters.
20
The initial classification of groundwater groups by cluster analysis has been con-firmed by water isotopic technologies, and identifying the controlling factors by prin-ciple component analysis is consistent with M3 modeling. The origin of groundwater recharge and the mixture of fresh groundwater with hydrothermal fluids and polluted water components was identified. A conceptual flow model was constructed for the
25
HESSD
12, 1599–1631, 2015Groundwater flow processes and mixing in active volcanic systems
A. Hernández-Antonio et al.
Title Page
Abstract Introduction
Conclusions References
Tables Figures
◭ ◮
◭ ◮
Back Close
Full Screen / Esc
Printer-friendly Version
Interactive Discussion
Discussion
P
a
per
|
Discussion
P
a
per
|
Discussion
P
a
per
|
Discussion
P
a
per
|
recharge outside the study area and upward vertical flow in the La Primavera caldera and the valley of Toluquilla. TDS, Cl, Na, Mn and Li, are most indicative of hydrothermal fluids. Modern water polluted with SO4 and NO3 can be associated with urban
devel-opment and agricultural practices. The proportion of hydrothermal fluids within older waters is between 32 and 87 %, whereas it is lower than 13 % within other waters.
5
These outcomes may help water authorities to identify wells with hydrothermal mix-ture or polluted water and act accordingly. The information regarding the proportions of fresh groundwater, hydrothermal fluids and polluted waters in each well indicates that the contaminants can be attributed to source waters. For example, Li, Mn, Ba, F and As can be associated with hydrothermal fluids, and SO4 and NO3 are related to the
10
production or use of fertilizers, dyes, glass, paper, soaps, textiles, fungicides or insecti-cides. This result helps authorities to decide whether certain wells have to be isolated or closed in order to provide Guadalajara with the required drinking water quality.
M3 is a powerful tool to evaluate the mixing proportions of selected reference waters present in aquifers. We recommend the use of the suite of traditional methods,
environ-15
mental tracers, statistical analysis and M3 modeling in other aquifers with potentially multiple groundwater origins, especially in active volcanic systems.
Acknowledgements. The authors thank Fundación FEMSA and the Chair for Sustainable Wa-ter Use (Tecnológico de MonWa-terrey) for the financial support given to develop this investigation.
References
20
Ako, A. A., Eyong, G. E. T., Shimada, J., Koike, K., Hosono, T., Ichiyanagi, K., Akoachere, R., Tandia, B. K., Nkeng, G. E., and Ntankouo, N. R.: Nitrate contamination of groundwater in two areas of the Cameroon Volcanic Line (Banana Plain and Mount Cameroon area), Appl. Water Sci., 4, 99–113, 2013.
Aksoy, N., Simsek, C., and Gunduz, O.: Groundwater contamination mechanism in a
geother-25
mal field: a case study of Balcova, Turkey, J. Contam. Hydrol., 103, 13–28, 2009.
HESSD
12, 1599–1631, 2015Groundwater flow processes and mixing in active volcanic systems
A. Hernández-Antonio et al.
Title Page
Abstract Introduction
Conclusions References
Tables Figures
◭ ◮
◭ ◮
Back Close
Full Screen / Esc
Printer-friendly Version
Interactive Discussion
Discussion
P
a
per
|
Discussion
P
a
per
|
Discussion
P
a
per
|
Discussion
P
a
per
|
Alva-Valdivia, R., Goguitchaichvili, A., Ferrari, L., Rosas-Helguera, J., Urrutia-Fucugauchi, J., and Zambrano-Orozco, J. J.: Paleomagnetic data from the Trans-Mexican Volcanic Belt: im-plications for tectonics and volcanic stratigraphy, Earth Planets Space, 52, 467–478, 2000. APHA: Standard Methods for examination of water and wastewater, 22nd Edn., American
Pub-lic Health Association, Washington, 2012.
5
Appelo, C. A. J. and Postma, D.: Geochemistry, Groundwater and Pollution, 2nd Edn., A. A. Balkema, Leiden, the Netherlands, p. 649, 2005.
Bretzler, A., Osenbrück, K., Gloaguen, R., Ruprecht, J. S., Kebede, S., and Stadler, S.: Ground-water origin and flow dynamics in active rift systems e a multi-isotope approach in the Main Ethiopian Rift, J. Hydrol., 402, 274–289, 2011.
10
Campos-Enríquez, J. O. and Alatorre-Zamora, M. A.: Shallow crustal structure of the junction of the grabens of Chapala, Tepic–Zacoalco and Colima, Mexico, Geofis. Int., 37, 263–282, 1998.
Campos-Enríquez, J. O., Domínguez-Méndez, F., Lozada-Zumaets, M., Morales-Rodríguez, H. F., and Andaverde-Arredondo, J. A.: Application of the Gauss theorem
15
to the study of silicic calderas: the calders of La Primavera, Los Azufres, and Los Humeros (Mexico), J. Volcanol. Geoth. Res., 147, 39–67, 2005.
Chiodini, G., Marini, L., and Russo, M.: Geochemical evidence for the existence of high temper-ature hydrothermal brines at Vesuvio volcano, Italy, Geochim. Cosmochim. Acta, 65, 2129– 2147, 2001.
20
CFE – Comisión Federal de Electricidad: Geotermia, Gerencia de Geotermia, Geotermia, Morelia, 23 pp., 2000.
CONAGUA – Comisión Nacional del Agua: Determinación de la Disponibilidad de Agua en el Acuífero Atemajac–Toluquilla), Estado de Jalisco (Determination of Water Availability in the Atemajac–Toluquilla aquifer, Jalisco state), México, D. F., 2010.
25
De Vries, J. J. and Simmers, I.: Groundwater recharge: an overview of processes and chal-lenges, Hydrogeol. J., 10, 5–17, 2002.
Di Napoli, R., Aiuppa, A., Bellomo, S., Brusca, L., D’Alessandro, W., Gagliano Candela, E., Longo, M., Pecoriano, G., and Valenza, M.: A model for Ischia hydrothermal system: evi-dences from the chemistry of thermal groundwaters, J. Volcanol. Geoth. Res., 186, 133–159,
30
2009.
HESSD
12, 1599–1631, 2015Groundwater flow processes and mixing in active volcanic systems
A. Hernández-Antonio et al.
Title Page
Abstract Introduction
Conclusions References
Tables Figures
◭ ◮
◭ ◮
Back Close
Full Screen / Esc
Printer-friendly Version
Interactive Discussion
Discussion
P
a
per
|
Discussion
P
a
per
|
Discussion
P
a
per
|
Discussion
P
a
per
|
The structure of a hydrothermal system from an integrated geochemical, geophysical and geology approach: the Ischia Island case study, Geochem. Geophy. Geosy., 12, 1–25, 2011. Dogdu, M. S. and Bayari, C. S.: Environmental impact of geothermal fluids on surface water,
groundwater and streambed sediments in the Akarcay Basin, Turkey, Environ. Geol., 47, 325–340, 2005.
5
Edmunds, W. and Smedley, P.: Residence time indicators in groundwater: the East Midlands Triassic sandstone aquifer, Appl. Geochem., 15, 737–752, 2000.
Evans, W. C., Sorey, M. L., Cook, A. C., Kennedy, B. M., Shuster, D. L., Colvard, E. M., White, L. D., and Huebner, M. A.: Tracing and quantifying magmatic carbon discharge in cold groundwaters: lessons learned from Mammoth Mountain, USA, J. Volcanol. Geoth. Res.,
10
114, 291–312, 2002.
Ferrari, L., Valencia-Moreno, M., and Bryan, S.: Magmatism and tectonics of the Sierra Madre Occidental and its relation with the evolution of the western margin of North America, in: Geology of México: Celebrating the Centenary of the Geological Society of México, Special Paper 422, edited by: Alaniz-Álvarez, S. A. and Nieto-Samaniego, A. F., Geol. Soc. Am.,
15
Boulder, CO, 1–39, 2007.
Forrest, M. J., Kulongoski, J. T., Edwards, M. S., Farrar, C. D., Belitz, K., and Norris, R. D.: Hydrothermal contamination of public supply wells in Napa and Sonoma Valleys, California, Appl. Geochem., 33, 25–40, 2013.
Furi, W., Razack, M., Abiye, T. A., Kebede, S., and Legesse, D.: Hydrochemical characterization
20
of complex volcanic aquifers in a continental rifted zone: the Middle Awash Basin, Ethiopia, Hydrogeol. J., 20, 385–400, 2011.
Ghiglieri, G., Pittalis, D., Cerri, G., and Oggiano, G.: Hydrogeology and hydrogeochemistry of an alkaline volcanic area: the NE Mt. Meru slope (East African Rift – Northern Tanzania), Hydrol. Earth Syst. Sci., 16, 529–541, doi:10.5194/hess-16-529-2012, 2012.
25
Goff, F. and Janik, C. J.: Geothermal systems, in: Encyclopedia of Volcanoes, edited by: Sig-urdsson, H., Houghton, B., McNutt, S., Rymer, H., and Stix, J., Academic Press, San Diego, CA, 817–834, 2000.
Gutiérrez-Negrin, L.: La Primavera, Jalisco, Mexico: geothermal field, Transact. Geoth. Res. Council, 12, 161–165, 1988.
30
HESSD
12, 1599–1631, 2015Groundwater flow processes and mixing in active volcanic systems
A. Hernández-Antonio et al.
Title Page
Abstract Introduction
Conclusions References
Tables Figures
◭ ◮
◭ ◮
Back Close
Full Screen / Esc
Printer-friendly Version
Interactive Discussion
Discussion
P
a
per
|
Discussion
P
a
per
|
Discussion
P
a
per
|
Discussion
P
a
per
|
Hockstein, M. P. and Browne, P. R. L.: Surface manifestations of geothermal systems with vol-canic heat sources, in: Encyclopedia of Volcanoes, edited by: Sigurdsson, H., Houghton, B., McNutt, S., Rymer, H., and Stix, J., Academic Press, San Diego, CA, 835–856, 2000. Laaksoharju, M., Smellie, J., Tullborg, E- L., Gimeno, M., Molinero, J., Gurban, I., and
Hall-beck, L.: Hydrogeochemical evaluation and modelling performed within the site investigation
5
programme, Appl. Geochem., 23, 1761–1795, 2008.
Maciel-Flores, R. and Rosas-Elguera, J.: Modelo geológico y evaluación del campo geotérmico La Primavera, Jal., México, Geofis. Int., 31, 359–370, 1992.
Mahlknecht, J., Steinich, B., and Navarro de León, I.: Groundwater chemistry and mass trans-fers in the Independence aquifer, central Mexico, by using multivariate statistics and
mass-10
balance models, Environ. Geol., 45, 781–95, 2004.
Mahlknecht, J., Horst, A., Hernández-Limón, G., and Aravena, R.: Groundwater geochemistry of the Chihuahua City region in the Rio Conchos Basin (northern Mexico) and implications for water resources management, Hydrol. Process., 22, 4736–4751, 2008.
Michaud, F., Gasse, F., Bourgois, J., and Quintero, O.: Tectonic controls on lake distribution in
15
the Jalisco Block area (western Mexico) from Pliocene to Present, in: Cenozoic Tectonics and Volcanism of Mexico, Special paper 334, edited by: Delgado-Granados, H., Aguirre-Díaz, G. J., and Stock, J. M., Geol. Soc. Am., Boulder, CO, 99–110, 2000.
Minitab: Statistical Software (versión 17.1). MINITAB®and all other trademarks and logos for the Company’s products and services are the exclusive property of Minitab Inc. All other
20
marks referenced remain the property of their respective owners, 2013.
Navarro, A., Font, X., and Viladevall, M.: Geochemistry and groundwater contamination in the La Selva geothermal system (Girona, Northeast Spain), Geothermics, 40, 275–285, 2011. Panichi, C. and Gonfiantini, R.: Geothermal waters, in: Stable Isotope Hydrology, edited by:
Gat, J. R. and Gonfiantini, R., IAEA Tech. Rep. Ser., IAEA, Vienna, 241–272, 1981.
25
Panno, S. V., Hackley, K. C., Locke, R. A., Krapac, I. G., Wimmer, B., Iranmanesh, A., and Kelly, W. R.: Formation waters from Cambrian-age strata, Illinois Basin, USA: constraints on their origin and evolution based on halide composition, Geochim. Cosmochim. Acta, 122, 184–197, 2013.
Reimann, C., Bjorvatn, K., Frengstad, B., Melaku, Z., Tekle-Haimanot, R., and Siewers, U.:
30
HESSD
12, 1599–1631, 2015Groundwater flow processes and mixing in active volcanic systems
A. Hernández-Antonio et al.
Title Page
Abstract Introduction
Conclusions References
Tables Figures
◭ ◮
◭ ◮
Back Close
Full Screen / Esc
Printer-friendly Version
Interactive Discussion
Discussion
P
a
per
|
Discussion
P
a
per
|
Discussion
P
a
per
|
Discussion
P
a
per
|
Sánchez-Díaz, L. F.: Origen, transporte, distribución y concentraciones de los fluoruros en el sistema hidrogeológico volcánico Atemajac–Toluquilla, Jalisco, México, PhD thesis, Univer-sidad Nacional Autónoma de México, México, 128 pp., 2007.
Siebert, C., Rosenthal, E., Möller, P., Rödiger, T., and Meiler, M.: The hydrochemical identifi-cation of groundwater flowing to the Bet She’an–Harod multiaquifer system (Lower Jordan
5
Valley) by rare earth elements, yttrium, stable isotopes (H, O) and Tritium, Appl. Geochem., 27, 703–714, 2012.
Stumpp, C., Ekdal, A., Gönenc, I. E., and Maloszewski, P.: Hydrological dynamics of water sources in a Mediterranean lagoon, Hydrol. Earth Syst. Sci., 18, 4825–4837, doi:10.5194/hess-18-4825-2014, 2014.
10
Urrutia, F. J., Alva-Valdivia, L. M., Rosas-Elguera, J., Campos-Enriquez, O. Goguitchaichvili, A., Soler-Arechalde, A. M., Caballero-Miranda, C., Venegas Salgado, S., and Sanchez-Reyes, S.: Magnetostratigraphy of the volcanic sequence of Río Grande de Santiago-Sierra de la Primavera region, Jalisco, western Mexico, Geofis. Int., 39, 247–265, 2000.
Valencia, V. A., Righter, K., Rosas-Elguera, J., Lopez-Martinez, M., and Grove, M.: The age and
15
composition of the pre-Cenozoic basement of the Jalisco Block: implications for and relation to the Guerrero composite terrane, Contrib. Mineral. Petr., 166, 801–824, 2013.
Venegas, S., Herrera, J. J., and Maciel, F. R.: Algunas características de la Faja Volcánica Mexicana y de sus recursos geotérmicos, Geofis. Int., 24, 47–83, 1985.
Verma, S. P., Arredondo-Parra, U. C., Andaverde, J, Gómez-Arias, E., and
Guerrero-20
Martínez, F. J.: Three-dimensional temperature field simulation of a cooling of a magma chamber, La Primavera caldera, Jalisco, Mexico, Int. Geol. Rev., 54, 833–843, 2012.
Ward, J. H.: Hierarchical grouping to optimize an objective function, J. Am. Stat. Assoc., 58, 236–244, 1963.
Williams, A. J., Crossey, L. J., Karlstrom, K. E., Newell, D., Person, M., and Woolsey, E.:
Hydro-25
geochemistry of the Middle Rio Grande aquifer system – fluid mixing and salinization of the Rio Grande due to fault inputs, Chem. Geol., 351, 281–298, 2013.
Zarate-del Valle, P. F. and Simoneit, B. R. T.: La generación de petróleo hidrotermal en sedi-mentos del Lago Chapala y su relación con la actividad geotérmica del rift Citala en el estado de Jalisco, Rev. Mex. Cienc. Geol., 22, 358–370, 2005.
HESSD
12, 1599–1631, 2015Groundwater flow processes and mixing in active volcanic systems
A. Hernández-Antonio et al.
Title Page
Abstract Introduction
Conclusions References
Tables Figures
◭ ◮
◭ ◮
Back Close
Full Screen / Esc
Printer-friendly Version
Interactive Discussion
Discussion
P
a
per
|
Discussion
P
a
per
|
Discussion
P
a
per
|
Discussion
P
a
per
|
Table 1.Concentrations of measured field parameters, groundwater elements, stable isotopic ratios, and hydrochemical classification. Data are given in mg L−1, except otherwise indicated. Note:T=temperature, DO=dissolved oxygen, EC=electrical conductivity.
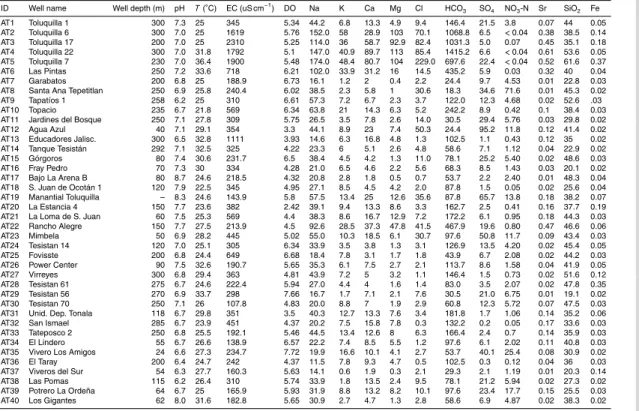
ID Well name Well depth (m) pH T(◦
C) EC (uS cm−1
) DO Na K Ca Mg Cl HCO3 SO4 NO3-N Sr SiO2 Fe
HESSD
12, 1599–1631, 2015Groundwater flow processes and mixing in active volcanic systems
A. Hernández-Antonio et al.
Title Page
Abstract Introduction
Conclusions References
Tables Figures
◭ ◮
◭ ◮
Back Close
Full Screen / Esc
Printer-friendly Version
Interactive Discussion
Discussion
P
a
per
|
Discussion
P
a
per
|
Discussion
P
a
per
|
Discussion
P
a
per
|
Table 1.Continued.
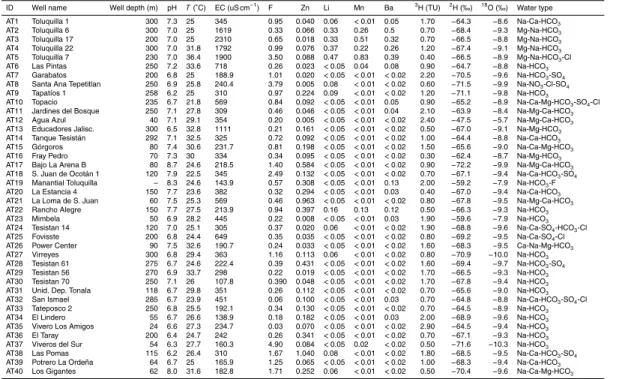
ID Well name Well depth (m) pH T(◦C) EC (uS cm−1) F Zn Li Mn Ba 3H (TU) 2H (‰) 18O (‰) Water type
AT1 Toluquilla 1 300 7.3 25 345 0.95 0.040 0.06 <0.01 0.05 1.70 −64.3 −8.6 Na-Ca-HCO3
AT2 Toluquilla 6 300 7.0 25 1619 0.33 0.066 0.33 0.26 0.5 0.70 −68.4 −9.3 Mg-Na-HCO3
AT3 Toluquilla 17 200 7.0 25 2310 0.65 0.018 0.33 0.51 0.32 0.70 −66.5 −8.8 Mg-Na-HCO3
AT4 Toluquilla 22 300 7.0 31.8 1792 0.99 0.076 0.37 0.22 0.26 1.20 −67.4 −9.1 Mg-Na-HCO3
AT5 Toluquilla 7 230 7.0 36.4 1900 3.50 0.088 0.47 0.83 0.39 0.40 −66.5 −8.9 Mg-Na-HCO3-Cl
AT6 Las Pintas 250 7.2 33.6 718 0.26 0.023 <0.05 0.04 0.08 0.90 −64.7 −8.8 Na-HCO3
AT7 Garabatos 200 6.8 25 188.9 1.01 0.020 <0.05 <0.01 <0.02 2.20 −70.5 −9.6 Na-HCO3-SO4
AT8 Santa Ana Tepetitlan 250 6.9 25.8 240.4 3.79 0.005 0.08 <0.01 <0.02 0.60 −71.5 −9.9 Na-NO3-Cl-SO4
AT9 Tapatíos 1 258 6.2 25 310 0.97 0.224 0.09 <0.01 <0.02 1.20 −71.1 −9.8 Na-HCO3
AT10 Topacio 235 6.7 21.8 569 0.84 0.092 <0.05 <0.01 0.05 0.90 −65.2 −8.9 Na-Ca-Mg-HCO3-SO4-Cl
AT11 Jardines del Bosque 250 7.1 27.8 309 0.46 0.046 <0.05 <0.01 0.04 2.10 −63.9 −8.4 Na-Mg-Ca-HCO3
AT12 Agua Azul 40 7.1 29.1 354 0.20 0.005 <0.05 <0.01 <0.02 2.40 −47.5 −5.7 Na-Mg-Ca-HCO3
AT13 Educadores Jalisc. 300 6.5 32.8 1111 0.21 0.161 <0.05 <0.01 <0.02 0.50 −67.0 −9.1 Na-Mg-HCO3
AT14 Tanque Tesistán 292 7.1 32.5 325 0.72 0.092 <0.05 <0.01 <0.02 1.00 −64.4 −8.8 Na-Ca-HCO3
AT15 Górgoros 80 7.4 30.6 231.7 0.81 0.198 <0.05 <0.01 <0.02 1.50 −65.6 −9.0 Na-Ca-Mg-HCO3
AT16 Fray Pedro 70 7.3 30 334 0.34 0.095 <0.05 <0.01 <0.02 0.30 −62.4 −8.7 Na-Mg-HCO3
AT17 Bajo La Arena B 80 8.7 24.6 218.5 1.40 0.584 <0.05 <0.01 <0.02 0.90 −72.2 −9.9 Na-Mg-Ca-HCO3
AT18 S. Juan de Ocotán 1 120 7.9 22.5 345 2.49 0.132 <0.05 <0.01 <0.02 0.70 −67.1 −9.4 Na-Ca-HCO3-SO4
AT19 Manantial Toluquilla – 8.3 24.6 143.9 0.57 0.308 <0.05 <0.01 0.13 2.00 −59.2 −7.9 Na-HCO3-F
AT20 La Estancia 4 150 7.7 23.6 382 0.32 0.294 <0.05 <0.01 0.03 0.40 −67.0 −9.4 Na-Ca-HCO3
AT21 La Loma de S. Juan 60 7.5 25.3 569 0.46 0.963 <0.05 <0.01 <0.02 0.80 −67.8 −9.5 Na-Mg-Ca-HCO3
AT22 Rancho Alegre 150 7.7 27.5 213.9 0.94 0.397 0.16 0.13 0.12 0.50 −66.3 −9.3 Na-HCO3
AT23 Mimbela 50 6.9 28.2 445 0.22 0.008 <0.05 <0.01 0.03 1.90 −59.6 −7.9 Na-HCO3
AT24 Tesistan 14 120 7.0 25.1 305 0.37 0.020 0.06 <0.01 <0.02 1.90 −68.8 −9.6 Na-Ca-SO4-HCO3-Cl
AT25 Fovisste 200 6.8 24.4 649 0.35 0.035 <0.05 <0.01 <0.02 0.80 −69.2 −9.5 Na-Ca-SO4-Cl
AT26 Power Center 90 7.5 32.6 190.7 0.24 0.033 <0.05 <0.01 <0.02 1.60 −68.3 −9.5 Ca-Na-Mg-HCO3
AT27 Virreyes 300 6.8 29.4 363 1.16 0.113 0.06 <0.01 <0.02 0.80 −70.9 −10.0 Na-HCO3
AT28 Tesistan 61 275 6.7 24.6 222.4 0.39 0.431 <0.05 <0.01 <0.02 1.60 −69.4 −9.7 Na-HCO3-SO4
AT29 Tesistan 56 270 6.9 33.7 298 0.22 0.019 <0.05 <0.01 <0.02 1.70 −66.5 −9.3 Na-HCO3
AT30 Tesistan 70 250 7.1 26 107.8 0.390 0.048 <0.05 <0.01 <0.02 1.70 −67.8 −9.4 Na-HCO3
AT31 Unid. Dep. Tonala 118 6.7 29.8 351 0.26 0.112 <0.05 <0.01 <0.02 0.70 −65.6 −9.0 Na-HCO3
AT32 San Ismael 285 6.7 23.9 451 0.06 0.100 <0.05 <0.01 0.03 0.70 −64.8 −8.8 Na-Ca-HCO3-SO4-Cl
AT33 Tateposco 2 250 6.8 25.5 192.1 0.34 0.130 <0.05 <0.01 <0.02 0.70 −64.5 −8.9 Na-HCO3
AT34 El Lindero 55 6.7 26.6 138.9 0.18 0.182 <0.05 <0.01 0.03 2.00 −68.9 −9.6 Na-HCO3
AT35 Vivero Los Amigos 24 6.6 27.3 234.7 0.03 0.070 <0.05 <0.01 <0.02 2.90 −64.5 −9.4 Na-HCO3
AT36 El Taray 200 6.4 24.7 242 0.26 0.341 <0.05 <0.01 <0.02 0.70 −67.1 −9.3 Na-HCO3
AT37 Viveros del Sur 54 6.3 27.7 160.3 4.90 0.084 <0.05 0.02 <0.02 0.50 −71.6 −10.3 Na-HCO3
AT38 Las Pomas 115 6.2 26.4 310 1.67 1.040 0.08 <0.01 <0.02 1.80 −68.5 −9.5 Na-Ca-HCO3-SO4
AT39 Potrero La Ordeña 64 6.7 25 165.9 1.25 0.065 <0.05 <0.01 <0.02 1.00 −68.3 −9.4 Na-Ca-HCO3
HESSD
12, 1599–1631, 2015Groundwater flow processes and mixing in active volcanic systems
A. Hernández-Antonio et al.
Title Page
Abstract Introduction
Conclusions References
Tables Figures
◭ ◮
◭ ◮
Back Close
Full Screen / Esc
Printer-friendly Version
Interactive Discussion
Discussion
P
a
per
|
Discussion
P
a
per
|
Discussion
P
a
per
|
Discussion
P
a
per
|
Table 2. Median values of water chemistry of the groundwater subgroups determined from HCA. Data are given in mg L−1, except for pH (standard units), EC (electrical conductivity in µS cm−1), temperature (◦C),3H (in UT),δ2H (in ‰ VSMOW) andδ18O (in ‰ VSMOW). Note: DO=dissolved oxygen.
Group N Parameter pH T EC SDT DO 3H δ2H (‰) δ18O HCO3 K Mg Si Ca Fe Na Sr Zn F Cl
HESSD
12, 1599–1631, 2015Groundwater flow processes and mixing in active volcanic systems
A. Hernández-Antonio et al.
Title Page
Abstract Introduction
Conclusions References
Tables Figures
◭ ◮
◭ ◮
Back Close
Full Screen / Esc
Printer-friendly Version
Interactive Discussion
Discussion
P
a
per
|
Discussion
P
a
per
|
Discussion
P
a
per
|
Discussion
P
a
per
|
Table 2.Continued.
Group N Parameter pH T EC SDT NO3-N SO4 Li Ba Mn
1 6 Average 6.9 33.8 1575 733 0.17 11.0 0.29 0.28 0.33 Median 7.0 33.6 1706 710 0.05 6.5 0.33 0.29 0.24
2 12 Average 7.2 30.2 300 95 0.97 3.9 0.01 0.04 0.01
Median 7.1 29.9 317 89 0.57 2.4 0.00 0.03 0.01
3 3 Average 6.8 23.4 556 229 12.4 70.6 0.00 0.08 0.01 Median 6.7 23.9 569 241 11.8 65.7 0.00 0.08 0.01
4 19 Average 7.0 25.3 254 84 9.1 15.5 0.02 0.04 0.01
HESSD
12, 1599–1631, 2015Groundwater flow processes and mixing in active volcanic systems
A. Hernández-Antonio et al.
Title Page
Abstract Introduction
Conclusions References
Tables Figures
◭ ◮
◭ ◮
Back Close
Full Screen / Esc
Printer-friendly Version
Interactive Discussion
Discussion
P
a
per
|
Discussion
P
a
per
|
Discussion
P
a
per
|
Discussion
P
a
per
|
Table 3.Rotated component matrix of the factor analysis for groundwater samples from the Atemajac Toluquilla aquifer system. Coefficients between−0.1 and 0.1 are suppressed. Note: DO=dissolved oxygen,T=temperature, EC=electrical conductivity.
Variable PC1 PC2 PC3 PC4
pH 0.47
T 0.24 0.23 0.29
EC 0.32
DO −0.25
3
H −0.37 0.15
2
H 0.45 −0.20
18
O 0.45
HCO3 0.32
K 0.32
Mg 0.33
SiO2 −0.23
Ca 0.32
Fe −0.37
Na 0.33
Sr 0.32 0.13
Zn
F −0.371
Cl 0.3
NO3 −0.40
SO4 −0.50
Eigenvalue 8.43 3.38 2.21 1.34
% of variance 42 17 11 7
HESSD
12, 1599–1631, 2015Groundwater flow processes and mixing in active volcanic systems
A. Hernández-Antonio et al.
Title Page
Abstract Introduction
Conclusions References
Tables Figures
◭ ◮
◭ ◮
Back Close
Full Screen / Esc
Printer-friendly Version
Interactive Discussion
Discussion
P
a
per
|
Discussion
P
a
per
|
Discussion
P
a
per
|
Discussion
P
a
per
|
Table 4.Mixing proportions from The multivariate mixing and mass-balance model, M3, using the following reference waters: no. 5 as a reference for hydrothermal fluids; no. 12 as a refer-ence for polluted water; and no. 37 as referrefer-ence for groundwater.
Well ID Well group % hydrothermal water % fresh groundwater % polluted water
2 1 77 23 0
3 1 75 21 4
4 1 87 10 3
5 1 100 0 0
6 1 32 50 18
22 1 45 42 13
10 2 13 63 24
13 2 8 76 16
14 2 2 70 28
16 2 4 71 25
18 2 5 80 15
20 2 11 72 17
21 2 13 70 17
31 2 12 69 19
32 2 8 69 23
33 2 11 67 22
36 2 5 80 15
40 2 3 85 12
12 3 0 0 100
19 3 9 28 63
23 3 4 37 59
1 4 4 59 37
7 4 – – –
8 4 2 75 23
9 4 5 75 20
11 4 – – –
15 4 0 64 36
17 4 2 87 11
24 4 0 72 28
25 4 1 79 20
26 4 3 72 25
27 4 6 81 13
28 4 1 77 22
29 4 – – –
30 4 1 70 29
34 4 1 76 23
35 4 – – –
37 4 0 100 0
38 4 0 72 28
HESSD
12, 1599–1631, 2015Groundwater flow processes and mixing in active volcanic systems
A. Hernández-Antonio et al.
Title Page
Abstract Introduction
Conclusions References
Tables Figures
◭ ◮
◭ ◮
Back Close
Full Screen / Esc
Printer-friendly Version
Interactive Discussion
Discussion
P
a
per
|
Discussion
P
a
per
|
Discussion
P
a
per
|
Discussion
P
a
per
|