Submitted20 April 2016 Accepted 23 June 2016 Published21 July 2016
Corresponding author Jorge A. Vila, jv84@cornell.edu
Academic editor Rudiger Ettrich
Additional Information and Declarations can be found on page 16
DOI10.7717/peerj.2253
Copyright 2016 Garay et al.
Distributed under
Creative Commons CC-BY 4.0
OPEN ACCESS
Detection of methylation, acetylation
and glycosylation of protein residues by
monitoring
13
C chemical-shift changes: A
quantum-chemical study
Pablo G. Garay1, Osvaldo A. Martin1, Harold A. Scheraga2and Jorge A. Vila1
1IMASL-CONICET, Universidad Nacional de San Luis, San Luis, Argentina 2Chemistry and Chemical Biology, Cornell University, Ithaca, NY, USA
ABSTRACT
Post-translational modifications of proteins expand the diversity of the proteome by several orders of magnitude and have a profound effect on several biological processes. Their detection by experimental methods is not free of limitations such as the amount of sample needed or the use of destructive procedures to obtain the sample. Certainly, new approaches are needed and, therefore, we explore here the feasibility of using13C
chemical shifts of different nuclei to detect methylation, acetylation and glycosylation
of protein residues by monitoring the deviation of the13C chemical shifts from the
expected (mean) experimental value of the non-modified residue. As a proof-of-concept, we used13C chemical shifts, computed at the DFT-level of theory, to test this
hypothesis. Moreover, as a validation test of this approach, we compare our theoretical
computations of the 13C
ε chemical-shift values against existing experimental data,
obtained from NMR spectroscopy, for methylated and acetylated lysine residues with
good agreement within∼1 ppm. Then, further use of this approach to select the most
suitable13C-nucleus, with which to determine other modifications commonly seen,
such as methylation of arginine and glycosylation of serine, asparagine and threonine, shows encouraging results.
SubjectsBiochemistry, Bioinformatics, Computational Biology
Keywords Post-translational modifications, Methylation, Glycosylation, Acetylation, Protein, Glycan, Chemical shift, DFT
INTRODUCTION
Since the pioneer observation of lysine methylation of a bacterial protein by Ambler & Rees (1959), there has been a rising interest in investigating protein post-translational
modifications (PTMs) and their role as modulators of protein activity (Zobel-Thropp,
Gary & Clarke, 1998;Bienkiewicz & Lumb, 1999;Bannister, Schneider & Kouzarides, 2002;
Paik, Paik & Kim, 2007;Bedford & Clarke, 2009;Kamieniarz & Schneider, 2009;Kamath, Vasavada & Srivastava, 2011;Luo, 2012;Theillet et al., 2012a;Theillet et al., 2012b;Evich et al., 2015;Rahimi & Costello, 2015;Schubert et al., 2015). As a consequence of their relevance, the development of fast and accurate experimental methods for detection of PTMs has also been an object of active research in the field (Kamath, Vasavada & Srivastava,
methodology to detect glycosylation of residues in proteins under urea-denaturing conditions. The advantages and disadvantages of the proposed new methodology against existing methods for the analysis and detection of PTMs, such as Mass Spectroscopy (MS) (Kamath, Vasavada & Srivastava, 2011;Luo, 2012), were discussed in detail bySchubert et al. (2015). One of the main disadvantages of this new methodology (Schubert et al., 2015) is the several larger orders of magnitude of sample required, compared to that needed in MS experiments. Despite this limitation, and the requirement of urea-denaturing conditions,
the methodology of Schubert et al. (2015)presents interesting advantages over existing
methods, such as analysis of intact proteins to allow the detection of glycosylation in proteins as well as to identify the composition of the attached glycans and the type of glycan linkages. The use of chemical-shift variations to sense PTMs is not a novel approach (Bienkiewicz & Lumb, 1999). In fact, it was used to analyze random-coil chemical-shift variations of the1H,
13C and15N nuclei of serine, threonine and tyrosine upon phosphorylation (Bienkiewicz &
Lumb, 1999). The results were very promising, e.g., up to∼4 ppm chemical-shift difference
was observed for the13Cβnucleus of Thr upon phosphorylation. However, to extend this
approach to treat other PTMs would require the monitoring of chemical-shift changes in random-coil model peptides of these PTMs, and this is a costly and time consuming
procedure. For this reason, we propose such monitoring in silico,rather than by using
random-coil experiments, as a method to identify the most suitable13C nuclei with which
to sense the existence of PTMs in proteins, e.g., to detect the states of arginine methylation, or glycosylation of serine, asparagine and threonine residues.
We propose to analyze the feasibility to detect PTMs by measuring the deviation of
the13C chemical shifts of a given nucleus from its mean experimental value. To evaluate
this idea, in silico, we proceed as follows. For a selected nucleus, we compute, at the
DFT-level of theory for an ensemble of conformations, the13C chemical-shifts for the
non-modified and the modified residues, respectively. We built these ensembles as a
set of pairs of modified andnon-modified residues possessing the same backbone and
side-chain torsional angles. Consequently, the only difference in the computed chemical shifts between both distributions came from the PTM. In fact, although chemical shifts are influenced by both the torsional angles and the PTM, the former effect is canceled out because both distributions possess the same set of torsional angles. Then, from each
member of both ensembles we subtract the mean of the13C chemical-shift of the ensemble
from thenon-modified residue. This is what we call, from here on, the1value. As a result,
the computed1values are the expected deviations from thenon-modified mean chemical
shift values. Naturally, the distribution of the1values fornon-modified residues is, by definition, centered around 0.0 ppm, as can be seen for each of the blue-line curves in Figs. 1–7(exceptFigs. 3and4).
The use of1values to detect PTMs does not require carrying out experiments under
urea-denaturing conditions or the use of a large amount of sample, as with the recent
NMR-based proposed methodology (Schubert et al., 2015). This is an advantage. As a
disadvantage, it does require the labeling of the carbons of the protein, although13C-labeling
is a widely and standard procedure used in both NMR-based experimentsand theoretical
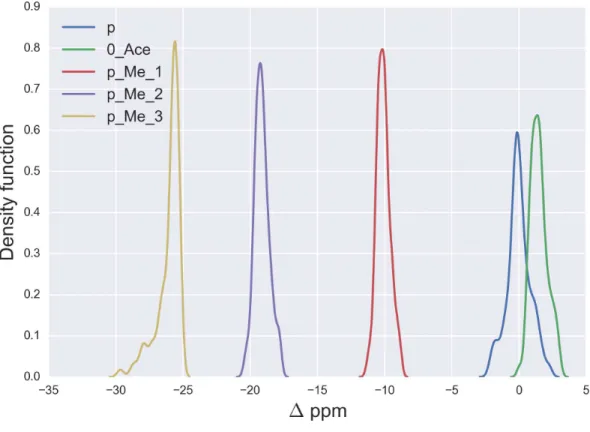
Figure 1 Kernel Density Estimation of the computed1values for the13Cεnucleus ofnon-modified charged (blue-line), acetylated (green-line), mono- (red-line), di- (violet-line), and tri-methylated (yellow-line) Lys.
in protein structures (Martin et al., 2013); (ii) use as constraints during an NMR-based protein structure determination (Vila et al., 2008;Rosato & Billeter, 2015); (iii) resolve local inconsistencies between X-ray crystal structures (Vila et al., 2012); (iv) determine the tautomer preference of histidine in proteins accurately (Sudmeier et al., 2003;Vila et al., 2011); (v) study sparsely populated, short-lived, protein states that could play a significant role in protein function (Hansen & Kay, 2014); etc.
MATERIAL AND METHODS
Preparation of the model tripeptides for the DFT calculations
DFT calculations were carried out for model tripeptides of the form Ace-Gly-Yyy
-Gly-Nme, with Yyybeing lysine (Lys) or arginine (Arg). The backbone torsional angles for
the tripeptides (including theN- andC-terminal groups) and the side-chain for residue
Yyy were taken from a data-base of a non-redundant set of 6,134 high-quality X-ray
structures of proteins solved at resolution ≤1.8 Å, withR factor≤0.25, and with less
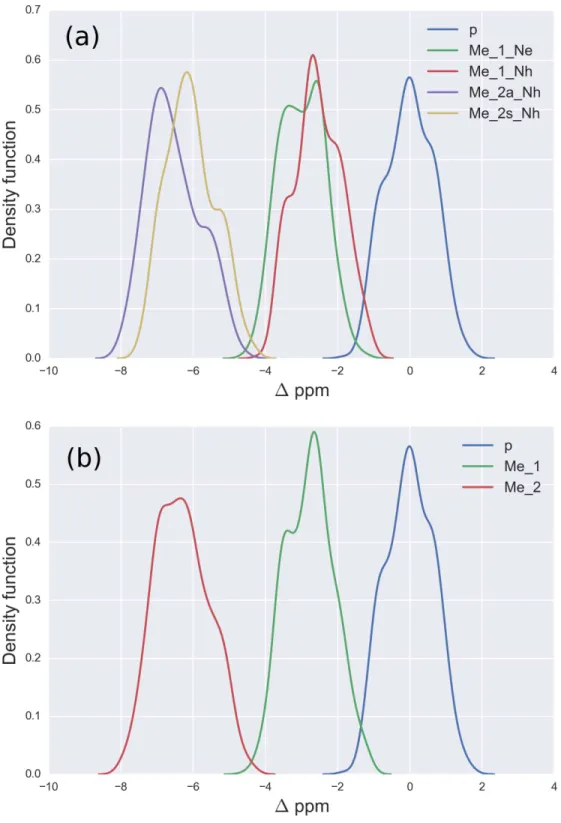
Figure 2 (A) Kernel Density Estimation of the computed1values for the13Cζnucleus ofnon -methylated charged (blue-line), mono--methylated (Nε(green-line) andNη(red-line)) and
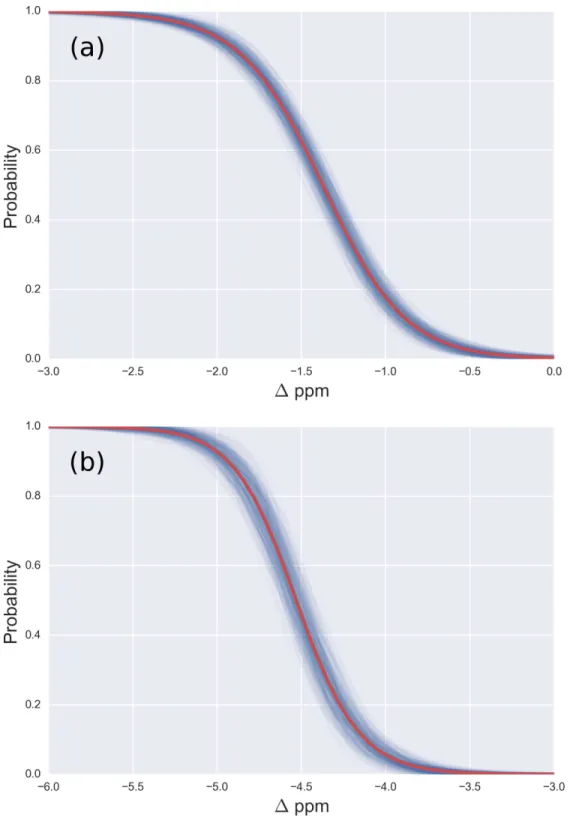
Figure 3 (A) Probability profile of the Arg residue to bemono-methylated (instead of being
non-modified) as function of the1values for the13Cζnucleus; with data fromFig. 2B; (B) same as (A) for thedi-methylated Arg. The red line represents the expected probability-profile and the blue lines the
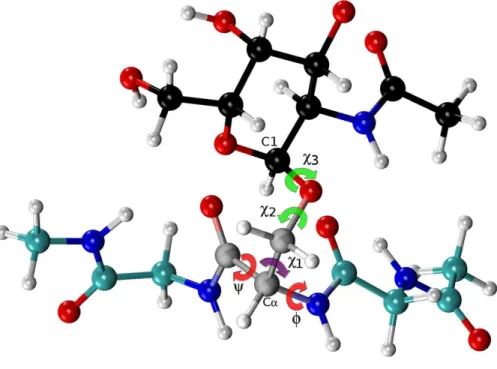
Figure 4 Ball and stick representation of a glycan-amino acidic residue, namely forα -D-GalpNAc-(1-O)-Ser with ‘‘1’’ representing C1 of the glycan, and ‘‘O’’ representing the oxygen of the side-chain of Ser in an Ac-Gly-Ser-Gly-Nme tripeptide, in an arbitrary conformation.Theχ2 andχ3 torsional an-gles, of the carbohydrate group (α-D-GalpNAc), are highlighted in green, while the corresponding one for the amino-acidic residue (Ser) are in red, forφ,ψ, and purple, forχ1.
with a considerable reduction in computational time. All the 500 conformations were free of atomic-overlaps. It is worth noting that, during the generation of the conformations, the most frequently observed rotamers were used, namely two for acetylation and up to three for methylation. Although the environment may play a role setting preferences for some rotamers this effect cannot be taken into account in a general theoretical analysis because this would imply that every possible environment be taken into account. Because of this, we considered each rotamer as equally probable.
For model Lys tripeptides, we generated a total of 5,000 conformations, namely 500 for charged Lys (i.e., the unmodified amino acid), 1,000 for acetylated Lys, i.e., 500 for each of the rotamers, namely, 0◦and 180◦, 1,500 conformations formonomethylated Lys, i.e., 500 for each of the rotamers, namely,+60◦,−60◦, and 180◦, 1,500 conformations for
dimethylated Lys, i.e., 500 for each of the rotamers, namely,+60◦,−60◦, and 180◦and
finally 500 for trimethylated Lys. The following is the reason for the need to compute
more than 500 conformations for modified residues, except for tri-methylated Lys. The replacement of hydrogens by methyl or acetyl groups introduces an asymmetry in the molecule that could influence the DFT computations; hence, rotamers must be generated and the DFT-computed shieldings have to be averaged over these rotameric states.
For Arg, we analyzed a total of 6,000 conformations, namely 500 for charged Arg (i.e., the
unmodified amino acid), 2,500 conformations formono-methylated Arg (Zobel-Thropp,
respectively, and 3,000 fordi-methylated Arg, i.e., 2,000 for asymmetric and 1,000 for
symmetricdi-methylation of Arg, respectively.
It is worth noting that, because we are interestedonlyin the chemical-shift differences (1), the implicit assumptions, during the quantum-chemical calculation of the shieldings, are that most of the errors associated with issues not-included in the calculations, such as those derived from a suitable selection of (i) dielectric solvent; (ii) geometry optimization; (iii) reference value, etc., should not affect the accuracy of the calculations of interest because
all these effects are expected to be canceled-out during the computation of1. However,
some intermolecular interactions not-included in the calculations, such as those with explicit solvent molecules and amino acids close in space, may affect the DFT-computed chemical shifts in a way that cannot be canceled out by computing1. Nevertheless, the good agreement of the predictions with the observed values for methylation and acetylation of Lysine and Arginine, andO-glycosylation of Thr, suggest that oversight of such interactions may not be crucial.
Preparation of the glyco-amino acidic residue for the DFT calculations
Fromallpossible tripeptides of the above mentioned data-base, i.e., of thenon-redundant set of 6,134 high-quality X-ray structures of proteins, we randomly selected those containing serine (Ser), threonine (Thr) or asparagine (Asn) as residueYyyin the sequence
Ace-Xxx-Yyy-Zzz-Nme, with Xxx and Zzz being the nearest-neighbor residues ofYyyin
the selected tripeptide. The backbone torsional angles for the tripeptides (including the
N- andC-terminal groups) and the side-chain for the residueYyywere taken from the
above mentioned data-base, while side-chain torsional angles for the residues Xxx and Zzz, that show non atomic-overlaps, were arbitrarily chosen. This procedure ensures that the model tripeptides are a representative sample of the torsional angles observed in nature for a given Yyyamino acid. At this point, it is worth noting that, for Lys and Arg, the
analysis was carried out on selected tripeptides with the sequence Ace-Gly-Yyy-Gly-Nme
rather than on Ace-Xxx-Yyy-Zzz-Nme tripeptide, as for the glycosylated residues. The
reason is that methyl and acetyl groups are small chemical groups while glycans are very bulky moieties and, hence, the degree of freedom of the glycosylated residue (Yyy) will be severely restricted depending on the identity of the nearest-neighbor Xxx and Zzz residues. Another peculiarity of the generation of model tripeptides for glycosylated residues is that, after glycosylation of the residueYyy, new side-chain rotations must be explored because of the appearance of additional torsional angles, namelyχ2,χ3 for Ser and Thr andχ4
for Asn (seeFig. 4, and Figs. S6 and S7 of theSupplemental Information). We explore
these angles at 3 positions,+60◦,−60◦, and 180◦. Among all possible conformations only
500, showing non atomic-overlaps, were considered for the computation of the shieldings at the DFT-level of theory. To assure that the computed shielding differences (1) mirror
only the presence of a glycan linked to aYyy (Ser/Thr/Asn) amino acid residue, the
monosaccharide of each of the 500 chosen glycosylated conformations was removed and,
for the remainingnon-glycosylated residue, the shieldings were computed at the DFT-level
this way, we have generated an ensemble of 500 conformations of glycosylated and 500
conformations ofnon-glycosylated residues, namely for Ser, Thr and Asn, that contain
no atomic-overlapping and possessing identical backbone and side-chain torsional angles between the glycosylated and the non-glycosylated residue.
Computation of the shieldings, for the nuclei of interest, at the DFT level of theory
To compute the gas-phase 13C-shielding values, at the DFT-level of theory, for any
nucleus of interest we will follow the same approach used previously for proteins (Vila et al., 2009) and disaccharides (Garay et al., 2014), namely, the13C shielding value
was computed, by using the Gaussian 09 package (Gaussian, Inc, Wallingford, CT) by treating each nucleus, and their neighbors of interest, at the OB98/6-311+G(2d,p) level of
theory, while the remaining nuclei in the sequence were treated at the OB98/3-21G level of theory (Vila et al., 2009;Garay et al., 2014), i.e., by using thelocally-dense basis setapproach (Chesnut & Moore, 1989).
Computation of the standard deviation from the BMRB
On November 13, 2015, we downloadedallthe chemical shifts deposited at the Biological
Magnetic Resonance Bank (BMRB) (Ulrich et al., 2008). We restricted the analysis to
entries that were referenced to DSS, TMS or TSP. Then, we re-referenced the chemical
shifts to DSS by adding 0.12 ppm to TSP and−1.7 ppm to TMS. All data points below
Q1−1.5×IQR or above Q3+1.5×IQR were considered outliers and removed (with
IQR being the Inter-Quartile Range between Q1 and Q3, where Q1 and Q3 are the first and third quartiles, respectively). After removing the outliers, we computed the mean and standard deviation of the distribution for each residue of interest.
Computation of the probability profiles
During the computation of the probability profile, we assume that each chemical shift belongs to one of two possible Gaussian distributions, for example, due to methylated and not methylated arginine or lysine, respectively. Our aim is to compute aprobability profile that indicates the probability of a chemical shift to belong to either distribution. For this purpose, we created a simple Bayesian model. In this model, we estimated the mean and standard deviation of the distribution of the chemical-shift differences (1), assuming that
the1values are distributed approximately as Gaussian distributions with unknown mean
and standard deviation.
Theprior for the mean is a student-t distribution with mean equal to the mean of the computed1values and ascaleequal to 0.35. We assumed thisscaleof 0.35 from the lysine analysis showing that the theoretical and experimental values are in very close agreement
within∼1 ppm (see ‘Validation Test on Lysine Derivatives’). In other words, we are
confident that the theoretical chemical-shift distributions are an accurate representation
of the experimental ones within∼1 ppm. Finally, the degrees of freedom of the
student-t distribution were estimated from the computed1 values using as hyper-prior an
exponential distribution with mean and standard deviation of 30. A student-t distribution
distribution. Theprior for the standard deviation is a Gamma distribution with mean and standard deviation computed from the experimental values deposited in the BMRB, as
explained in the sectionComputation of the standard deviation from the BMRB.
From the model described above, we computed theposterior distribution, and from
the posterior distribution we computed the posterior predicted values, i.e., the values of chemical shifts, for each of the two given states, according to the Bayesian model. Given theposterior predicted values, it is straightforward to compute the probability of a residue to be in a given state as a function of the1values, essentially because we are
assuming only two possible states, i.e., methylated and non-methylated. Figure 3(and
Figs. S3–S5 of theSupplemental Information) shows the results of the analysis in red and
blue, semitransparent, lines. Each of these blue lines corresponds to a possible occurrence of the probability profile and the red line, in each of these figures, is the mean ofall the blues lines. Thus, the red line represents the expected probability profile and the blue lines the uncertainty in the data according to the Bayesian model.
Data analysis and visualization
Data analysis and visualization were performed using Python (Van Rossum, 1995), IPython
(Perez & Granger, 2007), NumPy (Van der Walt, Colbert & Varoquaux, 2011), Pandas (McKinney, 2010), Matplotlib (Hunter, 2007), and Seaborn (Waskom et al., 2016); Bayesian computations were carried out with PyMC3 (Salvatier, Wiecki & Fonnesbeck, 2016).
RESULTS AND DISCUSSION
Validation test on lysine derivatives
As a first step, it is necessary to validate the methodology. For this purpose, we started by analyzing the computed1values for the13Cε chemical-shifts of Lys in a model tripeptide, Ace-Gly-Lys-Gly-Nme, for a total of 6,500 conformations of Lys with various degrees of acetylation or methylation (see details of the generation of the conformations in the
‘Material and Methods’). By following this procedure, the resulting mean1values from
the Kernel Density Estimation of the chemical-shift differences, shown in Fig. 1, are
1.5 ppm, −10.1 ppm, −19.1 ppm and−25.8 ppm for acetylated, mono-, di- and
tri-methylated Lys, respectively. A comparison of these computed mean1values with the observed13Cε chemical-shift variations of charged Lys upon acetylation and methylation, namely, 0.0, 9.0, 18.0 and 26.5 ppm, respectively (Theillet et al., 2012a), enables us to
conclude that very good agreement exists within ∼1 ppm between these theoretical
predictions and experimental evidence. Overall, the 13Cε chemical-shifts are sensitive enough to detect methylation (see yellow-, violet-, red- and blue-lines inFig. 1) but not acetylation states of Lys; the superposition of the1values (see green- and blue-line in Fig. 1) make the distinction between acetylated andnon-modified Lys unfeasible. At this point is worth noting, fromFig. 1, that the effect of chemical shift differences due to
rotamer changes (∼1.3 ppm, on average) is by far smaller than the effect due to PTM
changes (∼10 ppm, on average).
In addition, the computed1-values for the 13Cα and13Cβ nuclei upon acetylation
The superposition of these curves for the methylated with those of thenon-methylated charged Lys (Figs. S1A and S1B) indicates that these nuclei are not sensitive enough
to detect methylation. From Figs. S1A and S1B (of Supplemental Information) we
also observe that the curves for acetylated Lys do not fully-overlap either the ones for
methylated or thenon-modified charged Lys and, hence, the origin of this behavior must
be investigated. In this regard, it should be noted that acetylation, but not methylation, does not preserve the state of charge of Lys. Consequently, the change in protonation upon acetylation should be the reason for the above unexpected result. Indeed, the change of protonation fornon-modified Lys, as occurs at a high pH value, leads to a1distribution (see Figs. S1C and S1D) showing a very similar pattern to the one obtained after acetylation (see Figs. S1A and S1B). Taking all this together, these results indicate that the13Cαand13Cβ nuclei of Lys are not sensitive enough to detect either methylation or acetylation states of lysine in proteins.
Having presented the above test on lysine, we have a validation of our theoretical approach and have shown that computation of the1values, for a given nucleus, is a useful method with which to detect the methylation states of Lys (Theillet et al., 2012a;Theillet et al., 2012b), but not acetylation (Theillet et al., 2012a). Consequently, we decided to extend this analysis to discuss methylation of Arg, and glycosylation of Ser, Asn and Thr, with model tripeptides, and the results are discussed below.
Methylation of arginine
For Arg, with the sequence Ace-Gly-Arg-Gly-Nme, we have computed the chemical-shifts for the 13Cζ nucleus in 6,000 conformations (see details of the generation of the conformations in ‘Materials and Methods’). The Kernel Density Estimation (KDE) of the 1are shown inFig. 2A. This figure shows that it is not possible to distinguish between mono-methylated, i.e., between Arg methylated at theNε orNη group, respectively, or di-methylated, i.e., between symmetric or asymmetricdi-methylated Arg. As a consequence,
all 5 curves shown inFig. 2Acan be condensed into 3 curves, shown inFig. 2B. Each of
the resulting 3 curves shows the1values for thenon-,mono-, anddi-methylated Arg,
respectively. A comparison among the resulting distributions enables us to infer that non-,mono- anddi-methylated Arg can be distinguished by monitoring the chemical-shift variations of the13Cζ nucleus. However, as shown inFig. 2B, there is still a small overlap between the distributions and, hence, regions of ambiguity. Because of this overlapping, we compute a probability profile i.e., the probability that Arg is in one of two possible states as a function of its1value. Computation of the Arg probability-profile is illustrated by a red line and their uncertainty as blue lines (seeFig. 3). In general, the blue lines represent different occurrences of the probability-profiles, and the red line the average over all of them (seeFigs. 3and S3–S5 of theSupplemental Information). Thus, chemical-shift differences (1) within the range−2 ppm to−3 ppm indicate a large probability (>80%) that Arg
ismono-methylated (see red-line ofFig. 3A) and a very low probability (∼0%) of being
di-methylated (seeFig. 2B). On the other hand,1values smaller than−4.8 ppm indicate
a large probability (>80%) that Arg isdi-methylated (see red-line ofFig. 3B) and very low
we find that the1values for the13Cαand13Cβnuclei upon Arg methylation (shown in
Figs. S2A and S2B ofSupplemental Information) are superimposed among themselves
indicating, as for Lys, that none of these nuclei is sensitive enough to detect methylation. At this point, it is worth noting the following. First, there is no significant pKa
change within ∼0.5 pK units amongmono-methylated, di-methylated (symmetric or
asymmetric)and non-methylated Arg (Evich et al., 2015). Therefore, perturbation of the
pKaupon methylation is not large enough to be used as a probe with which to sense
Arg modification. Second, there are other nuclei, than carbons, of the Arg side-chain, such asNε, that show large chemical-shift dispersion upon methylation (Theillet et al., 2012b). However, as noted byTheillet et al. (2012b), there is some limitation in using this nucleus to detect methylation: ‘‘. . .NMR detection of solvent accessible protein arginineNHε and NHη resonances is only feasible at pH lower than 6.5, because of fast water/guanidinium proton chemical exchange. . . ’’. This drawback prevents the use of these nuclei to sense PTMs in proteins around physiological conditions, where most of the biological activities take place and which are conditions desirable for many experiments such as arginine methylase activity measurements. Despite the limitation cited byTheillet et al. (2012b), in uniformly13C- and15N-labeled proteins, the15N chemical shifts can also be obtained from experiments that do not rely on the exchangeable, and therefore, pH-sensitive protons, e.g., from HCN-type experiments (Fiala, Czernek & Sklenář, 2000).
To end, the computation of the probability profiles was carried out taking into account the chemical shifts ofonlytwo states, such asmono- ordi-methylation, but not other possible modifications, such as phosphorylation or citrullination, which were not considered in our analysis.
Glycosylation of Ser, Thr and Asn
Finally, we explore whether the computed1values upon-glycosylation, at the DFT-level of
theory (Garay et al., 2014), for the13C nucleus closer to the glycosylation site, namely13Cβ for the Ser and Thr and13Cγ for the Asn residue, respectively, can be used as a probe with
which to sense the most commonly seen O- andN-glycosylation, namely theO-linked
N-acetylglucosamine (GlcpNAc) andN-acetylgalactosamine (GalpNAc) glycosylation
of Ser and Thr (Nishikawa et al., 2010), and theN-acetylglucosamine glycosylation of Asn (Chauhan, Rao & Raghava, 2013). By focusing our attention on the1values upon glycosylation for some selected 13C nuclei of the residue side-chain, we will be able to determine whether, first, the1-values can be used to determine glycosylation and, second, the type of glycosylated residue, e.g., GlcpNAc or GalpNAc for Ser and Thr. By focusing
our analysis on some nuclei of the amino-acid residue side-chain, rather than on the13C
nuclei of the monosaccharide, to which the residue is linked, would avoid comparing the computed13C chemical shifts of residue-linked glycans with those fromnon-linked glycans for which, as far we know, there is very sparse information.
O-glycosylation of Ser
Figure 5 Kernel Density Estimation of the computed1values for the13Cβnucleus of Ser for: Ace-Xxx-Ser-Zzz-NMe (blue-line),α-D-GalpNAc-(1-O)-Ser (green-line) andβ-D-GlcpNAc-(1-O)-Ser (red-line).
(seeFig. 4), at the DFT-level of theory, for both the glycosylated and the non-glycosylated Ser. Then, the13C chemical-shift differences,1, for Ser were computed, i.e., between the
13C chemical shift for the non-glycosylated Ser in the tripeptide Ac-Xxx-Ser-Zzz-Nme, with
Xxx and Zzz being the nearest-neighbor residues of Ser in the selected tripeptide, from a non-redundant set of high-quality 6,134 X-ray structures of proteins, and the corresponding
13C chemical shift for glycosylated Ser, namely for α-D-GalpNAc-(1-O)-Ser andβ
-D-GlcpNAc-(1-O)-Ser, with Ser in the Ac-Xxx-Ser-Zzz-Nme tripeptide. The identical procedure, to that of Ser, was also carried out for 500 conformations of both the isolated
Thr (Ac-Xxx-Thr-Zzz-Nme) and the glycosylated Thr, namelyα-D-GalpNAc-(1-O)-Thr
andβ-D-GlcpNAc-(1-O)-Thr, with Thr in the Ac-Xxx-Thr-Zzz-Nme tripeptide, and 500
conformations of both the isolated Asn (Ac-Xxx-Asn-Zzz-Nme) and the glycosylated Asn,
namely forβ-D-GlcpNAc-(1-N)-Asn, with Asn in the Ac-Xxx-Asn-Zzz-Nme tripeptide.
The resulting curves for the1values are shown inFigs. 5and6for the13Cβ of Ser and Thr, respectively andFig. 7for the13Cγ of Asn.
FromFig. 5we can see, first, large overlapping1values for glycosylated Ser, namely
between theα-D-GalpNAc-(1-O)-Ser and theβ-D-GlcpNAc-(1-O)-Ser (shown as
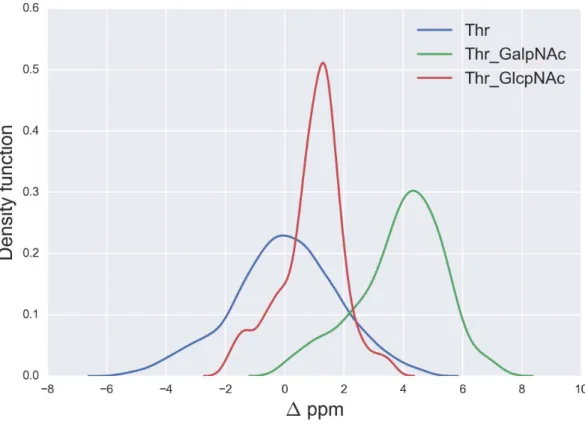
Figure 6 Kernel Density Estimation of the computed1values for the13Cβnucleus of Thr for: Ace-Xxx-Thr-Zzz-NMe (blue-line),α-D-GalpNAc-(1-O)-Thr (green-line) andβ-D-GlcpNAc-(1-O)-Thr (red-line).
kinds of glycosylation as a single curve and, hence, a unique distribution of glycosylation
probability (see Fig. S3 of Supplemental Information). As a result, a1value smaller
than−3 ppm indicates a large probability (>80%) that Ser is glycosylated (see red-line in
Fig. S3 ofSupplemental Information). However, for1values above 2 ppm the uncertainty
in the probability of glycosylation (represented by the blue-lines in Fig. S3 ofSupplemental Information) grows, thus preventing us from making an accurate assessment as to whether
Ser is glycosylated. This is a consequence of the overlapping1values between theα
-D-GalpNAc-(1-O)-Ser andnon-glycosylated Ser (seeFig. 5).
O-glycosylation of Thr
A similar analysis for the 1values of the13Cβ of Thr, shown inFig. 6, indicates that
N-acetylgalactosamine glycosylation of Thr can be detected, mainly because there is no
strong overlapping between the glycosylated [α-D-GalpNAc-(1-O)-Thr] and the
non-glycosylated (Ace-Xxx-Thr-Zzz-NMe)1-distribution for Thr. Indeed, if the computed1
value is larger than∼+3 ppm there is >80% probability that anN-acetylgalactosamine
glycosylation of Thr exists (see Fig. S4 ofSupplemental Information). On the other hand,
detection ofN-acetylglucosamine glycosylation of Thr is not straightforward because of
the strong overlapping of the1distributions between theα-D-GlcpNAc-(1-O)-Thr and
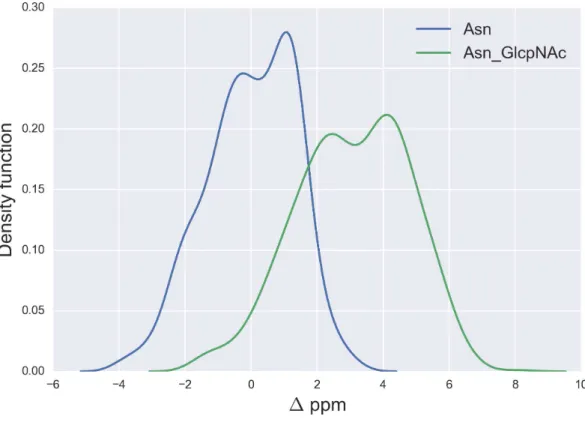
Figure 7 Kernel Density Estimation of the computed1values for the13Cγnucleus Asn for: Ace-Xxx-Asn-Zzz-NMe (blue-line) andβ-D-GlcpNAc-(1-N)-Asn (green-line).
The large13Cβ chemical shift difference observed for Thr-106 upon glycosylation
(1= +9.9 ppm), in the GalNAcα-IFNα2a glycoprotein (Ghasriani et al., 2013), is fully consistent with our prediction for theN-acetylgalactosamine glycosylation of Thr. Indeed, a 1 >6 ppm (see Fig. S4 ofSupplemental Information) reveals a high probability for
Thr being glycosylated. However, it should be noted that1’s > 8 ppm are missing from
Fig. 6, e.g., as for Thr-106 (1∼10 ppm). At this point, there are two problems associated
with the analysis of Thr-106 glycosylation that needs to be clarified, namely the meaning
of the computed 1 distributions and whether the observed1value for Thr-106 can
be reproduced by our calculations. Let us address each of them separately. First, the1
distributions in Fig. 6, like any other distributions inferred in this work (seeFigs. 1,2 and 5–7; S1 and S2 ofSupplemental Information) are meant to be representative of the chemical shift population for modified and unmodified residues, respectively, and,
hence, 1 values out of range in these figures need to be interpreted as events with
low probability, rather than null, occurrence. Second, to test whether the observed1
value for Thr-106 can be reproduced we decided to (i) compute the chemical-shift
values for the tripeptide Ac-Val-Thr106-Glu-Nme, with Val and Glu being the
nearest-neighbor amino-acid residues in the nonglycosylated and glycosylated GalNAcα-IFNα2a
computed averaged 1value (∼12 ppm) in close agreement, within∼2 ppm, with the
observed one (∼10 ppm). At this point, is worth noting that the standard deviation
(sd) of the computed chemical-shiftsfor the nonglycosylated conformations is quite
large (∼3 ppm); in fact, this is significantly larger than that the sd computed for the
glycosylated conformations (∼1 ppm) and, hence, consistent with the observation
that nonglycosylated conformations are more flexible than that the glycosylated one (Ghasriani et al., 2013).
A comparison of the N-acetylgalactosamine andN-acetylglucosamine glycosylation
of Ser and Thr (see red and green lines inFigs. 5and6, respectively) highlight two very different behaviors, in terms of1, albeit Ser and Thr side-chains differonlyby the attached
chemical-group to the Cβnucleus, namely an H and a CH
3group, respectively (seeFigs. 4
and S6 ofSupplemental Information). Actually, this fact can be understood in light of the differences, in term of the side-chain accessible conformational space, between glycosylated
Ser and Thr. Indeed, the 500 conformations of glycosylated Ser possess the side-chainχ2
torsional-angle equally clustered among−60◦,+60◦and 180◦, respectively, independent
of the nature of the attached glycan. On the contrary, theχ2 torsional-angles of the 500
conformations of eitherα-D-GalpNAc-(1-O)-Thr orβ-D-GlcpNAc-(1-O)-Thr are mostly
clustered around+60◦or 180◦, respectively.
N-glycosylation of Asn
Finally, the1values for the13Cγ of Asn are shown inFig. 7. There is no full overlapping
between 1 values computed from glycosylated and non-glycosylated Asn; hence, a
chemical-shift difference larger than ∼2 ppm indicates a large probability (>80%) of
Asn being glycosylated (see Fig. S5 ofSupplemental Information).
CONCLUSIONS
The prediction of methylation and acetylation of lysine is in good agreement (within
∼1 ppm) with the NMR-observed values (Theillet et al., 2012a). Moreover, the prediction
for theN-acetylgalactosamine glycosylation of Thr was found to be consistent with the
observed values (within∼2 ppm) for the glycosylation of Thr-106 in the GalNAcα-IFNα2a glycoprotein (Ghasriani et al., 2013).
Monitoring the1’s of the: (i)13Cζ nucleus of arginine enables us to distinguishnon-, mono- anddi-methylated Arg; and (ii)13Cβ nucleus of Ser and Thr and the13Cγ nucleus
of Asn, can be used to detect the most commonly seenO- andN-glycosylations of these
residues, except for the type of monosaccharide linked to Ser. In addition, to solve the
overlapping problem between1curves the probability profiles enable us to estimate the
chance that the residue is modified.
proteins, and the reason for this assumption follow. Experimentally there are, at least, two contributions to the changes in the chemical shifts, one from the torsional-angle variations and the other one from the PTM. Without accurate knowledge of the protein structure the best way to remove the torsional-angle contribution is to average over the largest possible ensemble of conformations. In this regard, the intrinsic larger conformational averaging of the IDP provided an advantage, over regular structured proteins, to detect PTM.
A major drawback of our approach is that13C-labeled eukaryotic proteins are typically
expressed as recombinant proteins in bacterial systems, which usually lack the ability to introduce eukaryotic PTMs.
Overall, with a test on lysine derivatives, the strategy proposed here to detect acetylation
of Lys, methylation of Lys and Arg, and theO- andN-glycosylation of Ser, Thr and Asn
residues has the potential to be used for recognition of posttranslational modifications within living cells (Doll et al., 2016), e.g., by using the proposed13C NMR spectroscopic
methodology in cells for the study of intrinsically disordered proteins (Felli, Gonnelli & Pierattelli, 2014).
ACKNOWLEDGEMENTS
The authors thank the reviewers for their valuable comments and criticisms.
ADDITIONAL INFORMATION AND DECLARATIONS
Funding
This research was supported by grants from the US National Institutes of Health (GM-14312), the US National Science Foundation (MCB10-19767) (HAS), and PIP-112-2011-0100030 from CONICET-Argentina, Project 3-2212 from UNSL-Argentina, and PICT-2014-0556 from ANPCyT-Argentina (JAV). The funders had no role in study design, data collection and analysis, decision to publish, or preparation of the manuscript.
Grant Disclosures
The following grant information was disclosed by the authors: US National Institutes of Health: GM-14312.
US National Science Foundation: MCB10-19767. CONICET-Argentina: PIP-112-2011-0100030. UNSL-Argentina: 3-2212.
ANPCyT-Argentina.: PICT-2014-0556.
Competing Interests
The authors declare there are no competing interests.
Author Contributions
• Pablo G. Garay performed the experiments, analyzed the data, prepared figures and/or
tables, reviewed drafts of the paper.
• Osvaldo A. Martin conceived and designed the experiments, analyzed the data, wrote
• Harold A. Scheraga analyzed the data, wrote the paper, reviewed drafts of the paper.
• Jorge A. Vila conceived and designed the experiments, analyzed the data, wrote the
paper, reviewed drafts of the paper.
Data Availability
The following information was supplied regarding data availability:
GitHub:https://github.com/aloctavodia/PTM.
Supplemental Information
Supplemental information for this article can be found online athttp://dx.doi.org/10.7717/ peerj.2253#supplemental-information.
REFERENCES
Ambler RP, Rees MW. 1959.Epsilon-N-Methyl-lysine in bacterial flagellar protein. Nature184:56–57.
Bannister AJ, Schneider R, Kouzarides T. 2002.Histone methylation: dynamic or static? Cell109(7):801–806DOI 10.1016/S0092-8674(02)00798-5.
Bedford MT, Clarke SG. 2009.Protein arginine methylation in mammals: who, what,
and why.Molecular Cell33(1):1–13DOI 10.1016/j.molcel.2008.12.013.
Bienkiewicz EA, Lumb KJ. 1999.Random-coil chemical shifts of phosphorylated amino
acids.Journal of Biomolecular NMR15(3):203–206DOI 10.1023/A:1008375029746.
Chauhan JS, Rao A, Raghava GPS. 2013.In silico platform for prediction of N-,
O- and C-Glycosites in eukaryotic protein sequences.PLoS ONE8(6):e67008
DOI 10.1371/journal.pone.0067008.
Chesnut DB, Moore KD. 1989.Locally dense basis-sets for chemical-shift calculations. Journal of Computationl Chemistry10:648–659DOI 10.1002/jcc.540100507.
Doll F, Buntz A, Spate AK, Schart VF, Timper A, Schrimpf W, Hauck CR, Zumbusch A. 2016.Visualization of protein-specific glycosylation inside living cells.Angewandte
Chemie International55:2262–2266DOI 10.1002/anie.201503183.
Evich M, Stroeva E, Zheng YG, Germann MW. 2015.Effect of methylation on the
side-chain pKa value of arginine.Protein Science25:479–486DOI 10.1002/pro.2838.
Felli IC, Gonnelli L, Pierattelli R. 2014.In-cell13C NMR spectroscopy for the
study of intrinsically disordered proteins.Nature Protocols9:2005–2015 DOI 10.1038/nprot.2014.124.
Fiala R, Czernek J, Sklenář V. 2000.Transverse relaxation optimized triple-resonance
NMR experiments for nucleic acids.Journal of Biomolecular 16:291–302
DOI 10.1023/A:1008388400601.
Garay PG, Martin OA, Scheraga HA, Vila JA. 2014.Factors affecting the computation of the13C shieldings in disaccharides.Journal of Computational Chemistry
35:1854–1864DOI 10.1002/jcc.23697.
Ghasriani H, Belcourt PJF, Sauvé S, Hodgson DJ, Brochu D, Gilbert M, Aubin Y. 2013.
and structure of interferonα2a around the glycosylation site.Journal of Biological
Chemistry288:247–254DOI 10.1074/jbc.M112.413252.
Hansen AL, Kay LE. 2014.Measurement of histidine pKa values and tautomer popula-tions in invisible protein states.Proceedings of the Natural Academy of Sciences of the
United States of America111:1705–1712DOI 10.1073/pnas.1400577111.
Hunter JD. 2007.Matplotlib: a 2D graphics environment.Computing in Science &
Engineering 9:90–95DOI 10.1109/MCSE.2007.55.
Kamath KS, Vasavada MS, Srivastava S. 2011.Proteomic databases and tools to decipher post-translational modifications.Journal of Proteomic 75:127–144 DOI 10.1016/j.jprot.2011.09.014.
Kamieniarz K, Schneider R. 2009.Tools to tackle protein acetylation.Chemistry & Biology16:1027–1029DOI 10.1016/j.chembiol.2009.10.002.
Luo M. 2012.Current chemical biology approaches to interrogate protein
methyltrans-ferases.ACS Chemical Biology7:443–463DOI 10.1021/cb200519y.
Martin OA, Arnautova YA, Icazatti AA, Scheraga HA, Vila JA. 2013. Physics-based method to validate and repair flaws in proteins structures.Proceedings of the National Academy of Sciences of the United States of America110:16826–16831 DOI 10.1073/pnas.1315525110.
McKinney W. 2010.Data structures for statistical computing in Python. In:Proceedings of the 9th Python in science conference, 51–56.
Nishikawa I, Nakajima Y, Ito M, Fukuchi S, Homma K, Nishikawa K. 2010. Com-putational prediction of O-linked glycosylation sites that preferentially map on intrinsically disordered regions of extracellular proteins.International Journal of Molecular Sciences11:4991–5008DOI 10.3390/ijms11124991.
Paik WK, Paik DC, Kim S. 2007.Historical review: the field of protein methylation. Trends in Biochemical Sciences32:146–152DOI 10.1016/j.tibs.2007.01.006.
Pérez F, Granger BE. 2007.IPython: a system for interactive scientific computing. Computing Scientific & Engineering9:21–29DOI 10.1109/MCSE.2007.53.
Rahimi N, Costello CE. 2015.Emerging roles of post-translational modifications in signal transduction and angiogénesis.Proteomics15:300–309
DOI 10.1002/pmic.201400183.
Rosato A, Billeter M. 2015.Automated protein structure determination by NMR.Journal
of Biomolecular NMR62:411–412DOI 10.1007/s10858-015-9966-z.
Salvatier J, Wiecki TV, Fonnesbeck C. 2016.Probabilistic programming in Python using
PyMC3.PeerJ Computer Science2:e55DOI 10.7717/peerj-cs.5.
Schubert M, Walczak MJ, Aebi M, Wider G. 2015.Posttranslational modifications of intact proteins detected by NMR spectroscopy: application to glycosylation.
Angewandte Chemie International54:7096–7100DOI 10.1002/anie.201502093.
Sudmeier JL, Bradshaw EM, Haddad EC, Day RM, Thalhauser CJ, Bullock PA, Bachovchin WW. 2003.Identification of histidine tautomers in proteins by 2D
1H/13Cδ2one-bond correlated NMR.Journal of the American Chemical Society
Theillet FX, Liokatis S, Jost JO, Bekei B, Rose HM, Binolfi A, Schwarzer D, Selenko P. 2012a.Site-specific mapping and time-resolved monitoring of lysine methylation
by high resolution NMR spectroscopy.Journal of the American Chemical Society
134:7616–7619DOI 10.1021/ja301895f.
Theillet FX, Smet-Nocca C, Liokatis S, Thongwichian R, Kosten J, Yoon M-K, Kriwacki RW, Landrieu I, Lippens G, Selenko P. 2012b.Cell signaling, post-translational
protein modifications and NMR Spectroscopy.Journal of Biomolecular NMR
54:217–236DOI 10.1007/s10858-012-9674-x.
Ulrich EL, Akutsu H, Doreleijers JF, Harano Y, Ioannidis YE, Lin J, Livny M, Mading S, Maziuk D, Miller Z, Nakatani E, Schulte CF, Tolmie DE, Wenger RK, Yao H, Markley JL. 2008.BioMagResBank.Nucleic Acids Research36:D402–D408 DOI 10.1093/nar/gkm957.
Van der Walt S, Colbert S, Varoquaux G. 2011.The NumPy Array: a structure for efficient numerical computation.Computing in Science & Engineering 13:22–30 DOI 10.1109/MCSE.2011.37.
Van Rossum G. 1995.Python tutorial, Technical Report CS-R9526. Amsterdam: Centrum voor Wiskunde en Informatics (CWI).
Vila JA, Aramini JM, Rossi P, Kuzin A, Su M, Seetharaman J, Xiao R, Tong L, Monte-lione GT, Scheraga HA. 2008.Quantum chemical13Cαchemical shift calculations
for protein NMR structure determination, refinement, and validation.Proceeding
of the National Academy of Science of the United States of America105:4389–14394 DOI 10.1073/pnas.0807105105.
Vila JA, Arnautova YA, Martin OA, Scheraga HA. 2009.Quantum-mechanics-derived
13Cαchemical shift server (CheShift) for protein structure validation.Proceedings of the National Academy of Sciences of the United States of America106:16972–16977 DOI 10.1073/pnas.0908833106.
Vila JA, Arnautova YA, Vorobjev Y, Scheraga HA. 2011.Assessing the fractions of tautomeric forms of the imidazole ring of histidine in proteins as a function of pH.Proceeding of the National Academy of Sciences of the United States of America
108:5602–5607DOI 10.1073/pnas.1102373108.
Vila JA, Sue S-C, Fraser JS, Scheraga HA, Dyson HJ. 2012.CheShift-2 resolves a local
inconsistency between two X-ray crystal structures.Journal of Biomolecular NMR
54:193–198DOI 10.1007/s10858-012-9663-0.
Waskom M, Botvinnik O, Hobson P, Warmenhoven J, Cole JB, Halchenko Y, Van-derplas J, Hoyer S, Villalba S, Quintero E, Miles A, Augspurger T, Yarkoni T, Evans C, Wehner D, Rocher L, Megies T, Coelho LP, Ziegler E, Hoppe T, Seabold S, Pascual S, Cloud P, Koskinen M, Hausler C, Kjemmett, Milajevs D, Qalieh A, Allan D, Meyer K. 2016.Seaborn: statistical data visualization. Version 0.7.0. DOI 10.5281/zenodo.45133.
Zobel-Thropp P, Gary JD, Clarke S. 1998.Delta-N-methylarginine is a novel posttrans-lational modification of arginine residues in yeast proteins.Journal of Biological