60
INTRODUCTION
Forest stands in the mountain regions of Siberia grow in the boreal zone, which is characterized by strongly continental climate and vast distribution of continuous permafrost which is the major limiting factor for growth of forest vegetation in this huge area. Forests in Siberia develop on seasonally fro-zen soils and are found predominantly in mountain regions. In many cases, they are surrounded by vast steppe and forest-steppe areas and uplands. The
spe-ciic features of forest management in Siberia are: lengthy growing periods to inal harvest age (about 100–120 years), the necessity for sustainable for-est utilization, and the need to actively manage for regeneration of forest resources on burned, logged and insect-damaged areas.
The area of artiicially restored forest lands in Central Siberia (ref. to Krasnoyarsk territory) totals more than 1 million ha at the present time, but only 50 % of them can be rated in good or satisfactory condition. About 10 % of all planted forests have СИБИРСКИЙ ЛЕСНОЙ ЖУРНАЛ. 2016. № 6. С. 60–72
UDC 630*548(1-925.14/.16)+630*434:630*23
DYNAMICS OF FOREST ECOSYSTEMS REGENERATED ON BURNED
AND HARVESTED AREAS IN MOUNTAIN REGIONS OF SIBERIA:
CHARACTERISTICS OF BIOLOGICAL DIVERSITY, STRUCTURE
AND PRODUCTIVITY
I. M. Danilin1, I. A. Tselitan2
1 Federal Research Center Krasnoyarsk Scientiic Center, Russian Academy of Sciences, Siberian Branch,
Solitary Unit V. N. Sukachev Institute of Forest, Russian Academy of Sciences, Siberian Branch Akademgorodok, 50/28, Krasnoyarsk, 660036 Russian Federation
2 Krasnoyarsk Institute of Economics – Branch of Saint-Petersburg Academic University
Kirensky str., 70a, Krasnoyarsk, 660100, Russian Federation
E-mail: [email protected], [email protected] Received 01.02.2016
Complex estimation of forest ecosystems dynamics based on detailing characteristics of structure, growth and productivity of the stands and describing general geographical and biological management options for preserving their biodiversity and sustaining stability are discussed in the paper by describing examples of tree stands restored on burned and logged areas in mountain regions of Siberia. On vast areas in Siberia, characterized as sub-boreal, subarid and with a strongly continental climate, forests grow on seasonally frozen soils and in many cases are surrounded by vast steppe and forest-steppe areas and uplands. Developing criteria for sustainability of mountain forest ecosystems is necessary for forest resource management and conservation. It is therefore important to obtain complex biometric characteristics on forest stands and landscapes and to thoroughly study their structure, biological diversity and productivity. Morphometric methods, Weibull simulation and allometric equations were used to determine the dimensional hierarchies of coenopopulation individuals. Structure and productivity of the aboveground stand components were also studied.
Keywords: forest ecosystems, structure, productivity, burned and harvested areas, restoration, biological diversity, mountain regions, Siberia.
How to cite: Danilin I. M., Tselitan I. A. Dynamics of forest ecosystems regenerated on burned and harvested areas in mountain regions of Siberia: characteristics of biological diversity, structure and productivity // Sibirskij Lesnoj Zurnal (Siberian Journal of Forest Science). 2016. N. 6: 60–72 (in English with Russian abstract).
DOI: 10.15372/SJFS20160606
died due to forest ires, insect outbreaks caused by Siberian silkworm (Dendrolimus sibiricus) or gipsy moth (Lymantria dispar), industrial pollution, etc.
During the period 2000–2015, about 700 thou-sand ha of forest plantations were created in Central Siberia, and 160 thousand ha of those plantations were reclassiied as lands covered by forests. In the last decade, plantations accounted for 18–20 % of the total reforested area. In 2010–2015, forest res-toration work was carried out on about 70 thousand ha, and forest plantations were created on an ad-ditional 11 thousand ha (Varaksin, 2013; Varaksin, Vais, 2016).
STUDY AREAS, MATERIALS AND METHODS
Parameters of forest ecosystems regenerated on burned and commercially harvested areas in Central and Eastern Siberia (Krasnoyarsk Krai, Tuva and Buryatia Republics, Irkutsk Oblast and Zabaikalski Krai) were studied and analyzed (Fig. 1).
The area of non-regenerated burns, logged and dead stands totals nearly 15 million ha in Central and Eastern Siberia. This results in serious environ-mental and economic problems (Organiza csiya…, 2009; Evdokimenko, 2014; Sokolov, 2014; Sokolov et al., 2016) (Fig. 2–4).
Sixty nurseries (15 of them temporary) are available for growing tree seedlings in the area of this study. The total nursery area is 621 ha, in-cluding 375 ha in production. In 2010–2015, these nurseries produced 133.5 million seedlings of pine (Pinus sylvestris), Siberian pine (P. sibirica), larch
(Larix sibirica) and ir (Abies sibirica) (Varak-sin, 2013; Varak(Varak-sin, Vais, 2016). The forested ar-eas where plantations have recently been created, as well as naturally regenerated in Central Siberia are highly productive pine and larch stands that are commercially valuable and accessible by vehicles (Fig. 5–7).
During the past 50 years, these stands were sub-jected to intensive cutting. Commercial inal clear cuts by heavy-duty harvesters and chain saws are a regular practice here. Heavy skidders usually drag harvested timber to landings, which results in considerable disturbance to ground cover and soil erosion. Parent uncut stands, harvested areas and plantations all suffer from frequent ires (Tcsvetkov, 2005; Organizacsiya…, 2009; Sokolov et al., 2016).
Forest regeneration work is not carried out in areas of winter logging, which are as a rule inac-cessible in springtime, and on burned areas because of the lack of special engineering equipment for their development and for preparation of the sites for planting. On winter cuts, enough coniferous un-derstory is usually kept for subsequent forest stand renewal. Since 1982, management practices to en-courage natural forest restoration have been carried out on 1678 thousand ha, including 629 thousand ha in the last 10 years.
Studying growth dynamics, stand structure and biomass accumulation of such stands is important to understand and predict forest development both in terms of forest management improvement and envi-ronmental impact to forest ecosystems (Sokolov et al., 1998, 2003; Danilin, 2009a, b).
The stand structure, dynamics of organic mat-ter and biodiversity serve as indices for stabil-ity of forest ecosystems. Studying stand structure and growth makes it possible to deine permissible limits of management practices for affecting eco-systems and determining their effect on the envi-ronment. Permanent sample plots were established using conventional forest inventory and biometric techniques (Danilin, 1995, 2009a, b; Buzykin et al., 2002; Usoltsev, 2007). All trees on the sample plots were measured and mapped to establish their size-dependent position in the phytocenosis and to de-termine structure of the aboveground biomass and diversity of forest vegetation.
RESULTS AND DISCUSSION
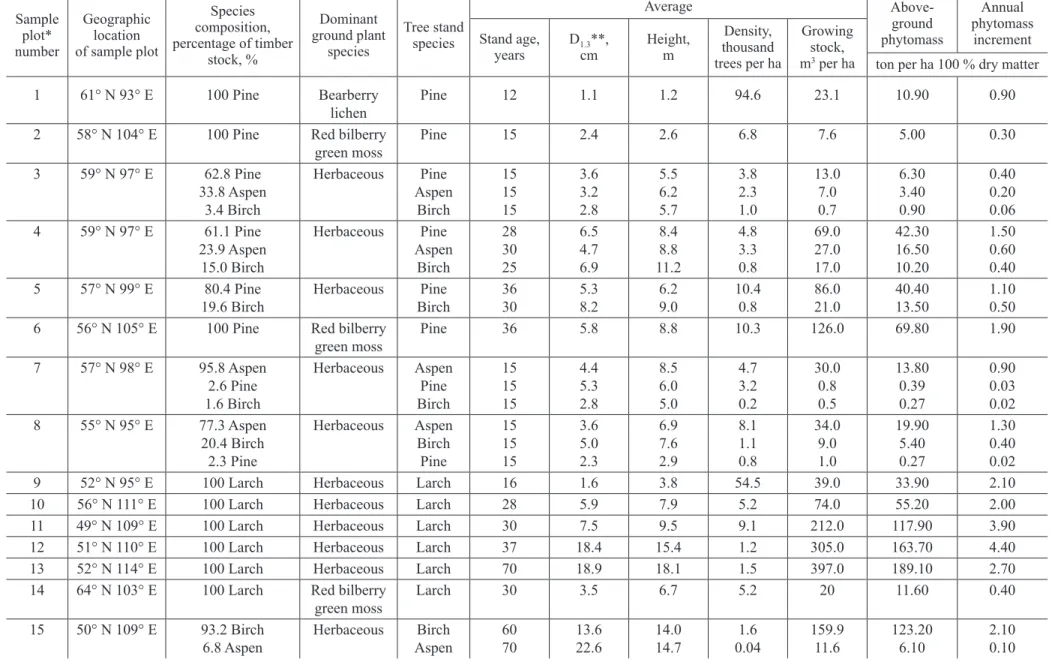
The basic characteristics of the research sample plots are described in the Table 1. The forest cov-er of the expcov-erimental forest sites included stands of even-aged pine as well as both pure and mixed Fig. 1. Geographic location of the research sites within
62 СИБИРСКИЙ ЛЕСНОЙ ЖУРНАЛ. № 6. 2016 I. M. Danilin, I. A. Tselitan
Fig. 2.
Fig. 3.
Fig. 4.
Fig. 5.
Fig. 6.
stands of larch and birch-aspen belonging to dif-ferent forest types and natural formation patterns/ series. Pure young pine stands occurred mostly on river terraces belong to the pine-bearberry-lichen (Pinus sylvestris – Arctostaphylos uva-ursi – Clad-ina sylvatica) and pine-red bilberry-green moss (P. sylvestris – Vaccinium vitis idaea – Pleurozium schreberi) forest community types. The tree density in these stands varied from 1.6 to 94.6 thousand trees per ha. Tree mortality was moderate.
Mixed pine, aspen and aspen-birch stands were common on lat interluves with loamy soils. These belong to the pine-aspen-birch-red bilberry-herba-ceous (Pinus sylvestris – Populus tremula – Betula pendula – Vaccinium vitis idaea – Calamagrostis arundinacea – Carex macroura – Pulsatilla pat-ens – Trifolium lupinaster – Bupleurum aureum – Geranium sylvaticum) forest community type, and the density of these stands varied from 6.4 to 11.2 thousand trees per ha.
The study was also conducted where larch stands occur in a range of altitudinal belts. These sites are located approximately at 51–56° N, 95– 115° E. All these areas are dominated by larch (Larix sibirica and L. gmelinii) stands with herba-ceous ground cover. These stands are usually found in the lower portions of mountain slopes in Eastern Siberia (Evenkia, Irkutsk and Zabaykal’skiy krai). These are highly productive stands, commercially valuable, and accessible by vehicles. Over the last 30 years, these stands were subjected to intensive cutting. Commercial inal cuts are practiced here. The harvested wood is usually dragged by tractors leading to considerable disturbance of ground cover and soils. After cutting, logging residue is placed into piles that are evenly distributed over the cut area and left untreated. In unlogged stands, under-story numbers vary from 2400 to 5000 young larch
per ha. Their quality and distribution depend on their age, basal area, and the area occupied by the parent stand. In logged areas, surviving understory averages, as a rule, from 400 to 600 trees per ha. Both parent larch stands and cut areas suffer from frequent ires that enhance natural regeneration.
In small clear-cuts (up to 5 ha), natural regen-eration is usually abundant. Larch seeds germinate annually, and their resistance to environmental stresses is relatively high. In the irst 5–6 years af-ter cutting, the number of seedlings usually exceeds 50 thousand per ha, providing favorable conditions for regeneration of the harvested area. By the time the canopy of the young generation closes (in about 15 years), the herbaceous cover and litter layer characteristic of the previous stands are completely regenerated.
In this study, the structural relationships between biomass fractions changed with increasing average stand age and density. In dense stands, tree crowns were best developed. Consequently, the total crown biomass of dense, young stands was greater than in older stands with lower tree density. This may be due to the fact that trees at early development stages are able to make maximum use of their assimilation apparatus and branching systems, competing with equal success for light, nutrients, and water.
Empirical curves of the tree distribution series were noticeably steep, right-side-asymmetric and stretched (lengthened out). Parameter variation co-eficients ranged from 43.4 to 73.9 %. This wide parameter variation can be attributed to distinct differences in tree height at the initial stages of the forest phytocoenosis development and also the root and crown competition for nutrients, sunlight and water. For all morphometric parameters, distribu-tion appeared to be synchronous (autocorreladistribu-tion). Adequate and effective smoothing of the empirical
Fig. 2. Fir (Abies sibirica Ledeb.) forest killed by catastrophic crown ire on the Manskii forest district of Krasnoyarsk krai in 2006 (total area burned was more than 50 000 ha).
Fig. 3. Scotch pine (Pinus sylvestris L.) commercial clear cut harvested in 2015 on the Ust’-Ilimsk forest district of Irkutsk oblast.
Fig. 4. Larch (Larix sibirica Ledeb.) forest severely damaged by gypsy moth (Lymantria dispar) near Tchagytai lake in Baikhaak forest district of the Tuva Republic.
Fig. 5. Burned area replanted by pine (Pinus sylvestris) seedlings on the Manskii forest district of Krasnoyarsk krai. Fig. 6. 10-year-old successional birch (Betula platyphylla) and aspen (Populus tremula) forest naturally regenerated after catastrophic crown ire in a mature ir (Abies sibirica) and spruce (Picea obovata) stand on the Manskii forest district of Krasnoyarsk krai.
64
СИБИР
СКИЙ ЛЕСНОЙ Ж
УРНАЛ. № 6. 2016
Table 1. Structure and aboveground phytomass of forest tree stands
Sample plot* number
Geographic location of sample plot
Species composition, percentage of timber
stock, % Dominant ground plant species Tree stand species Average Above-ground phytomass Annual phytomass increment Stand age,
years D1.3cm**, Height, m
Density, thousand trees per ha
Growing stock,
m3 per ha ton per ha 100 % dry matter
1 61° N 93° E 100 Pine Bearberry
lichen Pine 12 1.1 1.2 94.6 23.1 10.90 0.90
2 58° N 104° E 100 Pine Red bilberry
green moss Pine 15 2.4 2.6 6.8 7.6 5.00 0.30
3 59° N 97° E 62.8 Pine
33.8 Aspen 3.4 Birch Herbaceous Pine Aspen Birch 15 15 15 3.6 3.2 2.8 5.5 6.2 5.7 3.8 2.3 1.0 13.0 7.0 0.7 6.30 3.40 0.90 0.40 0.20 0.06
4 59° N 97° E 61.1 Pine
23.9 Aspen 15.0 Birch Herbaceous Pine Aspen Birch 28 30 25 6.5 4.7 6.9 8.4 8.8 11.2 4.8 3.3 0.8 69.0 27.0 17.0 42.30 16.50 10.20 1.50 0.60 0.40
5 57° N 99° E 80.4 Pine
19.6 Birch Herbaceous BirchPine 3630 5.38.2 9.06.2 10.40.8 86.021.0 40.4013.50 1.100.50
6 56° N 105° E 100 Pine Red bilberry
green moss Pine 36 5.8 8.8 10.3 126.0 69.80 1.90
7 57° N 98° E 95.8 Aspen
2.6 Pine 1.6 Birch Herbaceous Aspen Pine Birch 15 15 15 4.4 5.3 2.8 8.5 6.0 5.0 4.7 3.2 0.2 30.0 0.8 0.5 13.80 0.39 0.27 0.90 0.03 0.02
8 55° N 95° E 77.3 Aspen
20.4 Birch 2.3 Pine Herbaceous Aspen Birch Pine 15 15 15 3.6 5.0 2.3 6.9 7.6 2.9 8.1 1.1 0.8 34.0 9.0 1.0 19.90 5.40 0.27 1.30 0.40 0.02
9 52° N 95° E 100 Larch Herbaceous Larch 16 1.6 3.8 54.5 39.0 33.90 2.10
10 56° N 111° E 100 Larch Herbaceous Larch 28 5.9 7.9 5.2 74.0 55.20 2.00
11 49° N 109° E 100 Larch Herbaceous Larch 30 7.5 9.5 9.1 212.0 117.90 3.90
12 51° N 110° E 100 Larch Herbaceous Larch 37 18.4 15.4 1.2 305.0 163.70 4.40
13 52° N 114° E 100 Larch Herbaceous Larch 70 18.9 18.1 1.5 397.0 189.10 2.70
14 64° N 103° E 100 Larch Red bilberry
green moss Larch 30 3.5 6.7 5.2 20 11.60 0.40
15 50° N 109° E 93.2 Birch
6.8 Aspen Herbaceous AspenBirch 6070 13.622.6 14.714.0 0.041.6 159.911.6 123.206.10 2.100.10
* Sample plot size was 1000 m2 (20 × 50 m); ** D
1.3 – diameter at breast height (1.3 m above tree base).
I. M. Danilin, I.
A. T
curves was provided by the Weibull distribution function of probability density with three basic pa-rameters – b, c and q: f (x) = c/b·[(x – q)/b]c–1 · e – – [(x – q)/b]c, 0 ≤ x < ∞, b > 0, c > 0, q > 0, where, b – parameter of scale, c – parameter of form,
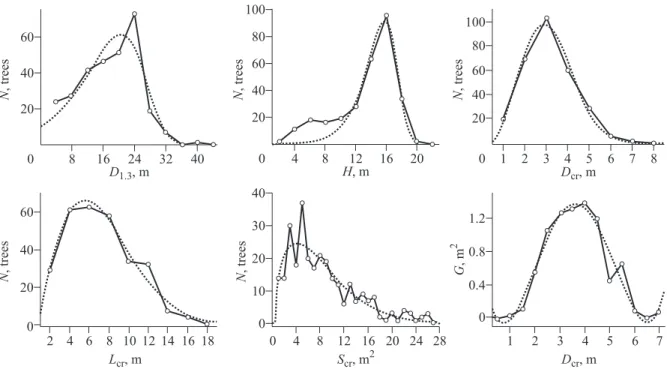
q – parameter of move (location), e – base for Eiler’s natural logarithm (Statistica…, 2015) (Fig. 8, Table 2).
The Weibull distribution, as it has been shown earlier by a number of studies (Mason, 1968; Falls, 1970; Burkhart, 1971; Bailey, Dell, 1973; Svalov, 1982; Ganina, 1984; Kaplunov, 2001; Danilin, 2009a, b), makes it possible to obtain adequate, re-liable approximations of the distribution of trees by stem thickness (DBH) as well as by the other mor-phometric parameters (tree height, crown length and crown diameter), adequately smoothing cenotic hierarchy of trees in the forest stand.
Morphometric parameters of the trees were found to be closely correlated (0.51 R ≤ 0.98; P < 0.05) (Table 3, 4).
Correlation between the sample tree morpho-metric and biomass parameters was also consist-ently high (0.70 ≤ R ≤ 0.99; P < 0.05) (Table 5, 6).
These correlations are normally in accordance with law of allometry (Enquist et al., 2002; West et al., 1999), valid for all tree species globally and proved by numerous studies throughout the world (Yandle, Wiant, 1981; Hagihara et al., 1993;
Dani-lin, 1995, 2009a; Ter-Mikaelian, Korzukhin, 1997; Niklas et al., 2003; Kaitaniemi, 2004; Pilli et al., 2006; Usoltsev, 2007).
Correlation of the biomass fractions with stem diameter (DBH) was closer than with tree height and crown length. This is due to non-uniformity of the vertical tree layer structure and signiicant varia-tion in tree heights. The maximum aboveground bi-omass of the larch overstory, the major stand com-ponent, was found to be 189 100 kg per ha (sample plot 13). Of the total biomass, 71 % is accounted for by stems, of which timber and bark make up 58 and 13 %, respectively. Nine percent of the total bio-mass is accounted for by the main (skeleton) tree branches (more than 1 cm in diameter at the base), 8 % by small branches (less than 1 cm in diameter at the base), 8 % by needles, and 3.8 % by dead branches.
Comparisons of the above mentioned data on the stem analysis of larch trees and their biomass structure (look Tables 1 and 6) with other studies in Siberia (Schulze et al., 1995; Shchepashchenko et al., 1998; Alexeyev et al., 2000; Shvidenko et al., 2000; Utkin еt al., 2001; Fuchen еt al., 2002; Usoltsev, 2007), have shown a high level of accord-ance, which indicates a possibility to use uniied recursive approximations for aboveground biomass assessment in larch forest ecosystems of Northern Eurasia.
Fig. 8. Empirical (solid line) and Weibull (dotted line) distribution of larch trees by steps of morphometric indexes of the stems and crowns: N – number of trees; D1.3 – stem diameter at breast height (1.3 m above tree base); H – tree height; Dcr – crown diameter; Lcr – crown length; Scr – crown area; G – stem cross section area 1.3
66 СИБИРСКИЙ ЛЕСНОЙ ЖУРНАЛ. № 6. 2016 Biomass increment is a more objective index for
production processes and ecosystem stability than is total biomass. Over the past 5 years, current annual increment of diameter and height increased consist-ently with increasing tree size. The maximum aver-age annual biomass increment was found to be 4.4 and 3.9 ton per ha (100 % dry matter) on sample plots 11 and 12 (look Table 1).
Forest ires and clear-cuts signiicantly impact the structure and diversity of plant groundcover, which is characterized by highly mosaic patterns and forms in communities of varying shapes, from
round to stretched, with both straight and twisting contours.
After forest ires in the northern mountains, plant groundcover in naturally regenerated larch forests (look Table 1, sample plot 14) consists predomi-nantly of low shrubs such as Vaccinium uligino-sum L., V. vitis-idaea L., Rubus arcticus L., Ledum palustre L., Arctous alpina (L.) Nied., Arctostaphy-los uva-ursi (L.) Spreng., Empetrum nigrum L., with green mosses Hylocomium splendens (Hedw.) Schimp. in B. S. G., Pleurozium schreberi (Brid.) Mitt., Dicranum congestum Brid. dominating the Тable 2. Coeficients for Weibull smoothed distributions (y = weibull (x, b, c, t)·a) of the larch (Larix sibirica) trees
by morphometric indexes of stems and crowns at 95 % conidence level (valid for sample plot 12)
Parameter Coeficient Standard error t-value p-value Conidence level
lower upper
D1.3 (R2 = 0.884) b c t a 741.717 99.990 –721.135 1229.599 22313.970 2997.530 22314.910 191.360 0.033 0.033 –0.032 6.426 0.97 0.97 0.98 0.00 –52022.400 –6988.100 –53487.500 777.100 53505.860 7188.030 52045.240 1682.100
H (R2 = 0.928)
b c t a 200.645 99.980 –184.857 497.152 3887.131 1934.713 3887.223 50.049 0.052 0.052 –0.048 9.933 0.96 0.96 0.96 0.00 –8990.960 –4474.890 –9376.680 378.810 9392.249 4674.850 9006.964 615.500 Dcr (R2 = 0.988)
b c t a 3.0312 2.597 0.393 283.586 0.360 0.389 0.376 12.951 8.420 6.673 1.045 21.897 0.00 0.00 0.36 0.00 2.032 1.517 –0.651 247.628 4.031 3.678 1.436 319.544
Lcr (R2 = 0.970)
b c t a 7.183 1.849 0.900 580.206 0.845 0.309 0.934 32.436 8.498 5.980 0.964 17.88 0.00 0.00 0.38 0.00 5.011 1.054 –1.500 496.826 9.356 2.644 3.300 663.585 S
cr (R2 = 0.822) b c t a 8.299 1.432 0.608 278.405 0.764 0.195 0.657 21.225 10.858 7.341 0.925 13.117 0.00 0.00 0.36 0.00 6.7182 1.029 –0.752 234.497 9.881 1.836 1.968 322.313 G = f Dcr (G = a + a1 Dcr + a2 D2cr + a3 D3cr + a4 D4cr) (R2 = 0.945)
a a 1 a 2 a 3 a 4 0.450 –1.488 1.297 –0.300 0.021 0.342 0.584 0.302 0.060 0.004 1.317 –2.550 4.299 –5.042 5.222 0.22 0.03 0.00 0.00 0.00 –0.323 –2.809 0.615 –0.435 0.012 1.223 –0.168 1.980 –0.165 0.030
Where: D1.3 – stem diameter at breast height (1.3 m above tree base); H – tree height; Dcr – crown diameter; Lcr – crown length;
Scr – crown area; G – stem cross section area 1.3 m above tree base, and further the same in other tables.
lower layers, lichens represented by Peltigera aph-thosa (L.) Willd., Cladonia gracilis (L.) Willd., Cladina rangiferina (L.) Nyl., and grasses Саrех globularis L. and Pyrola incarnata (DC.) Freyn. The communities on this site were determined to be from 0.5 to 100 m2 in area. When comparing
structure of the groundcover with the distribution patterns of the tree overstory and understory, we were able to identify certain trends. The V. uligino-sum + Hylocomium splendens, Pleurozium schre-beri plant community that forms the background is distributed in well-sunlit openings. However, the larch overstory does not suppress the lower layers of the phytocoenosis because the crowns, even in tree biogroups, are naturally thinned. Nanorelief and the diversity of soil microconditions mainly control the community’s shape, size and species composition. V. uliginosum + Arctous erhytrocarpa communities occupy level sites. The V. uliginosum + V. vitis-idaea community is found on raised
na-norelief elements and in microsites of partially or completely decomposed downed wood dominated by humic and peat soil. Even where sun radiation is intense, the V. uliginosum + V. vitis idaea commu-nity is limited to vegetation-covered nanohillocks. Ledum palustre + Hylocomium splendens, Ledum palustre, A. erhytrocarpa, and A. erhytrocarpa + Hylocomium splendens communities occur mostly in small, wet microdepressions with humic podzols. Some communities, such as V. uliginosum + V. vitis-idaea + Hylocomium splendens + Arctous sp., V. uliginosum + Arctous sp., and V. uliginosum + Em-petrum nigrum + Arctous sp. with Arctostaphylos uva-ursi, are of limited extent.
The groundcover biomass totaled 5818 kg per ha (100 % dry weight) for sample plot 14. Of this, 87 % (5055 kg per ha) is accounted by low shrubs, which can be listed in order of decreasing biomass (kg per ha) as follows: 4179 Vaccinium uliginosum; 335 V. vitis-idaea; 299 Rubus arcticus; 169 Ledum Table 3. Correlation matrix (R) for relationship between tree morphometric indices at larch (Larix sibirica) tree stand (sample plot 12)
Index D1.3 H Dcr Lcr Scr
D1.3 H Dcr Lcr S cr Average statistical Standard deviation Number of observations
1.00 0.86 0.83 0.70 0.77 17.46 7.37 288 0.86 1.00 0.60 0.65 0.51 13.34 3.95 288 0.83 0.60 1.00 0.72 0.98 3.07 1.12 288 0.70 0.65 0.72 1.00 0.69 6.96 3.22 288 0.77 0.51 0.98 0.69 1.00 8.37 5.95 288
Table 4. The parameters of multiply regression equations between larch (Larix sibirica) trees’ forest inventory and morphometric indices at 95 % conidence level (signiicance level a < 0.05) (sample plot 12)
Parameter Coeficient of the coeficientStandard error t-value p-value Conidence level
lower upper
D1.3 = exp (a + a1 H + a2Dcr) (R2 = 0.734)
a a 1 a 2 1.3826 0.1079 –0.0141 0.081 0.005 0.008 17.096 21.381 –1.888 0.00 0.00 0.06 1.223 0.098 –0.029 1.542 0.118 0.001 D1.3 = exp (a + a1 H + a2Lcr) (R2 = 0.733)
a a 1 a 2 1.3801 0.1076 –0.0051 0.081 0.005 0.003 17.045 21.332 –1.649 0.00 0.00 0.10 1.221 0.098 –0.011 1.540 0.118 0.001 S
cr= exp (a + a1 D1.3 + a2H) (R2 = 0.675)
68
СИБИР
СКИЙ ЛЕСНОЙ Ж
УРНАЛ. № 6. 2016
Table 5. Morphometric parameters and aboveground phytomass of the test larch (Larix sibirica) trees (sample plot 12)
Tree num-ber
Age, years Dcm1.3,
H,
m Dmcr,
Lcr,
m
Scr,
m2
Stem volume, m3
Bark volume,
m3
Tree phytomass by fractions, kg absolutely dry matter
with
bark without bark Tree total Stem total
Stem
Alive part of crown
total
Crown
Wood Bark Skeleton branches
∅ > 1 cm
Needled branches
∅ <1 cm
Current year
shoots Needle
Dead branches 114 1 318 107 87 169 103 118 246 dead 44 43 39 42 43 41 40 33 24 31.0 27.4 23.5 19.8 15.9 12.0 8.1 4.5 4.7 17.8 17.6 17.3 16.8 16.2 12.6 9.0 6.6 4.2 5.8 4.7 3.6 3.1 2.4 2.3 2.0 0.9 – 13.8 11.5 9.1 8.2 7.2 5.8 4.3 3.7 – 26.4 17.3 10.2 7.5 4.5 4.2 3.1 0.6 – 0.6187 0.5084 0.3980 0.2884 0.1788 0.1024 0.0259 0.0158 0.0056 0.4747 0.3941 0.3135 0.2279 0.1423 0.0808 0.0192 0.0117 0.0042 0.1440 0.1143 0.0845 0.0605 0.0365 0.0216 0.0067 0.0041 0.0014 333.0 271.5 209.8 145.7 81.3 46.8 12.3 4.6 2.4 272.0 228.9 185.7 128.5 71.2 40.8 10.3 3.1 2.0 233.3 195.7 158.0 107.8 57.6 32.7 7.8 2.4 1.6 38.7 33.2 27.7 20.7 13.6 8.1 2.5 0.7 0.4 61.0 42.6 24.1 17.2 10.1 6.0 2.0 1.5 – 41.7 28.1 14.5 9.6 4.7 2.8 0.9 0.7 – 10.9 7.7 4.4 3.8 3.1 1.8 0.5 0.3 – 0.57 0.56 0.55 0.35 0.14 0.09 0.04 0.03 – 7.8 6.2 4.6 3.4 2.2 1.3 0.6 0.5 – 41.1 24.5 7.5 6.4 5.3 3.3 1.2 0.1 0.4
Table 6. Correlation (R) between morphometric indices and phytomass fractions of the test larch (Larix sibirica, L. gmelinii) trees (sample plots 1–15)
Parameter Age D1.3 H Dcr Lcr Scr Stem volume with bark Phytomass total Stem Wood Bark Crown
Branches Current
year shoots Needle branchesDead
∅ > 1 cm ∅ < 1 cm
Age 1.00 0.79 0.89 0.51 0.59 0.43 0.73 0.70 0.72 0.71 0.75 0.47 0.40 0.61 0.36 0.49 0.49
D1.3 0.79 1.00 0.95 0.87 0.91 0.84 0.95 0.95 0.94 0.94 0.94 0.87 0.82 0.93 0.81 0.87 0.82
H 0.89 0.95 1.00 0.74 0.81 0.67 0.86 0.85 0.86 0.85 0.85 0.71 0.64 0.78 0.65 0.71 0.68
Dcr 0.51 0.87 0.74 1.00 0.98 0.96 0.78 0.81 0.78 0.78 0.76 0.90 0.85 0.89 0.89 0.94 0.80
L
cr 0.59 0.91 0.81 0.98 1.00 0.94 0.81 0.83 0.81 0.81 0.78 0.91 0.86 0.90 0.89 0.94 0.81
S
cr 0.43 0.84 0.67 0.96 0.94 1.00 0.79 0.83 0.79 0.80 0.75 0.96 0.94 0.91 0.91 0.96 0.89
Stem volume with bark 0.73 0.95 0.86 0.78 0.81 0.79 1.00 1.00 1.00 1.00 0.99 0.88 0.85 0.93 0.74 0.83 0.87
Phytomass total 0.70 0.95 0.85 0.81 0.83 0.83 1.00 1.00 1.00 1.00 0.98 0.91 0.88 0.94 0.78 0.85 0.89
Stem 0.72 0.94 0.86 0.78 0.81 0.79 1.00 1.00 1.00 1.00 0.98 0.88 0.85 0.92 0.74 0.82 0.87
Wood 0.71 0.94 0.85 0.78 0.81 0.80 1.00 1.00 1.00 1.00 0.98 0.89 0.86 0.92 0.74 0.82 0.88
Bark 0.75 0.94 0.85 0.76 0.78 0.75 0.99 0.98 0.98 0.98 1.00 0.85 0.79 0.93 0.73 0.82 0.81
Crown 0.47 0.87 0.71 0.90 0.91 0.96 0.88 0.91 0.88 0.89 0.85 1.00 0.99 0.96 0.90 0.95 0.94
Branches ∅ > 1 cm 0.40 0.82 0.64 0.85 0.86 0.94 0.85 0.88 0.85 0.86 0.79 0.99 1.00 0.90 0.86 0.89 0.96
Branches ∅ < 1 cm 0.61 0.93 0.78 0.89 0.90 0.91 0.93 0.94 0.92 0.92 0.93 0.96 0.90 1.00 0.87 0.95 0.87
Current year shoots 0.36 0.81 0.65 0.89 0.89 0.91 0.74 0.78 0.74 0.74 0.73 0.90 0.86 0.87 1.00 0.96 0.74
Needle 0.49 0.87 0.71 0.94 0.94 0.96 0.83 0.85 0.82 0.82 0.82 0.95 0.89 0.95 0.96 1.00 0.81
Dead branches 0.49 0.82 0.68 0.80 0.81 0.89 0.87 0.89 0.87 0.88 0.81 0.94 0.96 0.87 0.74 0.81 1.00
I. M. Danilin, I.
A. T
palustre; 38 Arctous erythrocarpa; 27 Empetrum nigrum and 8 Arctostaphylos uva-ursi. Eight per-cent (448 kg per ha) of the total groundcover bio-mass is made up of mosses, namely Hylocomium splendens, Pleurozium schreberi and Dicranum congestum accounting for 200, 137 and 111 kg per ha, respectively. Lichens make up 5 % (288 kg per ha) of the total ground plant biomass. These include Peltigera aphthosa (179 kg per ha), Cladonia gra-cilis (58 kg per ha) and Cladina rangiferina (51 kg per ha). The grass biomass proportion is relatively small and does not exceed 0.5 % (27 kg per ha), represented by Carex globularis and Pyrola incar-nata, 24 and 3 kg per ha, respectively.
CONCLUSIONS
If the process of succession follows its natu-ral course and the existing rate of biomass incre-ment is maintained, these forests can be expected to regain their original state (i. e., a relatively stable climax forest ecosystem whose components are in balance with the environment) in about 100 years for the pure larch, pine and mixed stands, and about 50 years for birch and aspen phytocenosis. How-ever, this time period would become much longer if disturbances such as ire, insect outbreaks or wind fall occurred. In this case, if phytocenosis is partly or completely destroyed, succession would take the form of replacement of coenopopulations: second-ary aspen and birch stands on lat interluves with loamy soils, or the native ediicator tree species on river terraces with sands and loamy sands.
With no regeneration of birch, larch or pine due to poor silvicultural practices, seed-crop failures, droughts, forest ires or after logging, succession may take the course of forming meadow or steppe ecosystems. Such development is undesirable be-cause it decreases forested area, reduces protective and environmental functions of the ecosystem and reduces tolerance to harmful environmental factors. Speciic forest management activities such as thin-ning can considerably reduce the time necessary for a native phytocenosis to fully recover. From the bio-logical viewpoint, thinning is useful because about 50 % of wood produced in an unthinned forest stand dies by the time it reaches maturity. Extraction of some dead and injured trees changes the insolation and temperature conditions, as well as those of hu-midity and soil moisture, and the decomposition rate of the forest loor organic layer increases. The con-ditions for tree growth and development improve, and trees drop their dead branches and accumulate wood that is free of knots. These factors facilitate
higher productivity and consequently induce higher resistance to pests in the phytocenosis. Moreover, the increased yield of valuable conifer wood results in higher economic returns and decreases the coni-fer cultivation period.
Thinning, however, is a complex biotechnical measure that needs careful planning and implemen-tation at each site. Before thinning, account should be taken of the biological characteristics of the stand, i.e. its composition, age, density and produc-tivity, as well as site conditions, such as topography, soils, climate, the rate and character of anthropo-genic disturbance, wildire dynamics, etc.
In the event of phytocenosis succession con-trolled by man (anthropogenic succession) it is preferable for the forest ecosystem to regenerate through the native ediicator species to form the original uneven-aged (of several generations) pine or larch coenopopulation with birch and aspen ad-mixture (mosaic) which is more resistant to ire, ecologically stable and productive for longer eco-nomic usage. After logging or ire breakdown of forest ecosystem its place might also become oc-cupied by an analogous but different ecosystem – a forest plantation.
Acknowledgments. This work was funded by the Siberian Branch of the Russian Academy of Sci-ences. The authors highly appreciated Dr. Peyton W. Owston for his critical reading, scientiic and language editing, suggestions and discussion on an earlier version of this manuscript. We also thank associate editors and three anonymous reviewers for their valuable comments that helped us to im-prove the quality of this article and clarify some of the important results with prior empirical and theoretical evidences.
REFERENCES
Alexeyev V. A., Birdsey R. A., Stakanov V. D., Korotkov I. A. Carbon storage in the Asian boreal forests of Russia In E. S. Kasischke, B. J. Stocks (Eds.). Fire, climate change, and carbon cycling in the boreal forest. Ecol. Stud. Ser. New York: Springer-Verlag, 2000. P. 239–257.
Bailey R. L., Dell T. R. Quantifying diameter distri-butions with the Weibull distribution // For. Sci. 1973. V. 19. P. 97–104.
Burkhart H. E. Slash pine plantation yield estimates based on diameter distribution: an evaluation // For. Sci. 1971. V. 17. N. 4. P. 452–453.
Buzykin A. I., Pshenichnikova L. S., Sukhovol’skii V. G.
70 СИБИРСКИЙ ЛЕСНОЙ ЖУРНАЛ. № 6. 2016
Novosibirsk: Nauka, 2002. 152 p. (in Russian with English title, summary and contents).
Danilin I. M. Structure and biomass of larch stands regener ating naturally after clear-cut logging // Water, Air and Soil Pollu t. 1995. V. 82. N. 1–2. P. 125–131.
Danilin I. M. Structural and functional organization of a larch phytocenosis in a postire progressive succession in the north of Central Siberia // Contemp. Probl. Ecol. 2009a. V. 2. N. 1. P. 55–65.
Danilin I. M. Struktura poslepozarnykh bereznyakov na yuznom predele rasprostraneniya (The struc-ture of post-ire birch forests at their southern range) // Lesovedenie (Rus. J. For. Sci.). 2009b. N. 3. P. 20–31 (in Russian with English abstract).
Enquist B. J. Universal scaling in tree and vascular plant allometry: toward a general quantitative theory linking plant form and function from cells to ecosystems // Tree Physiol. 2002. V. 22. N. 15. P. 1045–1064.
Evdokimenko M. D. Pirogennye transformacsii baikalskih lesov. Retrospektiva i sovremennost’ (Pyrogenic transformations of the Baikal lake forests. Retrospective and contemporary issues) // Sibirskij Lesnoj Zurnal (Sib. J. For. Sci.). 2014. N. 3. P. 64–75 (in Russian with English abstract).
Falls L. W. Estimation of parameters in compound Weibull distribu tions // Technometrics. 1970. V. 12. P. 399–407.
Fuchen S., Laiye Q., Wenjie W., Yojiro M., Takayoshi K., Kaichiro S. Aboveground biomass and productivity of Larix gmelinii forests in Northeast China // Euras. J. For. Res. 2002. N. 5. P. 23–32.
Ganina N. V. Raspredelenie derev’ev po diametru s pomosch’yu funkscii Veibulla (Tree diameter distribution with the Weibull function) // Lesovedenie (Rus. J. For. Sci.). 1984. N. 2. P. 26– 32 (in Russian with English abstract).
Hagihara A., Yokota T., Ogawa K. Allometric relations in hinoki (Chamaecyparis obtusa (Sieb. et Zucc.) Endl.) trees // Bull. Nagoya Univ. Forestry. 1993. N. 12. P. 11–29.
Kaitaniemi P. Testing allometric scaling laws // J. Theor. Biol. 2004. V. 228. P. 149–153.
Kaplunov V. Ya. Sopryazennost’ raspredelenii derev’ev po poperechniku kron i diametru stvolov (Association of tree distribution by crown cross section and stem diameter) // Lesovedenie (Rus. J. For. Sci.). 2001. N. 3. P. 63–69 (in Russian with English abstract).
Organizacsiya ustoichivogo lesopolzovaniya v Kras-noyarskom krae (Management of sustainable forestry in Krasnoyarsk krai) / I. V. Semechkin (Ed.). Novosibirsk: Rus. Acad. Sci., Sib. Br. Publ. House, 2009. 361 p. (in Russian with English title, summary and contents).
Mason T. J. Maximum likelihood estimation in a mixture of two Weibull distributions. MSc. Thesis, Univ. Georgia, USA, 1968. 135 p.
Niklas K. J., Midgley J. J., Enquist B. J. A general model for mass-growth-density relations across tree-dominated communities // Evolut. Ecol. Res. 2003. N. 3. P. 459–468.
Pilli R., Anfodillo T., Carrer M. Towards a functional and simpliied allometry for estimating forest biomass // For. Ecol. Manag. 2006. V. 237. N. 1–3. P. 583–593.
Shchepashchenko D., Shvidenko A., Nilsson S.
Phytomass (live biomass) and carbon of Siberian forests // Biomass and Bioenergy. 1998. V. 14. N. 1. P. 21–31.
Schulze E. D., Schulze W., Kelliher F. M., Vygod-skaya N. N., Ziegler W., Kobak I., Koch H., Arneth A., Kusnetsova W. A., Sogatchev A., Issajev A., Bauer G., Hollinger D. Y. Aboveground biomass and nitrogen nutrition in a chronose-quence of pristine Dahurian Larix stands in eastern Siberia // Can. J. For. Res. 1995. V. 25. N. 6. P. 943–960.
Shvidenko A. Z., Nilsson S., Stolbovoi V. S., Gluck M., Shchepashchenko D. G., Rozhkov V. A. Aggrega-ted estimation of basic parameters of biological production and carbon budget of Russian terrest-rial ecosystems. 1. Stocks of plant organic mass // Rus. J. Ecol. 2000. V. 31. Iss. 6. P. 371–378.
Sokolov V. A. Osnovy organizacsii ustoichivogo lesopolzovaniya (Fundamentals for sustainable forest use) // Sibirskij Lesnoj Zurnal (Sib. J. For. Sci.). 2014. N. 1. P. 14–24 (in Russian with English abstract).
Sokolov V. A., Danilin I. M., Semetchkin I. V., Far ber S. K., Bel’kov V. V., Burenina T. A., Vtyurina O. P., Onuchin A. A., Raspopin K. I., Sokolova N. V., Shishikin A. S. Siberian expec-tations: An overview of regional forest policy and sustainable forest management. Portland, OR: World Forest Institute, 2003. 67 p.
Sokolov V. A., Danilin I. M., Farber S. K., Bender-skii Yu. G., Buzykin А. I., Varaksin G. S., Vladyshevskii D. V., Vtyurina О. P., Еfremov S. P., Zabelin А. I., Ziganshin R. А., Ivanov V. V., Коropachinskii Yu. I., Мikhalev Yu. А., Оnu- chin А. А., Pleshikov F. I., Polyakov V. I., Pfannenshtil’ I. V., Raspopin K. I., Semetchkin I. V., Sokolova N. V., Soldatov V. V., Furyaev V. V., Shishikin А. S. Problemy ustoichivogo lesopol-zovaniya (Problems of sustainable forestry). Krasnoyarsk: Rus. Acad. Sci., Sib. Br. Publ. House, 1998. 225 p. (in Russian with English title, summary and contents).
Sokolov V. А., Vtyurina О. P., Sokolova N. V. O raz-rabotke strategii razvitiya lesnogo kompleksa
Krasnoyarskogo kraya na period do 2030 goda (On elaboration of strategy for developing forest complex of Krasnoyarsk Krai until 2030) // Sibirskij Lesnoj Zurnal (Sib. J. For. Sci.). 2016. N. 4. P. 39–48 (in Russian with English abstract). Statistica Advanced (Multivariate Exploratory
Techniques). 2015. www.statsoft.com.
Svalov S. N. Ob otsenke prigodnosti raspredeleniya Veibulla dlya opisaniya stroeniya drevostoev (About evaluating itness of the Weibull distri-bution for tree stand structure description) // Voprosy lesovyraschivaniya i ratsionalnogo lesopolzovaniya. Nauchnye trudy Moskovskogo lesotekhnicheskogo instituta (Problems of growing forests and rational forest use. Proc. Moscow Inst. For. Technol.). 1982. Iss. 139. P. 172–174 (in Russian).
Tcsvetkov P. A. Pirogennye svoistva listvenniscy Gmelina v severnoi taige Srednei Sibiri (Pyrogenic features of Larix gmelinii in northern taiga of Central Siberia). DSc. Thesis. Krasnoyarsk: V. N. Sukachev Inst. Forest, Rus. Acad. Sci., Sib. Br., 2005. 35 p. (in Russian).
Ter-Mikaelian M. T., Korzukhin M. D. Biomass equations for sixty-ive North American tree species // For. Ecol. Manag. 1997. V. 97. P. 1–24.
Usoltsev V. A. Biologicheskaya produktivnost’ lesov Severnoi Evrazii: Metody, baza dannykh i ee prilozeniya (Biological productivity of Northern
Eurasia’s forests. Methods, datasets, applications). Yekaterinburg: Rus. Acad. Sci., Ural Br., 2007. 637 p. (in Russian with English title, summary and contents).
Utkin A. I., Zamolodchikov D. G., Chestnykh O. V., Korovin G. N., Zukert N. V. Lesa Rossii kak rezervuar organicheskogo ugleroda biosfery (Forests of Russia as a reservoir-storage of organic carbon in the biosphere) // Lesovedenie (Rus. J. For. Sci.). 2001. N. 5. P. 8–23 (in Russian with English summary).
Varaksin G. S. Lesnye kultury v ravninnoi podzone yuznoi taigi Sibiri (Forest crops in the plain subzone of southern taiga in Siberia). Kranoyarsk: Krasnoyask State Agr. Univ. Publ. House, 2013. 251 p. (in Russian).
Varaksin G. S., Vais A. A. Tendenscii v sostoyanii polezaschitnykh lesnykh polos yuznoi Sibiri (The tendencies in the condition of ield-protecting shelter belts in southern Siberia) // Sibirskij Lesnoj Zurnal (Sib. J. For. Sci.). 2016. N. 4. P. 86–97 (in Russian with English abstract).
West G. B., Brown J. H., Enquist B. J. A general model for the structure and allometry of plant vascular systems // Nature. 1999. V. 400. N. 6745. P. 664–667.
72 СИБИРСКИЙ ЛЕСНОЙ ЖУРНАЛ. № 6. 2016 УДК 630*548(1-925.14/.16)+630*434:630*23
ДИНАМИКА ЛЕСНЫХ ЭКОСИСТЕМ, ФОРМИРУЮщИХСЯ
НА ГАРЯХ И ВЫРУБКАХ В ГОРНЫХ РАЙОНАХ СИБИРИ:
ОСОБЕННОСТИ БИОЛОГИЧЕСКОГО РАЗНООБРАЗИЯ,
СТРУКТУРЫ И ПРОДУКТИВНОСТИ
И. М. Данилин, И. А. Целитан
1 Институт леса им. В. Н. Сукачева СО РАН – Обособленное подразделение ФИЦ КНЦ СО РАН
660036, Красноярск, Академгородок, 50/28
2 Красноярский институт экономики –
филиал Санкт-Петербургского академического университета 660100, Красноярск, ул. Киренского, 70а
E-mail: [email protected], [email protected] Поступила в редакцию 01.02.2016 г.
Рассматриваются вопросы комплексной оценки и динамики лесных экосистем на основе детализации мест-ных особенностей структуры, роста и продуктивности, раскрытия общих закономерностей географическо-го и биологическогеографическо-го разнообразия и поддержания устойчивости на примере насаждений, формирующихся на гарях и вырубках в горных районах Сибири. В этом обширном регионе с характерным суббореальным, субаридным резко континентальным климатом леса произрастают на сезонно-мерзлых почвах, во многих случаях в степных, лесостепных и высокогорных ландшафтах. Разработка критериев устойчивости горных лесных экосистем необходима для обеспечения рационального использования и сохранения лесных ресур-сов. Основой для этого служат комплексные биометрические характеристики лесных насаждений и ланд-шафтов, детальное изучение их структуры, биологического разнообразия и продуктивности. В статье анали-зируются и обсуждаются морфологические параметры деревьев, строение, рост, фитомасса и биологическая продуктивность древостоев, накопление отмершей органики восстановительных послепожарных и послеру-бочных сукцессий, установленные с использованием морфометрических методов, распределения Вейбулла и аллометрических функций.
Ключевые слова: лесные экосистемы, гари и вырубки, восстановление, биологическое разнообразие, струк-тура, продуктивность, горные районы, Сибирь.