Adv. Sci. Res., 13, 21–26, 2016 www.adv-sci-res.net/13/21/2016/ doi:10.5194/asr-13-21-2016
© Author(s) 2016. CC Attribution 3.0 License.
EMS
Ann
ual
Meeting
&
12th
European
Conf
erence
on
Applications
of
Meteorology
(ECAM)
Validation of the McClear clear-sky model in desert
conditions with three stations in Israel
Mireille Lefèvre and Lucien Wald
MINES ParisTech – PSL Research University, Sophia Antipolis, Paris, France
Correspondence to:Lucien Wald ([email protected])
Received: 30 November 2015 – Revised: 18 February 2016 – Accepted: 26 February 2016 – Published: 2 March 2016
Abstract. The new McClear clear-sky model, a fast model based on a radiative transfer solver, exploits the
atmospheric properties provided by the EU-funded Copernicus Atmosphere Monitoring Service (CAMS) to estimate the solar direct and global irradiances received at ground level in cloud-free conditions at any place any time. The work presented here focuses on desert conditions and compares the McClear irradiances to coincident 1 min measurements made in clear-sky conditions at three stations in Israel which are distant from less than 100 km. The bias for global irradiance is comprised between 2 and 32 W m−2, i.e. between 0 and 4 % of the mean observed irradiance (approximately 830 W m−2). The RMSE ranges from 30 to 41 W m−2(4 %) and the squared correlation coefficient is greater than 0.976. The bias for the direct irradiance at normal incidence (DNI) is comprised between−68 and+13 W m−2, i.e. between−8 and 2 % of the mean observed DNI (approximately 840 W m−2). The RMSE ranges from 53 (7 %) to 83 W m−2(10 %). The squared correlation coefficient is close to 0.6. The performances are similar for the three sites for the global irradiance and for the DNI to a lesser extent, demonstrating the robustness of the McClear model combined with CAMS products. These results are discussed in the light of those obtained by McClear for other desert areas in Egypt and United Arab Emirates.
1 Introduction
The downwelling solar irradiance observed at ground level on horizontal surfaces and integrated over the whole spec-trum (total irradiance) is called surface solar irradiance (SSI). It is the sum of the direct irradiance, from the direction of the sun, and the diffuse, from the rest of the sky vault, and is also called the global irradiance. The SSI is an essential cli-mate variable as established by the Global Clicli-mate Observ-ing System in August 2010 (GCOS, 2016). Knowledge of the SSI and its geographical distribution is of prime importance for numerous domains where SSI plays a major role as e.g. weather, climate, biomass, and energy.
A model estimating the SSI under clear sky or cloud-free conditions is called a clear-sky model. Oumbe et al. (2014) have demonstrated that computations of the SSI from satel-lite images can be approximated by the product of the clear-sky SSI and a modification factor due to cloud properties and ground albedo only. Changes in clear-atmosphere properties have negligible effect on this modification factor so that both terms can be calculated independently. These results are
im-portant in the view of an operational system as it permits sep-arating the whole processing into two distinct and indepen-dent models, whose input variable types and resolutions may be different. This enforces the importance of the availability of an accurate and easy-to-operate model for the assessment of the clear-sky SSI.
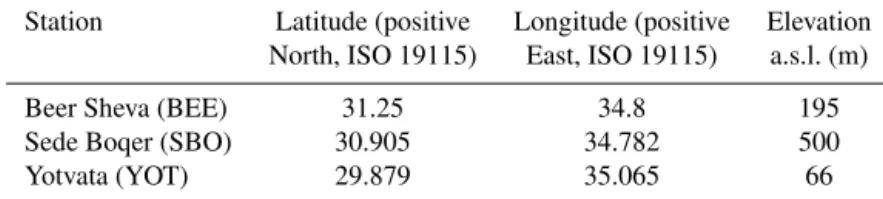
Table 1.Geographical coordinates of the three stations. Period is 2006–2011. All data are coincident. Number of samples is 19 849 inG,B andD.
Station Latitude (positive Longitude (positive Elevation North, ISO 19115) East, ISO 19115) a.s.l. (m)
Beer Sheva (BEE) 31.25 34.8 195
Sede Boqer (SBO) 30.905 34.782 500
Yotvata (YOT) 29.879 35.065 66
The CAMS McClear service is available as an interopera-ble Web processing service (WPS), i.e. an application that can be invoked via the Web and that obeys the OGC (Open Geospatial Consortium) standard for interoperability (Perci-vall et al., 2011). This service delivers estimates of the global SSI and its direct and diffuse components on horizontal sur-face as well as the direct SSI at normal incidence, for various durations ranging from 1 min to 1 month.
Since its inception as a pre-operational service, McClear has been increasingly used by academics and practitioners. A lot of attention is paid to the validation of the estimates provided by McClear. The goal is to better establish the do-main of validity of McClear, its qualities and drawbacks, and to bring transparency and confidence in the use of this oper-ational service.
McClear has been previously validated with respect to 1 min measurements of global and direct SSI on hori-zontal surface from the Baseline Surface Radiation Net-work (BSRN) collected from 11 sites located throughout six continents (Lefèvre et al., 2013). The relative root mean square error (RMSE) for global SSI and direct SSI depends on the station and ranges respectively between 3 and 5 % of the mean of the measurements for the station, and between 5 and 10 %.
This article aims at contributing further to the validation of the McClear model. It focuses on desert conditions en-countered in Israel where three close stations measure the global, diffuse and direct SSI. This density of stations per-mits to study the variability of the performances of McClear in this climate homogeneous area.
2 Measurements and McClear estimates
Measurements of the globalGand diffuseDSSI and of the beam irradiation received at normal incidenceBNwere col-lected from three stations (Fig. 1 and Table 1) from the Is-rael Meteorological Service (IMS), the BSRN network and an undisclosed company for the period 2006–2011. The di-rect SSIB on horizontal surface is computed from the dif-ference G–D. Measurements are integrated over 10 min at Beer Sheva and Yotvata and 1 min at Sede Boqer which be-longs to the BSRN network. 1 min measurements at Sede Bo-qer were averaged over 10 min to match the sampling rate of the two other stations. The solar zenith angle θS corre-sponding to each measurement is computed with the SG2
al-Figure 1.Map of the three stations. The red line is 100 km in length.
gorithm (Blanc and Wald, 2012). After applying the quality check procedures of Roesch et al. (2011), only the measure-ments were kept which pass the filters proposed by Lefèvre et al. (2013) to retain reliable clear-sky instants. Finally, only are kept clear-sky instants for which measurements are valid for the three stations simultaneously. The number of samples is 19 849 for each station. This last constraint was imposed in order to be able to compare correlation coefficients com-puted for data sets, whether measurements or estimates, for two stations.
The three stations are fairly close to each other (Fig. 1). Beer Sheva is 40 km north of Sede Boqer and Yotvata is 120 km south of Sede Boqer.
McClear estimates ofG,D,BandBNfor 10 min duration were obtained from the SoDa web site (www.soda-pro.com) for these same instants and for each location. It may be of in-terest here to underline that the McClear model computesG andBN, thenB, and thatDis deduced fromG–B. Also pro-vided were the corresponding time-series of the irradiance at the top of atmosphere on both horizontal and normal sur-faces:E0 andE0N. The clearness index KT and the direct clearness indexKTBNwere computed for both measurements and McClear estimates using the following formula:
KT =G/E0 (1)
Table 2. Comparison between clear-sky globalGand diffuseDSSI measured by ground stations and estimated by McClear. Units in W m−2.
G D
BEE SBO YOT BEE SBO YOT
Mean observed SSI 810 838 825 124 114 137
Bias 19 2 32 60 69 48
Relative bias (%) 2 0 4 48 60 35
RMSE 32 30 41 66 74 55
Relative RMSE (%) 4 4 5 53 65 40
Squared correlation coefficient 0.977 0.976 0.980 0.594 0.627 0.633
Figure 2.2-D histogram of measurements (horizontal axis) and McClear estimates (vertical axis) ofGfor Sede Boqer. The colour represents the frequency of each pair.
3 Results
Following the ISO (International Organization for Standard-ization) standard (1995), the deviations were computed by subtracting measurements for each instant from the McClear estimates and they were summarized by the bias, the root mean square error (RMSE), and the squared correlation coef-ficient, also known as the coefficient of determination (R2). Relative values are expressed with respect to the mean ob-served value. The validations of KTandKTBN are also in-cluded, as they are stricter measures of the performance of a model with respect to the optical state of the atmosphere.
The 2-D histograms of measured and estimated values are presented for Sede Boqer (Figs. 2 and 3). Red, respectively dark blue, dots correspond to regions with great, respectively very low, densities of samples. The plots also present the number of samples, the mean reference value, the bias, the RMSE, the correlation coefficient (CC) and the 1:1 line (y=x). One may see in Fig. 2 that the points are mostly
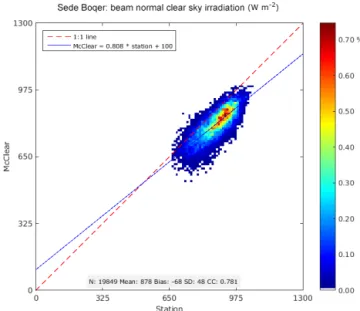
Figure 3.2-D histogram of measurements (horizontal axis) and McClear estimates (vertical axis) ofBNfor Sede Boqer. The colour represents the frequency of each pair.
aligned with the 1:1 line with a very limited scattering. The bias and RMSE are respectively 2 and 30 W m−2. The squared correlation coefficient is very large: 0.976, meaning that the temporal changes inGare well reproduced by Mc-Clear. The points in Fig. 3 forBNare less aligned with the 1:1 line. The absolute value of the bias and RMSE are much larger:−68 and 83 W m−2. The squared correlation coeffi-cient is 0.610 and a large amount of changes inBNis unex-plained by McClear.
Tables 2–4 present the results of the comparison for re-spectively G, D, B,BN,KT and KTBN. The means of G (Table 2, approximately 830 W m−2),B
Table 3.Comparison between clear-sky beam SSIB and beam at normal incidenceBNmeasured by ground stations and estimated by McClear. Units in W m−2.
B BN
BEE SBO YOT BEE SBO YOT
Mean observed SSI 686 724 688 841 878 809
Bias −41 −66 −16 −46 −68 13
Relative bias (%) −6 −9 −2 −6 −8 2
RMSE 59 80 46 69 83 53
Relative RMSE (%) 9 11 7 8 10 7
Squared correlation coefficient 0.931 0.937 0.929 0.576 0.610 0.603
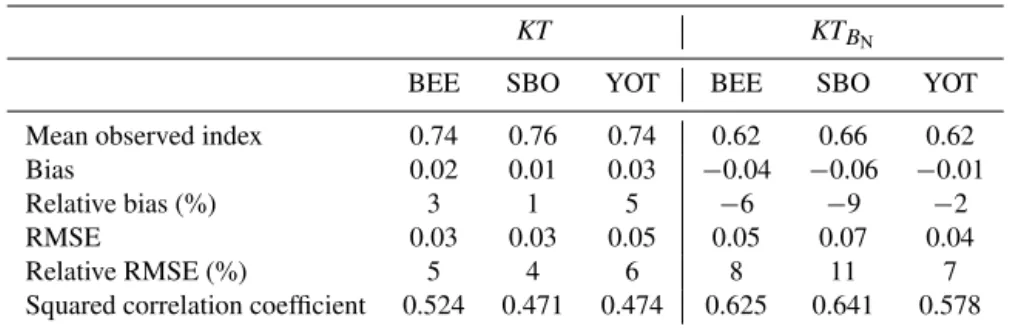
Table 4.Comparison between clear-sky clearness indicesKTandKTBNfrom ground stations and estimated by McClear.
KT KTBN
BEE SBO YOT BEE SBO YOT
Mean observed index 0.74 0.76 0.74 0.62 0.66 0.62
Bias 0.02 0.01 0.03 −0.04 −0.06 −0.01
Relative bias (%) 3 1 5 −6 −9 −2
RMSE 0.03 0.03 0.05 0.05 0.07 0.04
Relative RMSE (%) 5 4 6 8 11 7
Squared correlation coefficient 0.524 0.471 0.474 0.625 0.641 0.578
The bias for G is low for Sede Boqer: 2 W m−2, and is larger for the other sites: 19 and 32 W m−2, i.e. 2 and 4 % of the mean observed G. The RMSE ranges from 30 to 41 W m−2 (4 %) and the squared correlation coefficient is greater than 0.976 (Table 2). The influence ofθSon the SSI creates de facto a correlation between measurements and es-timates in clear-sky conditions as θS andE0 can be accu-rately estimated. The influence ofθSonKTis much less pro-nounced and the squared correlation coefficient denotes the ability of McClear to reproduce the optical state of the atmo-sphere. It ranges between 0.471 and 0.524 (Table 4) and is low. A majority of changes inKTis not reproduced by Mc-Clear and improvements should be brought on the McMc-Clear model and on the quality of its inputs. The bias and RMSE forKTare similar in relative value to those forG(Table 4). Expectedly, the results for Sede Boqer are fully in line with the bias, RMSE and squared correlation coefficient for both GandKTreported by Lefèvre et al. (2013) for this station though for 1 min SSI: 7 and 30 W m−2, 0.982, and 0.01, 0.03 and 0.581.
The estimates of D by McClear are inaccurate (Ta-ble 2). There is an overestimation ranging between 48 and 69 W m−2(35 to 60 % of the mean ofD). The RMSE ranges between 55 and 74 W m−2(40 to 65 %). The squared corre-lation coefficient is comprised between 0.594 and 0.633; a large amount of changes inDis unexplained by McClear.
An underestimation is observed forB andBN (Table 3), except Yotvata for BN. The bias for B, respectivelyBN, is comprised between −66 and−16 W m−2, i.e. between−9
and−2 % of the meanB, and between−68 and+13 W m−2 (−8 and 2 % of the mean BN). The RMSE ranges from 46 (7 %) to 80 W m−2 (11 %) forB, and from 53 (7 %) to 83 W m−2(10 %) forBN. The bias and RMSE forKT
BN are similar in relative value to those forB andBN (Table 4). The squared correlation coefficient forBNandKTBN is close to 0.6; a large amount of changes inBN or KTBN is unex-plained by McClear. The squared correlation coefficient for Bis much larger and close to 0.93 because of the influence ofθSon the correlation and the accuracy of its estimate.
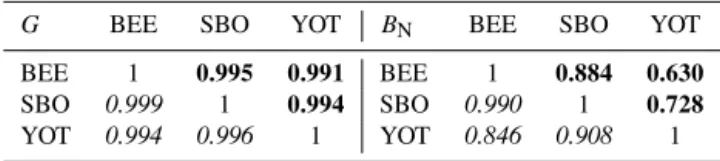
An additional comparison was performed that dealt with the ability of McClear to reproduce spatial variability. The correlation coefficient between time-series of measurements, respectively McClear estimates, was computed for each pair of stations forGandBN(Table 5). It is observed (upper right part of the correlation matrix) that the measurements are very much correlated forG(greater than 0.99), which can be ex-plained by the fact that only clear-sky measurements are dealt with. The correlation coefficient is less forBN, especially be-tween Yotvata and the two others for which it is respectively 0.630 and 0.728. This is in agreement with the remoteness of Yotvata compared to the two others and the above remark on its climate.
discrep-Table 5.Correlation matrix between stations for measurements (up-per right part of the matrix, in bold) and for McClear (lower left part, in italic) forGandBN.
G BEE SBO YOT BN BEE SBO YOT
BEE 1 0.995 0.991 BEE 1 0.884 0.630
SBO 0.999 1 0.994 SBO 0.990 1 0.728
YOT 0.994 0.996 1 YOT 0.846 0.908 1
ancies may be observed. There is an overestimation of the correlation by McClear which can be attributed to the cor-relation of its inputs due to the coarse spatial and temporal resolutions. CAMS products on aerosols and total content in water vapour and ozone are available every 3 h. The spatial resolution is 1.125◦, i.e. approx. 120 km along a longitude,
for the aerosol properties. This is the same resolution for the total column content of ozone and water vapour before 2014 after which it became 0.8◦
. TheBN field estimated by Mc-Clear will be smoother than the actual field. Note that the ranking of the correlation coefficients is the same for both the measurements and McClear; the local extrema are respected though the intensity of the variation is decreased.
4 Discussion and conclusion
Like reported in other similar studies, the statistical quanti-ties reported here vary with the period of analysis. A given quantity may change noticeably from one year to another. For example, the bias inBNat Sede Boqer varies from−63 to −75 W m−2if years are considered separately. This indicates that care must be taken in the analysis of these quantities.
The quantities vary with the month. Trends are more or less marked. There is a tendency for lowest bias – in absolute value – and lowest RMSE in the period May–August. There is a tendency for the bias and the RMSE to increase withθS, yielding an increase – in absolute value – of the relative bias and RMSE as the meanGandBNdecrease asθSincreases. Nevertheless, the changes are limited.
Eissa et al. (2015a, b) have performed similar studies but for respectively Egypt and the United Arab Emirates. Simi-larly to this study, Aswan and the UAE sites exhibit underes-timation ofBN. This underestimation is more pronounced for Beer Sheva and Sede Boqer. On the contrary, Yotvata exhibits an overestimation of 13 W m−2. The comparison of these dif-ferent studies shows that the overall picture of the possible causes of the discrepancies between measurements and Mc-Clear estimates is still unclear. The underestimation in BN may be partly caused by overestimation of the aerosol opti-cal depth (AOD). Through comparisons between the AODs measured by AERONET and estimated in CAMS for desert areas in Egypt and UAE, Eissa et al. (2015b) and Oumbe et al. (2012) concluded that one main source of the errors in McClear originates from the CAMS AOD. Therefore, more accurate inputs to McClear would improve its estimates. For
example, Oumbe et al. (2015) have shown that a local empir-ical correction of the CAMS AOD drastempir-ically decreases the bias in the United Arab Emirates.
As forG, if one looks at the results of Eissa et al. (2015a) for Aswan in Egypt – which is located in a desert far from the Cairo megapole, – one would observe that the large over-estimation ofGby McClear over Aswan: 33 W m−2, is sim-ilar to that observed at Yotvata in this study. Yotvata exhibits the greatest bias of the three sites. The bias at Sede Boqer is 2 W m−2, expectedly similar to that of 7 W m−2reported by Lefèvre et al. (2013) for the same site though for 1 min summarization. The bias for the more turbid sites in the UAE ranges from−5 to 10 W m−2.
Estimates inGandD – and hence the statistical perfor-mances – are sensitive to the type of aerosols that is esti-mated by the means of the empirical algorithm presented in Lefèvre et al. (2013) applied to the partial aerosol op-tical depths delivered by CAMS. It is found that in Beer Sheva and Sede Boqer – which are close compared to the size of the CAMS cell, – the most frequent aerosol type is “continental polluted”, then “maritime polluted” and finally “desert”. The same types are found for Yotvata but “desert” is most frequent than “maritime polluted”. An error may arise if the wrong type is selected. Figure 1 in Lefèvre et al. (2013) displays a specific case of daily profile of Gin Carpentras (France) with a dramatic change by 30 W m−2 (approx. 3 %) due to an error in the empirical algorithm. In other cases reported in Eissa et al. (2015a) an overestimation of the fine, strongly scattering pollution particles associated with an underestimation of the coarse, less scattering, min-eral dust particles would affectGandD. It should be added that the coarse spatial and temporal resolutions of the CAMS data on aerosols make it difficult to capture the exact atmo-spheric effects on the incident solar radiation over a specific site. Other causes of uncertainty are the uncertainties in the OPAC model used in McClear (Lefèvre et al., 2013). Zieger et al. (2010) showed noticeable changes in single scattering albedo with relative humidity for the OPAC “continental pol-luted” and “maritime polpol-luted” types. If relative humidity is assumed too large, then the single scattering albedo is overes-timated, yielding an overestimation inD. This may explain the difference between the two sites Beer Sheva and Sede Boqer and the southern one Yotvata where “desert” is more frequent. Simulations performed with the radiative transfer model libRadtran have shown that in case of intense dust storms, i.e. heavy load in dust particles, the single scattering albedo in OPAC “desert” type underestimates that observed in AERONET measurements, which yields an underestima-tion inD. This is not observed in cases of low or medium loads in dust. This adds to the complexity as intense dust storms may also be observed in the northern sites.
large, and more efforts are necessary for a better modelling of the aerosols.
Despite the identified drawbacks and paths for improve-ments, this validation of the McClear service for the desert conditions in Israel reveals satisfactory results. The compar-isons between the McClear estimates and measurements of global horizontal and direct normal irradiances for 3 stations show that a large correlation is attained showing the abil-ity of McClear to capture the temporal and spatial variabilabil-ity of the irradiance field. The performances are similar for the three sites for the global irradiance and for the DNI to a lesser extent, demonstrating the robustness of the CAMS McClear service.
Acknowledgements. The authors thank the Israel Meteorolog-ical Service, the operators of the BSRN Sede Boqer station for their valuable measurements and the Alfred-Wegener Institute for hosting the BSRN website. They also thank the anonymous referees whose comments helped in improving this paper. The research leading to these results has received funding from the European Union’s Horizon 2020 Programme (H2020/2014–2020) under grant agreement no. 633081 (MACC-III project) and from the European Union’s Copernicus Atmosphere Monitoring Service (CAMS).
Edited by: S.-E. Gryning
Reviewed by: two anonymous referees
References
Benedetti, A., Morcrette, J.-J., Boucher, O., Dethof, A., Engelen, R. J., Fisher, M., Flentje, H., Huneeus, N., Jones, L., Kaiser, J. W., Kinne, S., Manglold, A., Razinger, M., Simmons, A. J., and Suttie, M.: Aerosol analysis and forecast in the European Centre for Medium-Range Weather Forecasts Integrated Forecast System: 2. Data assimilation, J. Geophys. Res., 114, D13205, doi:10.1029/2008JD011115, 2009.
Blanc, P. and Wald, L.: The SG2 algorithm for a fast and accurate computation of the position of the Sun, Sol. Energy, 86, 3072– 3083, doi:10.1016/j.solener.2012.07.018, 2012.
Eissa, Y., Korany, M., Aoun, Y., Boraiy, M., Abdel Wahab, M., Al-faro, S., Blanc, P., El-Metwally, M., Ghedira, H., and Wald, L.: Validation of the surface downwelling solar irradiance estimates of the HelioClim-3 database in Egypt, Remote Sensing, 7, 9269– 9291, doi:10.3390/rs70709269, 2015a.
Eissa, Y., Munawwar, S., Oumbe, A., Blanc, P., Ghedira, H., Wald, L., Bru, H., and Goffe, D.: Validating surface downwelling so-lar irradiances estimated by the McClear model under cloud-free skies in the United Arab Emirates, Sol. Energy, 114, 17–31, doi:10.1016/j.solener.2015.01.017, 2015b.
GCOS – Global Climate Observing System Essential Climate Vari-ables: available at: www.wmo.int/pages/prog/gcos/index.php? name=EssentialClimateVariables, last access: 20 February 2016.
ISO Guide to the Expression of Uncertainty in Measurement: first edition, International Organization for Standardization, Geneva, Switzerland, 1995.
Kaiser, J. W., Peuch, V.-H., Benedetti, A., Boucher, O., Enge-len, R. J., Holzer-Popp, T., Morcrette, J.-J., Wooster, M. J., and the MACC-II Management Board: The pre-operational GMES Atmospheric Service in MACC-II and its potential us-age of Sentinel-3 observations, ESA Special Publication SP-708, Proceedings of the 3rd MERIS/(A)ATSR and OCLI-SLSTR (Sentinel-3) Preparatory Workshop, 15–19 October 2012, held in ESA-ESRIN, Frascati, Italy, 2012.
Lefèvre, M., Oumbe, A., Blanc, P., Espinar, B., Gschwind, B., Qu, Z., Wald, L., Schroedter-Homscheidt, M., Hoyer-Klick, C., Arola, A., Benedetti, A., Kaiser, J. W., and Morcrette, J.-J.: Mc-Clear: a new model estimating downwelling solar radiation at ground level in clear-sky conditions, Atmos. Meas. Tech., 6, 2403–2418, doi:10.5194/amt-6-2403-2013, 2013.
Oumbe, A., Bru, H., Hassar, Z., Blanc, P., Wald, L., Fournier, A., Goffe, D., Chiesa, M., and Ghedira, H.: Selection and imple-mentation of aerosol data for the prediction of solar resource in United Arab Emirates, In Proceedings of SolarPACES Con-ference, 11–14 September 2012, Marrakech, Morocco, PSE AG, Freiburg, Germany, USBKey, Paper#22240, 2012.
Oumbe, A., Qu, Z., Blanc, P., Lefèvre, M., Wald, L., and Cros, S.: Corrigendum to “Decoupling the effects of clear atmosphere and clouds to simplify calculations of the broadband solar irradiance at ground level” published in Geosci. Model Dev., 7, 1661–1669, 2014, Geosci. Model Dev., 7, 2409–2409, doi:10.5194/gmd-7-2409-2014, 2014.
Oumbe, A., Wald, L., Blanc, P., Ghedira, H., and Goffe, D.: Improv-ing the solar resource estimation in the United Arab Emirates using aerosol and irradiance measurements, ISES Solar World Congress 2015, 8–12 November 2015, Daegu, Korea, 2015. Percivall, G., Ménard, L., Chung, L.-K., Nativi, S., and
Pearl-man, J.: Geo-processing in cyberinfrastructure: making the web an easy to use geospatial computational platform, in: Proceedings, 34th International Symposium on Remote Sensing of Environment, Sydney, Australia, 10–15 April 2011, available at: www.isprs.org/proceedings/2011/ISRSE-34/ 211104015Final00671.pdf (last access: 1 March 2016), 2011. Peuch, V.-H., Rouil, L., Tarrason, L., and Elbern, H.: Towards
European-scale Air Quality operational services for GMES At-mosphere, 9th EMS Annual Meeting, EMS2009-511, 9th Euro-pean Conference on Applications of Meteorology (ECAM) Ab-stracts, held 28 September–2 October 2009, Toulouse, France, 2009.
Roesch, A., Wild, M., Ohmura, A., Dutton, E. G., Long, C. N., and Zhang, T.: Corrigendum to “Assessment of BSRN radia-tion records for the computaradia-tion of monthly means” published in Atmos. Meas. Tech., 4, 339–354, 2011, Atmos. Meas. Tech., 4, 973–973, doi:10.5194/amt-4-973-2011, 2011.