Research and Politics July-September 2016: 1 –4 © The Author(s) 2016 DOI: 10.1177/2053168016669743 rap.sagepub.com
Creative Commons Non Commercial CC-BY-NC: This article is distributed under the terms of the Creative Commons
Attribution-NonCommercial 3.0 License (http://www.creativecommons.org/licenses/by-nc/3.0/) which permits non-commercial use, reproduction and distribution of the work without further permission provided the original work is attributed as specified on the SAGE and Open Access pages (https://us.sagepub.com/en-us/nam/open-access-at-sage).
Introduction
Question wording shapes respondent answers. Much schol-arship has found that changing question format and labeling can create variance in measurements of political behavior (e.g. Jacoby, 2000; Schuman and Presser, 1981), but this point has been overlooked with respect to an important con-struct in public opinion research: ideology. Virtually every major academic survey (including General Social Surveys, National Annenberg Election Surveys, and the American National Election Studies [ANES]) measures respondent ideology using a seven-point scale anchored by “extremely” endpoints. In contrast, private polling companies often describe the most ideological positions on their scales as “very liberal” and “very conservative.” Yet with the excep-tion of Knight’s (1990) brief analysis of the 1989 ANES Pilot Study, virtually no scholarship has examined the dif-ferences in reported respondent ideology produced by these two endpoint labels. We offer such an analysis here.
While we understand the limitations of such old data, we rely on the 1989 ANES for two reasons. First, utilizing the ANES allows us to replicate the same polarization scales and measures used in contemporary research. Second, the 1989 data are the most recent data that allow for a direct comparison of the two question wordings, and political sci-entists have never fully leveraged their usefulness. Even
though the 1989 ANES is the only existing data on “extremely” versus “very” in a major political science sur-vey, the only analysis was an internal ANES publication (Knight, 1990) that ignored half of the survey manipula-tions (shown later in Table 2). In addition, ANES data allow us to demonstrate the effects of the different ideology anchors on contemporary polarization research.
Our principal concern is whether the word “extremely” is a “symbolically loaded” way to label ideology scale end-points (Knight, 1984: 311). This imagery is problematic if respondents who are clearly ideological (displaying strong and consistent preferences toward a liberal or conservative political worldview) fail to select a polar option on the ide-ological scale solely because of its question wording. If so, then research on contemporary topics such as mass polari-zation (Abramowitz and Saunders, 2008; Levendusky, 2009) may be fundamentally misunderstood.
Extremism in survey measures
of ideology
Soren Jordan
1and Grant Ferguson
2Abstract
Research on mass political behavior relies extensively on ideology scales. The majority of political science surveys use a unique, and potentially problematic, word to anchor the endpoints of these scales (“extremely”). However, political science has surprisingly little evidence on the effects of using this anchor over others. We utilize an older, but ignored, survey experiment on the 1989 American National Election Study (ANES) Pilot Study to analyze the consequences of the choice between using “very” or “extremely” endpoint labels. Theoretically, our results illustrate how a seemingly negative question anchor helps optimally measure a key concept (ideology) that is fundamental to understanding phenomena such as mass polarization.
Keywords
extreme, ideology, measurement, polarization
1Department of Political Science, Auburn University, USA 2Department of Political Science, Texas Christian University, USA
Corresponding author:
Soren Jordan, Department of Political Science, Auburn University, 7080 Haley Center, Auburn University, AL 36849, USA.
Email: sorenjordanpols@gmail.com
669743RAP0010.1177/2053168016669743Research & PoliticsJordan and Ferguson
research-article2016
2 Research and Politics
This concern is multiplied when we consider the psy-chology of respondents. Respondents are especially unlikely to be motivated to appear “odd or extreme” when under evaluation (Jones and Sigall, 1971). Even individu-als with strong preferences might be averse to indicating those preferences, especially if the measurement tool uses a subjectively loaded term, because of an “automatic pro-cess” that triggers in response to prejudices (Devine, 1989). Tourangeau et al. (2000: 212) describe this as “the standard of comparison [has] major effects on the judg-ments that are rendered.” If the standard of comparison is someone holding radical, fanatical opinions—a stereo-typed extremist—respondents might avoid endpoint responses, even if they are strongly ideological. Moreover, if this response to extremism is psychological, it should not diminish over time.
This might be avoided with a more neutral question anchor. If “very” is better at capturing individuals who con-sistently exhibit ideological preferences, we should prefer that question wording (because it eschews the cognitive bias of “extremely”). Presumably, we would observe more respondents willing to select the endpoints of the scale, increasing the variance of one measure relative to the other. Yet despite our knowledge of respondents, and over 60 years of the use of the word “extremely,” we lack direct evidence on the relative performance of these two anchors. We offer that evidence next.
Data, methods, and results
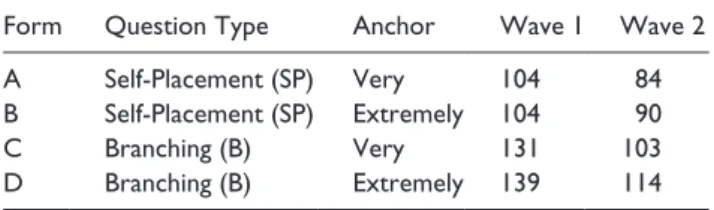
We know of only one data set that offers a direct statistical test between the two endpoint labels: the 1989 ANES Pilot, originally analyzed by Knight (1990). The study was a two-wave panel design with four forms per two-wave. The most interesting experiment for our purposes is the experimental manipulation between the endpoints defined by the words “extremely” and “very.” The manipulations occurred as shown in Table 1. For each wave, the forms represent a two-by-two manipulation of endpoint labels and question formats. This setup allows us to test the effects of the two question anchors.
First, we present the results of tests for the equality of the variances of the two question wordings. If even strongly ideological respondents are prejudiced to selecting non-strong ideological responses because of the “extremely” anchor, we should see non-equal variances between the words “very” and “extremely,” with “very” exhibiting a higher variance.
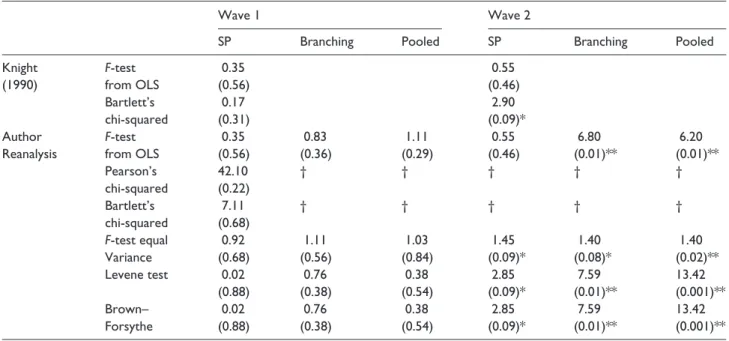
Table 2 displays the results. In the table, “SP” denotes the self-placement question format. “Branching” denotes the branching question format. “Pooled” denotes a test that pools the responses across both the self-placement and branching question formats.1 The first two rows represent
Knight’s (1990) analysis; the rest of the table displays our original analysis.
We discuss wave 1 first. First, we replicate Knight’s (1990) findings from the 1989 ANES Pilot study. Note that Knight’s analysis only considered a single question type: the self-placement (“SP”) format. This alone warrants reanalyzing the data. For wave 1, both the F-statistic from the OLS regression of ideology on an endpoint label dummy (the “very” label) and the Bartlett’s chi-squared test indicate no significant difference between the question anchors. We turn now to our original analysis (beyond just “self-placement”). Begin with the results in the third row, which report the F-statistics from the OLS regression of ideology on an endpoint label dummy (again, the “very” label). In no question format is the statistic significant. These tests from wave 1 show no evidence that the vari-ances of the two question anchors differ significantly.
We now offer more appropriate tests of the data.2 The
Pearson’s and Bartlett’s chi-squared tests both require that the length of the test variables be equivalent; here, there must be the same number of respondents in the “very” ques-tion type as the “extremely” type.3 Table 1 demonstrates
that, for wave 1, this is only true for the self-placement for-mat. Accordingly, we only execute these tests for this sub-sample. In neither test is the relevant test statistic significant. The same null evidence is found with the F-test, Levene test, and Brown–Forsythe test. For wave 1 we cannot reject the null hypothesis, so we conclude that the variances of “very” and “extremely” are not significantly different.
Move now to wave 2. From Knight’s (1990) analysis for wave 2, the Bartlett’s chi-squared test indicates there is a significant difference between endpoint labels “very” and “extremely” (χ2 = 2.90, p= 0.09). When we move beyond the self-placement question, we find more evidence of unequal variances of the two anchors. The branching question form (F = 6.80, p=0.01) and pooled responses (F= 6.20, p=0.01) both indicate that we can reject the null hypothesis of no significant difference between the “extremely” and “very” endpoints (third row). In this case, the variance of the “very” question type is higher, as we hypothesized. We find more consistent differences with the
F-test of equal variance, Levene test, and Brown–Forsythe test. For these tests, in each sample in wave 2—the self-placement question alone, the branching question alone, and the pooled responses across the question types—we can reject the null hypothesis that the two questions are
Table 1. Endpoints and question types by wave and form.
Form Question Type Anchor Wave 1 Wave 2
A Self-Placement (SP) Very 104 84
B Self-Placement (SP) Extremely 104 90
C Branching (B) Very 131 103
D Branching (B) Extremely 139 114
Cell entries are n of wave-form.
Jordan and Ferguson 3
drawn from distributions with equivalent variances. “Very” and “extremely” evoke different responses.
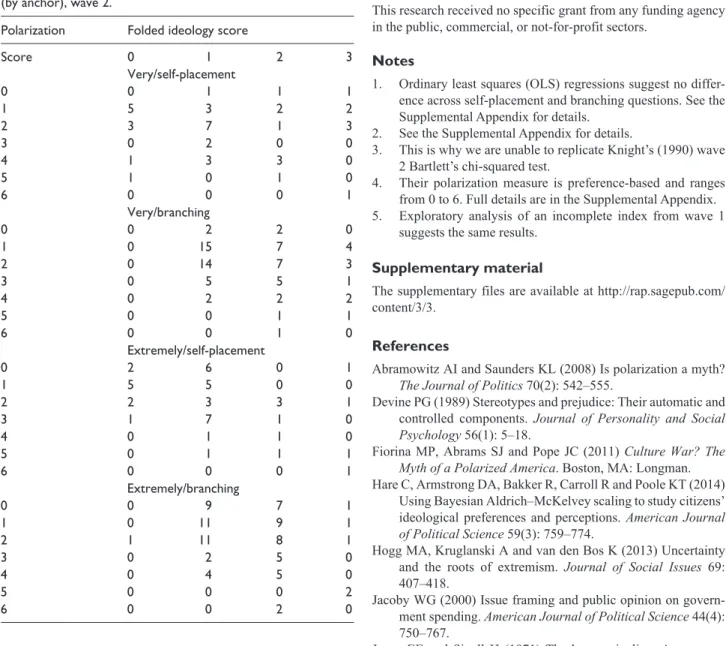
The question remains: if the variance of the “very” anchor exceeds the “extremely” anchor in wave 2, which respondents are responding as “very” ideological that are not responding as “extremely” ideological? To answer this question, we replicate Abramowitz and Saunders’s (2008) polarization scores.4 The component parts of their index
were asked only in wave 2, so we focus our attention on those data.5
Table 3 presents cross-tabulations of each folded ideol-ogy variable against the polarization scores. We provide cross-tabulations because the experimental manipulations performed on the ANES drastically reduce the n of each question wording. In the last column, we observe the distri-bution of preferences for those individuals who identify as either “very” or “extremely” ideological. For the “very” ideological, 78% of respondents only exhibited 0-3 one-sided preferences. Contemporary research would catego-rize these individuals as moderate based on their preferences (Fiorina et al., 2011), but classifying them solely on the basis of their ideological scores would label them as polar-ized. In contrast, almost 50% of respondents who identify as “extremely” ideological exhibit 4–6 one-sided prefer-ences. With this anchor, we better achieve consistency between preference-based indicators of polarization and ideologically based ones.
Only when measuring ideology with the “extremely” anchor is ideology significantly related to the polarization measure. In wave 2, the χ2 value for the association between
the combined “very” ideology scales and polarization is 13.458 (p= 0.764), and Pearson’s r=0.111. For the “extremely” ideology scales, χ2= 34.19 (p=0.011), and Pearson’s r= 0.265. The extremely response category exhibits a lower variance; fewer respondents locate in the endpoints. However, when we use the “very” anchor, those additional respondents who identify as “very” ideological are precisely those traditionally considered to be more mod-erate. These additional moderates reduce the association between ideology and preferences to insignificance.
Discussion and conclusion
Significantly fewer individuals place themselves at the end-points of an ideology scale when they must label them-selves “extremely” liberal or conservative. Although our data are from 1989, these results complement other social science findings: people prefer to consider themselves as moderate (Treier and Hillygus, 2009) and view words such as extremism with a negative connotation (Hogg et al., 2013). The explanations for this are generally psychologi-cal, and suggest social desirability bias (Hare et al., 2014) as a possible cause.
This psychological process is unlikely to change due to time itself or changing party coalitions. The two current parties are more polarized than in 1989, but our results complement those of contemporary research. Hare et al. (2014) demonstrate that even the most ideological respond-ents in the 2012 ANES avoided the “extremely” ends of the ideology scale. Our results suggest endpoint labeling as a
Table 2. Statistical analysis of scale endpoint labels.
Wave 1 Wave 2
SP Branching Pooled SP Branching Pooled
Knight F-test 0.35 0.55
(1990) from OLS (0.56) (0.46)
Bartlett’s 0.17 2.90
chi-squared (0.31) (0.09)*
Author F-test 0.35 0.83 1.11 0.55 6.80 6.20
Reanalysis from OLS (0.56) (0.36) (0.29) (0.46) (0.01)** (0.01)**
Pearson’s 42.10 † † † † †
chi-squared (0.22)
Bartlett’s 7.11 † † † † †
chi-squared (0.68)
F-test equal 0.92 1.11 1.03 1.45 1.40 1.40
Variance (0.68) (0.56) (0.84) (0.09)* (0.08)* (0.02)**
Levene test 0.02 0.76 0.38 2.85 7.59 13.42
(0.88) (0.38) (0.54) (0.09)* (0.01)** (0.001)**
Brown– 0.02 0.76 0.38 2.85 7.59 13.42
Forsythe (0.88) (0.38) (0.54) (0.09)* (0.01)** (0.001)**
Note: Entries are the relevant test statistic and P values in parentheses. *Significant at p< 0.10.
**Significant at p< 0.05.
4 Research and Politics
potential explanation for why this occurs. However, our results also suggest that if we seek to identify the most ide-ological respondents (the “polarized”), the discrimination provided by the “extremely” anchor is useful, making “extremely” the preferred anchor for theory construction.
The anchor “very” elicits the exhibition of more intense ideology, but these expressions are unrelated to actual pref-erence intensity. Future analyses of ideology measurement on surveys need samples of contemporary respondents. Such research will need large samples, because the number of individuals who identify at ideology scale endpoints is relatively small.
Overall, the word “extremely,” as other research has found, does seem to have a negative association, as demon-strated by the relatively fewer respondents identifying as extreme. But that connotation may help political scientists measure “true” ideological intensity from “reported” inten-sity. This helps validate the use of a seemingly negative measure.
Funding
This research received no specific grant from any funding agency in the public, commercial, or not-for-profit sectors.
Notes
1. Ordinary least squares (OLS) regressions suggest no differ-ence across self-placement and branching questions. See the Supplemental Appendix for details.
2. See the Supplemental Appendix for details.
3. This is why we are unable to replicate Knight’s (1990) wave 2 Bartlett’s chi-squared test.
4. Their polarization measure is preference-based and ranges from 0 to 6. Full details are in the Supplemental Appendix. 5. Exploratory analysis of an incomplete index from wave 1
suggests the same results.
Supplementary material
The supplementary files are available at http://rap.sagepub.com/ content/3/3.
References
Abramowitz AI and Saunders KL (2008) Is polarization a myth? The Journal of Politics 70(2): 542–555.
Devine PG (1989) Stereotypes and prejudice: Their automatic and controlled components. Journal of Personality and Social Psychology 56(1): 5–18.
Fiorina MP, Abrams SJ and Pope JC (2011) Culture War? The Myth of a Polarized America. Boston, MA: Longman. Hare C, Armstrong DA, Bakker R, Carroll R and Poole KT (2014)
Using Bayesian Aldrich–McKelvey scaling to study citizens’ ideological preferences and perceptions. American Journal of Political Science 59(3): 759–774.
Hogg MA, Kruglanski A and van den Bos K (2013) Uncertainty and the roots of extremism. Journal of Social Issues 69: 407–418.
Jacoby WG (2000) Issue framing and public opinion on govern-ment spending. American Journal of Political Science 44(4): 750–767.
Jones EE and Sigall H (1971) The bogus pipeline: A new par-adigm for measuring affect and attitude. Psychological Bulletin 76(5): 349–364.
Knight K (1984) The dimensionality of partisan and ideologi-cal affect: The influence of positivity. American Politics Quarterly 12(3): 305–334.
Knight K (1990) Comparisons of liberal–conservative items in the ANES 1989 pilot study. Report to the Pilot Study Committee and Board of Overseers.
Levendusky M (2009) The Partisan Sort: How Liberals Became Democrats and Conservatives Became Republicans. Chicago, IL: University of Chicago Press.
Schuman H and Presser S (1981) Questions and Answers in Attitude Surveys: Experiments on Question Form, Wording, and Content. New York: Academic Press.
Tourangeau R, Rips LJ and Rasinski K (2000) The Psychology of Survey Response, 1st edition. Cambridge: Cambridge University Press.
Treier S and Hillygus DS (2009) The nature of political ideology in the contemporary electorate. Public Opinion Quarterly 73(4): 679–703.
Table 3. Cross-tabulations of polarization and folded ideology (by anchor), wave 2.
Polarization Folded ideology score
Score 0 1 2 3
Very/self-placement
0 0 1 1 1
1 5 3 2 2
2 3 7 1 3
3 0 2 0 0
4 1 3 3 0
5 1 0 1 0
6 0 0 0 1
Very/branching
0 0 2 2 0
1 0 15 7 4
2 0 14 7 3
3 0 5 5 1
4 0 2 2 2
5 0 0 1 1
6 0 0 1 0
Extremely/self-placement
0 2 6 0 1
1 5 5 0 0
2 2 3 3 1
3 1 7 1 0
4 0 1 1 0
5 0 1 1 1
6 0 0 0 1
Extremely/branching
0 0 9 7 1
1 0 11 9 1
2 1 11 8 1
3 0 2 5 0
4 0 4 5 0
5 0 0 0 2