Volume VIII Number 4, 2016
The Demand of Services for Information Technology Industry
in Indonesia
M. Raiy1, Ernawati1, P. Adam1,2, Rostin1
1 Department of Economics, Universitas Halu Oleo, Kendari, Indonesia
2 Department of Mathematics, Universitas Halu Oleo, Kendari, Indonesia
Abstract
This research has a goal for analyzing determinant demand of telecommunication services either mobile phone or internet in Indonesia. This research uses secondary data of publication result from the Indonesian Central Bureau of Statistics in 2012-2013 period for 34 provinces in Indonesia. The demand for mobile phone is considered as the function of Gross Domestic Product (GDP) per capita and the region for dummy while the demand of internet service is the function of mobile phone service request, GDP per capita, proportion of educated society, proportion of the employment, and the region as a dummy. This research also modiies the model by placing the region as a moderating variable on GDP per capita. Furthermore, it is also done by using reduced form (mediation) to estimate the indirect effect on mobile phone ownership towards internet service request. The result of research showed that the demand for mobile phone and internet in Indonesia was inluenced by income factor (GDP per capita). Yet In Indonesia, there are still imbalances in adapting the information technology (internet) between the area of Java-Bali and the outside of those areas. The result of research also showed that the demand for the telephone was able to be mediation of internet use. However, some regions (Maluku and Papua) have not optimally exploited mobile phone to access the internet compared
to other regions.
Keywords
Mobile phone, internet services, income, territory, multiple linear regression model.
Raiy, M., Ernawati, Adam, P. and Rostin (2016) “The Demand of Services for Information Technology Industry in Indonesia", AGRIS on-line Papers in Economics and Informatics, Vol. 8, No. 4, pp. 125 - 132.
ISSN 1804-1930. DOI 10.7160/aol.2016.080411.
Introduction
The development of information technology today begins to eliminate barriers among countries. How it could be, information on certain parts will soon be accessible in other parts of world. The low of information will be unstoppable, and has become a new power in mobilizing public opinions. Today the war is no longer in physical scale, but has
entered the part of the war of ideas. Information
technology is just like a double-edged sword,
on one side it supports the progress of a nation
through time eficiency and information cost, but on the other hand it can be a means of controlling public opinion through harmful opinions which distract the order that have been made in politics, economics, social, and other ields. Unsurprisingly, there is also an idea which states that anyone
who controls the information will rule the world.
For this reason , every country strives to increase
the availability of telecommunication
infrastructures, not only to serve as parts of developmental needs but also to meet market demands. The European Union for example has had a strategy ‘Digital Agenda 2020’. The Agenda strives to maximise the social and economic potential of ICT, especially the potential of the Internet, a key medium of economic and social activity in all domains (education,
commerce, work, communication, culture etc.).
The strategic objective is to bring basic broadband connection to all European citizens by 2013 and to ensure that by 2020 all Europeans have access to much faster Internet (above 30 Mbps)
while at least 50% of European households should
have access to Internet (Vaněk et al., 2011)
In Indonesia, the development of information
technology industry has strived by the government, especially from supply side. The policy of telecommunication has been pushed
telecommunication service providers can
compete fairly, as intended by price competition. Expected through price competition, the demand
for telecommunications can continue to increase,
so that it can give more beneits to the society. Another beneit which can be obtained via telecommunication industry is inter-regional connectivity in Indonesia consisted of thousands of islands separated by oceans. However,
due to the large coverage area of Indonesia, the telecommunication developments seem
to be unequal. Based on the data of communication
and information (Kominfo, 2011) showed that
based on territorial aspect, the highest telendensity value is Jakarta and Banten, the value reached 169.3 while the lowest teledensity occurred in the area of West Java and Central Java and Yogyakarta with telendesity value of 36.9. This showed that every 100 people in West Java, Central Java and Yogyakarta there were 37 people using mobile phones. While the igures for the Jakarta-Banten telendensity of 169.3
indicated that each contained 170 people as
mobile phone users. This implies that the residents of Jakarta, Banten use two or more mobile phones. The telendensity of Kalimantan, Sumatra and Sulawesi-Maluku-Papua was 83.67, 70.85 and 56.75 respectively. While regional telendensity of Java-Bali and Nusa Tenggara was 56.5.
Thus it is necessary to make many efforts to improve the telecommunication industry from the demand
aspects among regions in Indonesia. On the demand
aspect of the development of information technology industry, either mobile phones or internet access of households in Indonesia is presented as Table 1.
Sources: Statistics of Indonesia, BPS (2014b)
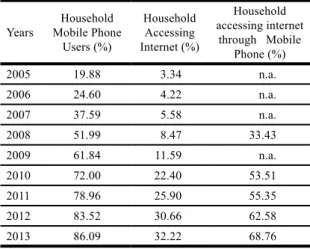
Table 1: Percentage of Household Phone Users and Internet
Users in Indonesia from 2005 to 2013.
Years Mobile Phone Household
Users (%)
Household Accessing Internet (%)
Household accessing internet
through Mobile
Phone (%)
2005 19.88 3.34 n.a.
2006 24.60 4.22 n.a.
2007 37.59 5.58 n.a.
2008 51.99 8.47 33.43
2009 61.84 11.59 n.a.
2010 72.00 22.40 53.51
2011 78.96 25.90 55.35
2012 83.52 30.66 62.58
2013 86.09 32.22 68.76
Table 1 shows that the number of households using mobile phones continued to increase up to 86.09 per
cent in 2013. However, from the aspect of internet
usage was still low, only about 33 percent. Whereas the majority of households accessed
the internet (2009-2013) through telephones. This
indicates that the phone ownership has not been used optimally by the community.
Several factors which can affect the optimal use of the phone including for the purpose of internet data access were educational level
of the telephone users and employment status. Internet access was inluenced by someone’s education because accessing these data
required knowledge which was more
complicated than using a regular phone.
Internet users are also strongly associated with a person's job, either as students, ofice
workers, or other professional workers. The demand
for the service was potentially higher than
other groups, such as children and housewives. Some other factors that could affect demand
for telecommunication services industry can be
viewed from the aspect of micro and macro. Some studies related to the demand for telecommunication services of micro aspects were reviewed
by (Omotayo and Joachim, 2008; Wang and Lo, 2002; and Olatokun and Nwonne, 2012). This research generally correlated with the decision of provider’s service election that was associated with the factor of quality of service and satisfaction. Several other studies examined the demand
for telecommunication services from the macro
aspects (Gruber and Verboven, 2001; Ahn and Lee, 1999; and Jha and Majumdar, 1999) by placing the variable gross domestic products (GDP) per capita as a variable affecting the demand.
Studies on the use of telephone and internet
in Indonesia were carried out by Utomo, et al (2013) on the public of capital city of Jakarta,
which incorporated the element of demographics as a determinant of telephone and internet
use. This study investigated the determinants
of telecommunication services from the micro level.
The study examined the determinants of demand
for telecommunication services to the macro scale of all provinces in Indonesia with the involvement
of the regional location remained unconsiderable,
whereas the position of Indonesia which is divided
into several areas with different imbalances
in economic development that is more inclined
to the Java-Bali obviously a little more inluences
developmental differences of telecommunication
industry between Java-Bali and non Java-Bali. This study examined how aspects of the area, population
of the economy (GDP per capita) affected
the demand for telecommunication services in Indonesia.
Review of literature
The demand for services and goods have multiple
determinants. As the standard of existing theories, the demand is inluenced by the price of the goods
themselves, the price of other goods, tastes, income,
and population. Price is the major determinant
of the demand for goods and services. In essence, the lower the price of an item, the more demand
for goods. Conversely, the higher the price
of an item, the less demand for goods. The price of other goods also affects the purchase, depending
on the nature of the relationship between the two items, whether as a substitution, complementary, and no interconnection. Although goods / services are not interconnected, but still inluence demand if factors constant revenue because the increase
in price will reduce purchasing power. Consumers
will face a more limited budgeting problem so that they must choose certain types of goods. The selection will sacriice other options that
reduce the demand for goods and services. Patterns
of relatedness are indicated with an income elasticity with the request indicating the characteristic of the goods of which is essential goods, luxury, or inferior. The income elasticity, e>1 indicates the goods/services of a luxury item; while 0<e<1 is of basic goods; while e<0 indicates the type of inferior goods. Garbacz and Thompson (2007) found that income elasticities of ixed main lines was 0.291, while income elasticities of mobile was
0.933. But when model incorporates the instruments
for residental landline and mobile monthly prices, income elasticities of mobile was 1.260 or indicate as luxury goods.
The demand for services in the telecommunication
industry is inluenced by several factors. Herrmann
et al. (2007) stated that the price factor had
a vital role, especially in the telecommunication market particularly in mobile phone service
providers. Several studies related to the demand for telecommunication services from micro
aspects generally reviewed purchasing decisions with customer satisfaction and loyalty. Omotayo and Joachim (2008) found a strong relationship between customer service and customer retention in the telecommunication industry in Nigeria. Park
and Ohm (2014) found that satisfaction and with
and perveived usefulness of mobile map services were the most signiicant antecedent of users’ attitude toward services and behavioural intention
to use them. Then Olatokun and Nwonne (2012)
found that the quality of service and availability
affected more on the electoral process of the use of telecommunication provider service compared
to promotion factor and brand image. The demand for cellular phone services in Malaysia was also reviewed by Rahman et al. (2010) from micro aspects which found that the quality of service and price signiicantly and positively impact on the demand for mobile phone services.
In contrast to these studies, Adikari (2013)
conducted a study about a telephone request to the students in Sri Lanka by using the variable of availability of facilities / features of the phone
and income as a determinant, the research showed
that the income level signiicantly and positively impact on the demand for mobile phones, whilst the facilities / features provided no effect. Other
studies that incorporated demographic aspects in the use of the phone studied the use of the phone at the same time as the use of the internet
in Jakarta conducted by Utomo, et al. (2013) using variables gender, age, education level and employment status (working, student, work, and not in the labor force). Regression of all these variables showed that the variables of age, education level and employment status affected the ownership of the phone, but not for gender. While the Internet access via mobile phones showed that all variables were signiicant except for a group of junior secondary school. Result of a study conducted by Varallyai and Herdon (2010) showed that demands for telecommunication, particularly
the use of Internet , decrease along with age
increase. In 2008 about 73 percent of a population ageing 16 – 24 years in European countries used the internet, 51 percent by 25- 43 years of age, and only, and only 7 percent by those ageing 66-74 years accessed the internet. While
the demographic aspects in the use of the Internet
was also seen in the study of Taylor et al. (2003)
researching the determinants of Internet use
on a variety of purposes, the results showed that
the demographic factors and socio-economic (location, gender, education level, marital
status, combined with family income
and employment status) inluenced the internet
access for the purpose of working in Central Queensland resident. While people using
the internet for online shopping purposes were only inluenced by factors of age and level of education. Hsiao and Chen (2014) found that users’ gender, age, occupation and income have signiicant
effects on the contract with voice and 3G internet,
Furthermore, Kalmus et al. (2011) examined aspects of Internet requests from the aspect of personal traits, socio-demographic variables and habitual indicators as well as lifestyle
of Estonian population at the age of 15-74 showed that the motive for someone to access the internet was the use of Social media and entertainment (SME), and work and information (WI).
The analysis showed that the use for the purposes of WI could be well predicted by frequency of use of the Internet for work/school/home, education
level, age, gender, language and income level, as it
happed to the lifestyle of participating in the public
sector. As the SME needs, income and gender factors had no effect. Usage for SME in addition
to do at work / school was also done at home
and other places. Al-Hammadani and Heshmati
(2011), his work in Iraq included elements of the location / region in addition to demographic
factors (such as gender, age, educational level and occupation), cost factor, and the intended use of the internet. The results showed that all of these
factors had a signiicant effect, except
for the location (area).
Furthermore, several studies evaluating
the demand for telecommunication from macro
side were namely Gruber and Verboven (2001); Ahn and Lee (1999); and Jha and Majumdar
(1999). These three studies using GDP per capita
as one of the variables affected the GCC demand
for telecommunication services. Gruber
and Verboven (2001) found that countries with a higher GDP per capita and larger ixed
networks tended to have the higher rate of adoption
of mobile services. These results were also in line with the research of Ahn and Lee (1999) which found that the probability of subscribing to mobile phone services was positively correlated with GDP per capita and the number of ixed lines per person. Abu and Tsuji (2010) conducted a study of panel
data from 51 countries from 1997 to 2007 period. The results showed that in the group of developed
countries, the use / ownership of the phone was inluenced by per capita income, the cost of mobile phones, network infrastructure, ixed network, and ixed telephone costs and technology;
while in the group of developing countries,
telephone installation was affected by the cost of mobile phones, market size, infrastructure, technology, and technological innovation. Mocnik
and Sirec (2010) found that the strongest positive
and most signiicant impact on internet use was ICT infrastructure and poeple capabilities, followed by income distribution, and investment
and international trade.
Material and methods
The study uses secondary data from the Indonesian Central Bureau of Statistics’s publication period
of 2012 -2013 in 34 provinces in Indonesia. In order to know the factors that affect the demand
for telecommunication services, then we analyze
them using the multiple linear regression model
which has been also used by Abu and Tsuji
(2010) and Al Hammadani and Heshmati (2011).
We stated this model in equation (1a), where the demand for mobile phones is a function of GDP per capita and region. The layout of the region as well as the estimated dummy variables is to determine differences in the demand for mobile phones based on the region, which is divided into Java-Bali and non Java-Bali-Bali, based on development inequality of Java-Bali and non Java-Bali-Bali. The are seven provinces in Java and Bali, including: DKI Jakarta, D.I. Yogyakarta, West Java, Central Java, East Java,
Banten, and Bali. The other 27 propinces are
outside of these regions. Development in Java and Bali occurs rapidly, creating agap between these and ather regions, including the availability of telecommunication inffrastructures. Sujarwoto and Tampubollon (2016) use region variable to estimate spatial inequality and the internet divide in Indonesia. Furthemore, the model of the relationship between the demand for mobile phones (DFMP), GDP per capita (GDPC), and region (REGI) are as follows
DFMP = β0 + β1 GDPC + β2 REGI + ε1 (1a)
where βi (i = 0, 1, 2) are regression parameters, ε1 is error term, and GDPC is the natural logarithm of GDP per capita. Furthermore, REGI is
a dummy variable with REGI(x) = 1 if x = a province
in the Java-Bali region and REGI(x) = 0 if x = is not
a province in Java-Bali region.
Model (1a) may be further modiied by introducing the region as moderating variable on GDP per capita. This is done on the basis of telecommunication infrastructure is more developed in Java and Bali, and still limited for outside of the region;
so although GDP per capita in a province is high,
but if it is located outside Java and Bali; it will affect the demand for mobile phones. Reformulation of model (1a) becomes:
DFMP = β0 + β1 GDPC + β2 REGI + β3 GDPC.
REGI + ε2 (1b)
factor between GDP per capita (GDPC) and region (REGI).
As demand for internet services (DFIS) as model
(2a) is a function of the demand for mobile phones
(DFMP), GDP per capita (GDPC), proportion of the population enrolling in school (PPES), the proportion of the working population (WORK), and the location of the provinces (regions)
as dummy variables (REGI).
DFIS = α0 + α1 DFMP + α2 GDPC +α3 PPES
+ α4 WORK + α5 REGI + ε3 (2a)
where αj (j = 1,2,3,4,5) are regression parameters, ε3 is error term, and DFMP is a percentage
of household telephone users. The demand
for internet service is also applicable for interactional factors between GDP per capita and region in model (2b), as follows
DFIS = α0 + α1 DFMP + α2 GDPC + α3 PPES + α4 WORK + α5 REGI + α6 GDPC.REGI + ε4 (2b)
where ε4 is error term, αj (j = 1,2,3,4,5,6) are
regression parameters,. Furthermore, the estimate of the full model on mobile phones variables
resulting in reduced form as Model (2c)
DFIS = α0 + α1 (β0 + β1 GDPC + β2 REGI + ε1)
+ α2 GDPC + α3 PPES + α4WORK
+ α5 REGI + α6 GDPC.REGI + ε5 (2c)
where ε5 is error term, The signiicance of the indirect effect GDP per capita and region via
mobile phone demand in the demand for internet use Sobel Test.
Results and discussion
The development of the demand for telecommunication services in Indonesia
Table 2 presents the demand for telecommunication
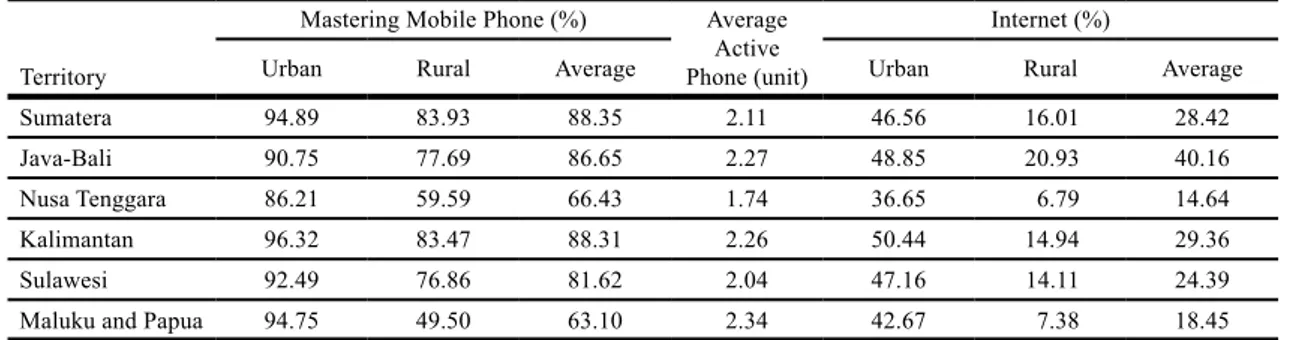
services by households in Indonesia. Table 2
shows that areas with the highest proportion
in the control of the mobile phone is Sumatra region
with the proportion of 88.35 percent. This
also applies to rural RT, and not for an urban
neighborhood dominated by Kalimantan
with the proportion of 96.32 percent. Based on
BPS data in 2014, the province with the household
had a mobile phone with the highest proportion
over 95 percent was Kepulauan Riau (Sumatra), DKI
Jakarta (Java-Bali region), and East Kalimantan
(Kalimantan), While the lowest one was Papua (Maluku and Papua region), which has not even
reached 50 percent. While the Java-Bali region as the center of the Indonesian economy only ranks
as the third after the Sumatra and Kalimantan.
In the aspect of the ownership of the number of active mobile phones, it seems that thehouseholds in Maluku and Papua had a higher mobile phone number other areas. But this seems to have more limited features and not used optimally for example for data access needs. Table 2 shows that
on average, the highest proportion of households
with access to the Internet is located in Java
and Bali, while Maluku and Papua is the second lowest, after the Nusa Tenggara region. Based on BPS data in 2014, the provinces with the highest
percentage of Internet usage were Jakarta (located in the Java-Bali region), and DIY (Java-Bali region)
and Riau (Sumatra region).
The determinant of demand for telecommunication services
Table 3 presents a model of the demand
for telecommunication services in Indonesia.
Model (1) and (2) are equal to the demand
of telephone service. On models (1a) shows that
the GDP per capita affects the demand for mobile
phone services, which was in line with research
of Gruber and Verboven (2001); Ahn and Lee (1999); and Jha and Majumdar (1999); and Abu and Tsuji (2010) for the case of developed
Sources: BPS 2014b, processed
Table 2: Households Mastering Mobile Phone and Internet Access by Region in Indonesia during 2012. Territory
Mastering Mobile Phone (%) Average Active Phone (unit)
Internet (%)
Urban Rural Average Urban Rural Average
Sumatera 94.89 83.93 88.35 2.11 46.56 16.01 28.42
Java-Bali 90.75 77.69 86.65 2.27 48.85 20.93 40.16
Nusa Tenggara 86.21 59.59 66.43 1.74 36.65 6.79 14.64
Kalimantan 96.32 83.47 88.31 2.26 50.44 14.94 29.36
Sulawesi 92.49 76.86 81.62 2.04 47.16 14.11 24.39
countries. While the position of the area showed no
signiicant difference in the use of mobile phones in Indonesia. After having the interaction between the region and the GDP per capita as Model (1b), it
appears that despite the negative sign, the position
of the area is not a signiicant factor that will increase the inluence of GDP on the demand of mobile phones.
Further, itting model of internet demand (2a), (2b), and (2c) seems that for the entire internet
demand model presented, it appears that education
and employment status variables had no signiicant effect. The results of this study are not consistent with Utomo’s reserch, et al, (2013); Cerno and Amaral (2005) and Taylor et al. (2003).
In the Model (2a) as an initial model of Internet
service demand showed that the use of any mobile
phone and GDP per capita effected on households
Internet use in Indonesia. The results of this study conirmed the indings of Cerno and Amaral (2005),
and Utomo et al (2013) showing that using a phone
positively affected Internet access at home.
The results also showed that households using
internet in Java-Bali region were higher than the outside of that region. This inding was not
in line with Al-Hammadani and Heshmati (2011)
for the case of Iraq. Furthermore, when the region
was positioned as a moderating factor of GDP
capita (Model 2b), it showed no signiicant result. The inal model of the internet demand of
households in Indonesia (Model 2c) which is a full model of (2a) appears that the effect of GDP per capita for internet usage is increasing due to the
mediation of the use of mobile phones. The biggest
effect of GDP per capita for internet usage in Model 3 was 10.178 and increased to 18.223 (Model 2c).
This indicates that mobile phone ownership may be
mediated the use of the internet for households in Indonesia.
The use of mobile phones in the media showed the increasing growth of features provided by the telecommunication industry, even the feature had been well understood not only the urban population, but also rural population. BPS data (2014b)
on the Indonesian communication statistics showed
that in 2012 there were 62.58 per cent households accessing Internet through mobile phones; and this number increased to 68.76 percent in 2013.
However, the results of research Utomo et al.
(2013) conirmed that the use of media in the phone to access the internet was not signiicant, yet the majority frequency on adolescents in Jakarta was
with higher levels of education. The use of Internet access for this group covered the whole purposes studied, which were email, social networks,
religious websites, news, job searching, capital markets, economic trends, work related projects,
studies, and other general information. In the case of Spain, as well as research Cerno and Amaral
(2005) that there was about 25.2 percent
of the Spanish population accessed the internet,
and the majority of them accessed over the phone that was equal to 74.6 percent
Conclusion
Indonesian territory is separated by oceans and consists of various islands requiring connectivity among regions. This connectivity can be done via telephone and internet media.
The development of telephone and internet usage
in Indonesia is increasing from year to year. This increase is inluenced by the income (GDP
per capita). In addition to the revenue factor, internet
usage is also inluenced by the region. So it seems
Note: *1% signiicant level, **5% signiicant level, and ***10% signiicant level
Sources: Own processing
Table 3: Estimation results of the model.
Variable Model 1a Model 1b Model 2a Model 2b Model 2c
C 9.792 -18.452 -68.643** -72.167** -63.933
DFMP 0.481*** 0.463***
GDPC 16.735** 23.353*** 10.178** 11.913* 18.223**
PPES 0.1 0.066 0.1
WORK 0.58 0.554 0.58
REGI 0.908 69.091 9.482*** 25.296 9.918
R 0.481 0.521 0.859 0.86
R2 0.232 0.271 0.737 0.739
Adj R2 0.18 0.196 0.689 0.679
that in Indonesia still lies an inequality adaptation in information technology between Java-Bali and out of Java-Bali. This condition will certainly affect the economy of the regions concerned. Therefore, efforts should be to improve the supply
side. The results also show that the demand
for the phone is able to mediate the use of internet.
In Indonesia, in 2012 there were 62.58 percent households accessing Internet through mobile phones; and this number increased to 68.76 percent
in 2013. However, there are still regions (Maluku
and Papua) which have not been optimally used
telephones to access the Internet compared to other areas.
Corresponding author: Muhammad Raiy
Department of Economics, Universitas Halu Oleo, Kendari 93232, Indonesia Phone: +6281242422252, E-mail : [email protected]
References
[1] Abu, S. T. and Tsuji, M. (2010) “The determinants of the global mobile telephone deployment:
an empirical analysis”, Informatica Economică, Vol. 14, No. 3, pp. 21-32. ISSN 1453-1305. E-ISSN 1842-8088.
[2] Adikari, A. M. P. (2013) “Determinants of mobile phone demand among university students“, Global Journal of Human Social Science Economics, Vol. 13, No. 5, pp. 1-6, E-ISSN 2249-460X.
ISSN 0975-587X.
[3] Ahn, H and Lee, M.-H. (1999) “An econometric analysis of the demand for access to mobile
telephone networks”, Information Economics and Policy, Vol. 11, No. 3, pp. 297-305.
ISSN 0167-6245. DOI 10.1016/S0167-6245(99)00016-5.
[4] Al-Hammadani, F. H. and Heshmati, A. (2011) “Determinants of internet use in Iraq“, International Journal of Communication, Vol. 5, pp. 1967-1989. ISSN 1932-8036.
[5] Badan Pusat Statistik Indonesi (BPS). (2014a) “Statistik Indonesia“, Jakarta: BPS.
[6] Badan Pusat Statistic Indonesia (BPS) (2014b) “Statistik komunikasi Indonesia“. [Online].
Available: https://www.bps.go.id/Subjek/view/id/2#subjekViewTab3. [Accessed: 23 June 2009].
[7] Badan Pusat Statistik Indonesia (BPS) (2014c) “Statistik ketenagakerjaan Indonesia“. [Online].
Avalilable: https://www.bps.go.id/Subjek/view/id/6#subjekViewTab3 [Accessed: 23 June 2009].
[8] Cerno, L. and Amaral, T. P. (2005) “Demand for internet access and use in Spain". [Online}
Available: http://eprints.sim.ucm.es/7897/1/0506.pdf [Accessed: 23 June 2009].
[9] Garbacz, C., and Thompson Jr., H. G. (2007) “Demand for telecomunication services in developing countries, Telecomunication Policy, Vol. 31, No. 5, pp. 276-289. ISSN 0308-5961.
DOI 10.1016/j.telpol.2007.03.007.
[10] Gruber, H. and Frank, V. (2001) “The Evolution of markets under entry and standards regulation-
the case of global mobile telecommunications”, International Journal of Industrial Organization,
Vol. 19, No. 7, pp. 1189–1212. ISSN 0167-7187. DOI 10.1016/S0167-7187(01)00069-8.
[11] Hsiao, M.-H., and Chen, L.-C. (2014) “Smart phone demand: an empirical study on the relationships
between phone handset, internet access and mobile services”, Telematics and Informatics, Vol. 32,
No. 1, pp. 158-168. ISSN 0736-5853. DOI 10.1016/j.tele.2014.06.001.
[12] Herrmann, A., Xia, L., Monroe, K. B. and Huber, F. (2007) ”The inluence of price fairness
on consumer satisfaction: an empirical test in the context of automobile purchases“,
Journal of Product and Brand Management, Vol. 16, No. 1, pp. 49-58. ISSN 1061-0421.
DOI 10.1108/10610420710731151.
[13] Jha, R. and Majumdar, S. K. (1999) “A matter of connections: OECD telecommunications sector
productivity and the role of cellular technology diffusion”, Information Economics and Policy,
[14] Kalmus V., Realo A. and Siibak, A. (2011) “Motives for internet use and their relationships
with personality traits and socio-demographic factors“, Trames, Vol. 15, No. 4, pp. 385–403.
ISSN 1406-0922, E-ISSN 1736-7514. DOI 10.3176/tr.2011.4.04.
[15] Kominfo (2011) “Indikator TIK Indonesia“. Jakarta: Puslitbang PPI-Kominfo.
[16] Mocnik, D., and Sirec, K. (2010) “The determinant of internet use controlling for income level: cross-country empirical evidence”, Information Economics and Policy, Vol. 22, pp. 243-256.
ISSN 0167-6245. DOI 10.1016/j.infoecopol.2010.01.002.
[17] Muslim, E., Nurcahyo, R., Pryanto, A., Prasetya, N and Nifthuljanah. (2010) “Analisis
industri telekomunikasi di Indonesia“, Jurnal Manajemen Teknologi. Vol. 9, No. 1, pp. 36-48. ISSN 1412-1700, E-ISSN 2089-7928.
[18] Olatokun, W. and Nwonne, S. (2012) “Determinants of user‘s choice of mobile service providers
in the Nigerian telecommunications market“, African Journal of Computing & ICT, Vol. 5., No. 4,
pp. 19-31. ISSN 2006-1781.
[19] Omotayo, O. and Joachim, A. A. (2008) “Customer service in the retention of mobile phone users
in Nigeria”, African Journal of Business Management, Vol. 2, No. 2, pp. 26-31. ISSN 1993-8233. [20] Park, E., and Ohm, J. (2014) “Factors inluencing users’ employment of mobile map services”,
Telematics and Informatics, Vol. 31, pp. 253-265. ISSN 0736-5853. DOI 10.1016/j.tele.2013.07.002.
[21] Rahman, S., Haque, A. and Ismail, S. A. (2010) “Exploring inluencing factors for the selection
of mobile phone service providers: A structural equational modelling (SEM) approach on Malaysian consumers“, African Journal of Business Management, Vol. 4, No. 13, pp. 2885- 2898. ISSN 1993-8233.
[22] Sujarwoto, S. and Tampubolon, G. (2016) “Spatial inequality and the internet divide in Indonesia
2010-2012”, Telecommunication Policy, Vol. 40, No. 7, pp. 602–616. ISSN 0308-5961.
DOI 10.1016/j.telpol.2015.08.008.
[23] Taylor, W. J., Zhu, G. X., Dekkers, J and Marshall, S. (2003) “Factors affecting home internet use
in Central Queensland“, Informing Science Journal, Vol. 6, pp. 233-245. ISSN 1521-4672. [24] Utomo, A., Reimondos, A., Utomo, I., MCDonald, P. and Hull, T. H. (2013) “Digital inequalities
and young adults in Greater Jakarta: a socio-demographic perspective“. International Journal of Indonesian Studies, Vol. 1, pp. 79-103. ISSN 2203-4692.
[25] Vaněk, J., Jarolímek, J. and Vogeltanzová, T. (2011) “Information and communication technologies
for regional development in the Czech Republic – broadband connectivity in rural areas”, Agris on-line Papers in Economics and Informatics, Vol. III, No 3, pp. 67-76. ISSN 1804-1930.