THIS REPORT WAS PREPARED BY MICHAEL TANJUNG, A MASTERS IN FINANCE STUDENT OF THE NOVA SCHOOL OF BUSINESS AND
ECONOMICS, EXCLUSIVELY FOR ACADEMIC PURPOSES.THIS REPORT WAS SUPERVISED BY ROSÁRIO ANDRÉ WHO REVIEWED THE VALUATION METHODOLOGY AND THE FINANCIAL MODEL. (SEE DISCLOSURES AND DISCLAIMERS AT END OF DOCUMENT)
See more information at WWW.NOVASBE.PT Page 1/36
M
ASTERS IN
F
INANCE
EQUITY RESEARCH
We initiate coverage of Telkom with BUY recommendation and a price target of 2,550 IDR, offering an upside potential of 20%. The stock currently trades at a P/E ratio of 14.15 – a 30% discount to the telecommunication sector.
Risk factors. Firstly, we foresee XL-AXIS merger and acquisition to be the game changer for the Indonesian cellular market. Ultimately, by retaining Axis’ spectrum, XL’s network bandwidth is now on par with Telkomsel. Secondly, inevitable pricing compression caused by fierce competition in the cellular market would eventually result in Telkomsel lower margin.
Segments development. We expect the continuingly fixed-to-mobile substitution effect to further penalize fixed-line voice sector. As for the fixed-broadband segment, rapidly growing middle class population, rising household consumption and incremental number of new enterprises created every year would provide a solid platform for robust growth. Mobile broadband will be the new growth engine fuelled by Indonesian young population, and growing urban population, which subsequently promotes higher penetration of advance telecommunication gadget such as smartphone and tablet. In spite of fierce competition in the cellular market, Telkomsel’s persistently strong cash flow derived from its large business scale and superior operational efficiency will enable the company to preserve its superior network quality and market share.
Company description
Telkom is the largest and most integrated telecommunication service provider in Indonesia, providing fixed wireline, fixed wireless, cellular, data and Internet services to over 90% of Indonesian population.
PT.
T
ELEKOMUNIKASI
I
NDONESIA
C
OMPANY
R
EPORT
T
ELECOM
06
J
ANUARY2014
S
TUDENT
:
M
ICHAEL
T
ANJUNG
[email protected]
Challenging Year Ahead
…
yet to be conquered
Recommendation: BUY
Price Target FY11: 2,550 IDR
Price (as of 6-Jan-14) 2,125 IDR
Reuters: TLKM.JK, Bloomberg: TLKM IJ
52-week range (IDR) 1,751-2,566 IDR
Market Cap (trillion IDR) 214.2
Outstanding Shares (B) 100.8
Free float (B) 49.2
Source: Bloomberg
Source: Bloomberg
(Values in Rp billions) 2012A 2013E 2014F
Revenues 77,143 83,145 89,027
EBITDA 39,757 42,987 45,742
Net Profit 12,850 14,172 15,137
EPS 127 141 150
EV/Sales 3.4 3.1 2.9
EV/EBITDA 6.2 5.8 5.5
EV/Subscribers 1.7 1.7 1.7
Net (Debt)Cash/EV -1.6% 0.6% -0.1%
ROIC 30% 30% 28%
PT.TELEKOMUNIKASI INDONESIA COMPANY REPORT
PAGE 2/36
Table of Content
COMPANY OVERVIEW ... 3
VALUATION METHODOLOGY... 4
MACROECONOMIC OUTLOOK ... 5
FIXED LINE BUSINESS ... 6
FIXED-LINE VOICE – THE INEVITABLE DECLINE ... 6
FIXED WIRELESS ACCESS VOICE – THE END IS NEAR... 8
FIXED BROADBAND – DECENT GROWTH POTENTIAL ... 9
CELLULAR BUSINESS ... 11
VOICE USAGE AND TARIFF ... 16
SMS ... 16
MOBILE BROADBAND “FLASH”– THE FUTURE GROWTH ENGINE ... 17
INTERCONNECTION ... 21
OPERATING COST MARGIN AND INVESTMENTS ... 21
FIXED BUSINESS MARGIN ... 22
CELLULAR BUSINESS MARGIN ... 23
FIXED LINE INVESTMENTS ... 24
CELLULAR INVESTMENTS ... 24
FOREXRISKS ON INVESTMENTS ... 25
CAPITAL STRUCTURE AND COST OF CAPITAL ... 26
FINAL VALUATION CONSIDERATIONS ... 27
APPENDIX I
–
FINANCIALS ... 28
APPENDIX II
–
ADDITIONAL SCENARIO ANALYSIS ... 29
APPENDIX III
–
INDONESIAN MOBILE OPERATORS ... 31
APPENDIX IV
–
BROADBAND TARIFF COMPARISON ... 31
APPENDIX V
–
SPECTRUM AND 3G BAND PLAN ... 32
APPENDIX VI
–
BTS FORECAST ... 33
APPENDIX VII
–
FOREX RISK ON INVESTMENTS ... 34
APPENDIX VII
–
COMPARABLES ... 34
DISCLOSURES AND DISCLAIMER ... 35
PT.TELEKOMUNIKASI INDONESIA COMPANY REPORT
PAGE 3/36
Source: Bloomberg
Graph 2 – 2012 Shareholder Structure Graph 1 – 2012 Telkom Revenues Contribution by Segments
Company overview
PT. Telekomunikasi Indonesia (Telkom) is the largest and most integrated telecommunication company (telco) in Indonesia. Telkom’s source of value creation is wholly derived from its domestic telecommunication businesses including fixed line and fixed wireless telephone connections, mobile cellular communications, network and interconnection services, and data communication services. Telkom still enjoys monopoly in the fixed line telephone segment; notwithstanding, we see an inevitable declining demand for based voice services due to continuing to-mobile substitution effect. Telkom is currently a leading player in the fixed-broadband sector with 78% market share; fixed-fixed-broadband market has been growing significantly with rising middle class population; we see a tremendous growth opportunity for the upcoming terms. Through its subsidiary, Telkomsel1, Telkom provides cellular connectivity that covers more than 97% of the Indonesian population. Telkomsel has the largest subscribers’ base amounted to 44% market share in 2012; nevertheless, a recently merged XL-Axis (XL:IJ) would definitely challenge its dominance. As of December 2012, Telkomsel revenues contribution totalled to 71%.
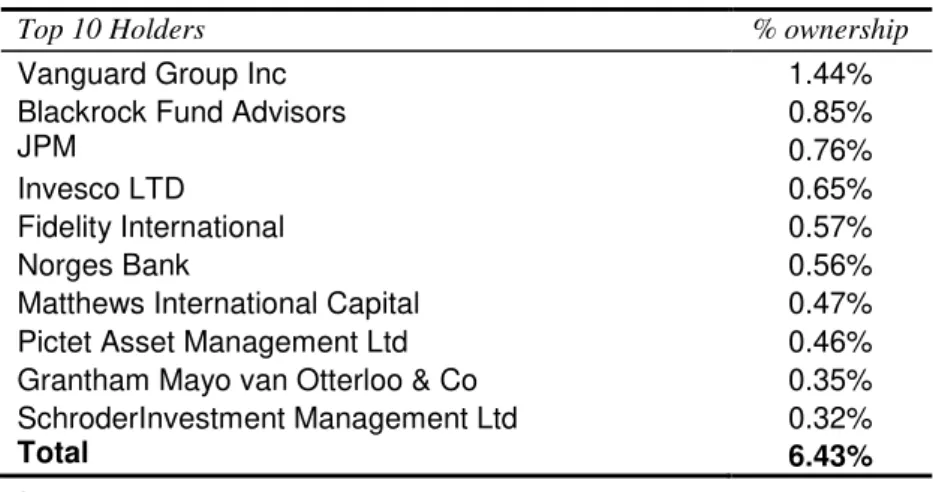
Still a State Owned Enterprise
Telkom is a State-Owned Enterprise (SOE) as government owns more than 50% of all shares outstanding. The remaining shares are listed on the Indonesia Stock Exchange, NYSE and LSE. Bank of New York Mello Corporation serves as the Depository of registered American Depository Shares (ADS) holders for the
Company’s ADSs2
. Table 1 below presents other top holders;
Table 1 - Institutional Shareholders as of December 2013
Top 10 Holders % ownership
Vanguard Group Inc 1.44%
Blackrock Fund Advisors 0.85%
JPM 0.76%
Invesco LTD 0.65%
Fidelity International 0.57%
Norges Bank 0.56%
Matthews International Capital 0.47%
Pictet Asset Management Ltd 0.46%
Grantham Mayo van Otterloo & Co 0.35%
SchroderInvestment Management Ltd 0.32%
Total 6.43%
1Telkom assumes control of Telkomsel with 65% ownership, the remaining 35% belonged to Singapore Telecom (ST:SP)
2As of September 30, 2013, 45,765,152 ADS shares were listed on the NYSE and LSE. Following the 1-for-5 stock split
(approved on April 19, 2013), each ADS represented 200 common shares.
PT.TELEKOMUNIKASI INDONESIA COMPANY REPORT
PAGE 4/36
Unit: billion IDR, unless stated otherwise | Source: Analyst’s Estimates, Bloomberg, Company Reports
Valuation Methodology
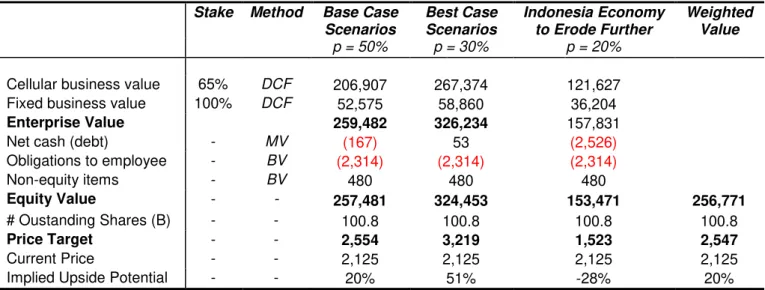
We used a sum of parts (SOP) approach to arrive at the final equity value. Fixed and cellular business segments were valued separately using Discounted Cash Flow (DCF) model. Net debt/cash was derived by deducting excess cash (book value) from market value (MV) of debt. Obligations to employee and other non-equity items were obtained from their book value (BV). We have reached a price target of 2,586 IDR, implying an upside potential of 19%.
We have incorporated various scenarios that could impact our initial cash flow forecast, and the respective price target. The probability attributed to each scenario analysis is solely our view on current market situation.
Following table summarizes our valuation;
Table 2 - Summary of Telkom Valuation
Stake Method Base Case
Scenarios Best Case Scenarios Indonesia Economy to Erode Further Weighted Value
p = 50% p = 30% p = 20%
Cellular business value 65% DCF 206,907 267,374 121,627
Fixed business value 100% DCF 52,575 58,860 36,204
Enterprise Value 259,482 326,234 157,831
Net cash (debt) - MV (167) 53 (2,526)
Obligations to employee - BV (2,314) (2,314) (2,314)
Non-equity items - BV 480 480 480
Equity Value - - 257,481 324,453 153,471 256,771
# Oustanding Shares (B) - - 100.8 100.8 100.8 100.8
Price Target - - 2,554 3,219 1,523 2,547
Current Price - - 2,125 2,125 2,125 2,125
PT.TELEKOMUNIKASI INDONESIA COMPANY REPORT
PAGE 5/36
Units: trillion IDR | Source: IMF
Graph 4 – Indonesia GDP Growth YoY Graph 5 – Indonesia Domestic Interest Rate and Inflation
Macroeconomic Outlook
Indonesian economy has been contracting recently; IMF revised GDP growth down to 5.3% in September 2013 from previously 6.3% in April 2013, but expecting slight recovery to happen in 2014.
Table 3 – Indonesia GDP Forecast (Constant Price)
2008 2009 2010 2011 2012 2013E 2014F 2015F 2016F 2017F 2018F GDP 2,082 2,179 2,314 2,465 2,618 2,757 2,908 3,083 3,268 3,464 3,672 % growth 6.0% 4.6% 6.2% 6.5% 6.2% 5.3% 5.5% 6.0% 6.0% 6.0% 6.0%
We are informed that the revision was triggered by recently high inflation3 that forced Bank Indonesia (BI) to continuingly raising interest rate, which in turn had slowed the overall economy growth due to higher borrowing cost (reduces economic activity) and higher saving rate (reduces consumption as people tend to save instead). Furthermore, BI rate is expected to be escalating further4 until the inflation rate ease back to the target level of 4%-5%, which means growth would continue being penalized in 2014, at the very least.
Other various macroeconomic and demographic indicators will certainly steer our cash flow forecast; nevertheless, their relevance may differ per business segment, as such we will cover them specifically and separately for each business segment.
3 As seen in graph 5, Indonesian inflation rate has been very volatile which was mostly caused by large amount of
government subsidy on basic needs like food, fuel and electricity. Early this year government reduced subsidy on fuel and let the price of gasoline and diesel inflated by 44% and 22% respectively (to 6,500 IDR and 5,500 IDR per litre); this had directly and swiftly caused a huge jump in inflation rate, as basic needs such as transportation, for instance, became more expensive and led to higher end-products or services (due to higher logistic costs). World Bank estimates that raw and core inflation would rise approximately by 300bps and 100 bps respectively when fuel prices increased by 2,000 IDR.
4We are also informed that Indonesia’s large current account deficit has caused loss of confidence from foreign investors
who started pulling their money out of the country in anticipation of the approaching FED tapering. Besides to control inflation, higher interest rate is also perceived as an incentive for foreign funds to remain intact. Additionally, Rupiah would remain vulnerable as account deficit has showed no meaningful improvement lately, and thus high inflation would likely to persist longer; we see this as a downside risk to our initial earnings estimates; we discuss this further under Additional Scenario Analysis section.
PT.TELEKOMUNIKASI INDONESIA COMPANY REPORT
PAGE 6/36
Graph 6 – Total Minutes Productions from Fixed-Line Voice (LHS) Vs. Cellular Voice (RHS) Services
Graph 7 – 2012 Fixed-line Voice Penetration Rates per 100 Households
(Average: 33)
Units: # households | Source: ITU,
Analyst’s Estimates
Fixed Line Business
Fixed-line Voice
–
the inevitable decline
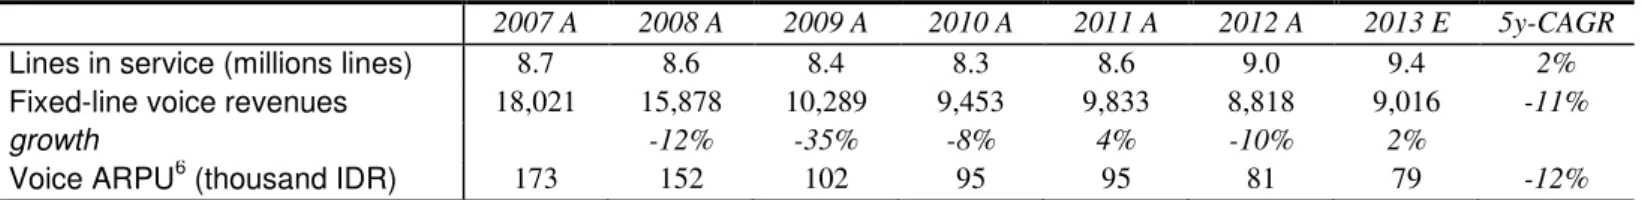
Telkom fixed-line telephone service is no other than the plain old telephone service. This fixed-line telephone service includes local, direct long-distance (DLD) and international call service. Telkom still enjoys monopoly in this segment with 99% market share; because of an inevitable decline of the sector growth and subsequently low potential of value creation, fixed-line telephone segment seems to attract no new entrants. For the last 5 years, this sector has suffered from fixed-to-mobile substitution effect. The overall decreased in total minutes production implies that minutes production per lines in service (LIS)5 has decreased by roughly 1,700 minutes in 2008 to only 755 minutes in 2012. As seen in table 4, fixed-line voice revenue contribution has shrunk considerably;
Table 4 – Telkom Fixed-line Voice Subscribers and Revenues Evolution
2007 A 2008 A 2009 A 2010 A 2011 A 2012 A 2013 E 5y-CAGR
Lines in service (millions lines) 8.7 8.6 8.4 8.3 8.6 9.0 9.4 2%
Fixed-line voice revenues 18,021 15,878 10,289 9,453 9,833 8,818 9,016 -11%
growth -12% -35% -8% 4% -10% 2%
Voice ARPU6 (thousand IDR) 173 152 102 95 95 81 79 -12%
Note that ARPU includes fixed monthly subscription charges and usage charges, which the latter contributes disproportionately larger. Persistently declining ARPU is in fact a result of lower usage per LIS, conversely the implied price per minute7 has actually increased from 1,119 IDR in 2008 to 1,297 IDR in 2012. At this rate, fixed voice service is actually charging much higher than cellular voice service (of only 166 IDR8 per minute), adding another reason why people tend to use their cell-phones nowadays.
Despite the substitution effect aforementioned, we believe that low penetration rate in the fixed-line telephone sector (refer to graph 7) would still provide little room for growth, and that the essentialness of basic telephony would drive penetration higher in the future. In fact, we see a slight pickup in LIS in 2011 after the cellular penetration rate surpassed 100% mark in late 2010, whilst utilization rate has been rising from 78% to 81% and 82% in 2012 and 2013 respectively (refer to graph 8).
5We refer subscribers in the fixed-line telephone sector as LIS
6Average revenue per user (ARPU) is calculated based on total voice revenues per month divided by total LIS
7
Price per minute is calculated by dividing voice revenues by total minutes production
8
This amount is calculated based on 2012 cellular voice revenues and total cellular minutes production (including free minutes). Lower price per minute seen in cellular voice services is due to excessive promotions (free calls) caused by intense competition in the mobile market. We discuss further under Cellular Business section.
Units (revenues): billion IDR | Source: Company Reports Units: billion minutes | Source:
PT.TELEKOMUNIKASI INDONESIA COMPANY REPORT
PAGE 7/36
Graph 8 – Number of Lines in Service, Installed Lines (LHS) and Utilization Rate (RHS)
Units: million lines | Source: Company
Reports, Analyst’s’ Estimates
Graph 9 – Voice ARPU Forecast
Units: trillion IDR and thousand IDR (ARPU) | Source:
Analyst’s estimates
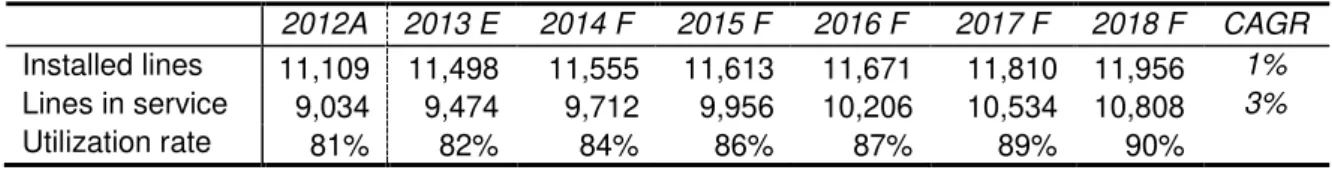
Since the fixed-line telephone penetration is still concentrated in big cities and urban area9, we assume that Telkom would continue adding new lines with intention to drive penetration in the sub-urban or rural area higher. Nevertheless, we foresee the additional lines to grow at a slower pace than 3% CAGR verified from 2004-2013, with priority set to utilize lines back to 90% level10.
Provided the expected additional installed lines for the upcoming terms, we could then infer the incremental LIS by estimating utilization rate in the future of which is to converge towards 90% rate. The following table presents our forecast summary for the next 5 years;
Table 5 – Fixed-line Telephone Forecast
2012A 2013 E 2014 F 2015 F 2016 F 2017 F 2018 F CAGR Installed lines 11,109 11,498 11,555 11,613 11,671 11,810 11,956 1% Lines in service 9,034 9,474 9,712 9,956 10,206 10,534 10,808 3%
Utilization rate 81% 82% 84% 86% 87% 89% 90%
Our estimation implies a growing subscribers’ base (LIS) at CAGR of 3%11, still lower than 4.5% CAGR yielded during 2010-2013.
In what regards the ARPU, we expect the downtrend would continue in near future12as we are still convinced that the fixed-line usage will decline further due to voice-to-data substitution effect. Over the top VoIP application such as Skype has become more popular and been used globally, not only for home-personal use, but also professionally, such as on-line meeting, job interview and university admission interview. Moreover, currently low penetration in the broadband sector coupled with substantial growth potential would surely affect Telkom legacy business including local, DLD and international call services; as such we believe that the fixed-line usage would still plummet in the foreseeable future.
As for the longer timeframe, we expect fixed-mobile/voice-data substitution effect to start lessening, and the respective usage per LIS to find the equilibrium and stop decreasing; and therefore ARPU would rise due to a higher unit price13.
9Yet we could not infer precisely how many cities are currently covered by Telkom and which cities are still to be covered, as
the information in that regards is not disclosed.
10
Telkom has indicated that CAPEX related to fixed-line business would be mostly allocated to the fixed-broadband network development, thus it would be reasonable to assume slower expansion in the fixed-line telephone.
11
At this rate, we implicitly expect fixed-line telephone penetration rate to reach 33% mark (or equal to current APAC average) in the next 20 years.
12
We are still convinced that fixed-line usage would still decline in near future due to voice-data substitution (we discuss this issue in greater detail under Cellular Business section).
13Bear in mind that ARPU is a function of usage (minutes production/user) and unit prices (price per minute). Though usage
is presumed to be constant over time, a rising unit price would still result in higher ARPU. We use expected inflation as proxy.
PT.TELEKOMUNIKASI INDONESIA COMPANY REPORT
PAGE 8/36
Graph 13 – Flexi Revenues Contribution
Graph 10 – FWA Telephone Market Share Evolution over the Last 7 Years
Source: Company reports, Analysts’
estimates
Graph 11 –Indonesia FWA Subscribers’ Base Trend
Graph 12 – 2013 Flexi Subscribers Base Contraction
Units: million users | Source: Telkom Q3 2013 info memo
Graph 14 – ARPU Trend of Flexi and Esia
Fixed Wireless Access Voice
–
the end is near
Telkom’s fixed wireless access (FWA) voice service is managed by the Wireless Broadband Divisionunder the trademarks “Telkom Flexi” or “Flexi” and uses CDMA-base network technology.
As of December 2012, Flexi and Esia14 are the main operators in the sector with the subscribers’ base totalled to more than 97% market
share when combined, see graph 10.
As also seen in the fixed-line telephone, threat of substitute is even greater in the FWA voice sector. New tariff regulation15 has turned the differences between FWA and GSM mobile cellular tariff immaterial. Moreover, the ever-fiercer competition in the GSM cellular market has provoked lower tariff charged by the GSM-based operators16. Apparently with similar cost of usage, customers would rather have GSM-based mobile phone as it provides more
features and richer application experiences. Altogether these circumstances promote migration to a full mobile GSM service. As seen in graph 11, the FWA voice market has finally taken a massive hit this year after peaked earlier in 2010; the
overall subscribers’ base plummeted by more than 40%.
Flexi has suffered the worst from pricing compression, as it has been giving excessive promotions17 in order to maintain its
subscribers’ base size, see graph 14 and 10; Esia on the other side has kept ARPU above 20 thousand IDR, yet lost more than 20% of subscribers in 2012 alone. Flexi’s revenue contribution has shrunk remarkably since 2009; and we estimate its revenues to be just under 1,000 billion IDR for FY13 following the 9M-2013 results released. In that same period, Flexi lost more than 30% of its subscribers, refer to graph 12.
14
Esia is another FWA voice services provider operated by Bakrie Telecom (BTEL)
15 The government altered the regulation relating to the calculation of right-of-use tariff in December 2010, resulting in a
significantly smaller gap between GSM and CDMA tariff.
16As of December 2013, average price of voice service charged by FWA provider is 1,666 IDR per minute, which is very
close to GSM-based operators’ average tariff per minute of less than 1,799 IDR. Price already includes interconnection cost.
Source: Operators’ website.
17Free minutes derived from promotions surely put pressure on ARPU, as unit price decreases while usage is not necessarily
increased.
Units: billion IDR | Source: Company
reports, Analysts’ estimates
Units: million users | Source: ITU, Analyst’s
estimates
PT.TELEKOMUNIKASI INDONESIA COMPANY REPORT
PAGE 9/36
Graph 15 – Flexi Subscribers and ARPU Forecast
Graph 16 – 2012 Asia Pacific GDP per Capita PPP constant US$
Graph 17 – Fixed Broadband Penetration per 100 Households
Graph 18 – Speedy Market Share Evolution
According to the CFO, Mr Honesti Basyir, Telkom intends to gradually withdraw FWA voice services over the next two or three years. We see this as an appropriate move by the management; as spectrum becomes a scarce national resource, 10 MHz spectrum blocks on 850 MHz18 frequency used by Flexi can be returned and re-used by Telkomsel to provide a lower-end and cheaper data service19.
To conclude, we forecast Flexi’s subscriber to continue declining sharply for the next 2-3 years, afterwards the service is presumed terminated. ARPU is expected to rise as we assume Flexi would start reducing promotions (free calls), and thus unit price would eventually converge to market price.
Fixed Broadband
–
decent growth potential
Telkom provides fixed-line based broadband internet access using ADSL and fiber
optic technology under the brand “Speedy”. Fixed broadband is still perceived as a premium need in Indonesia, and rather explains
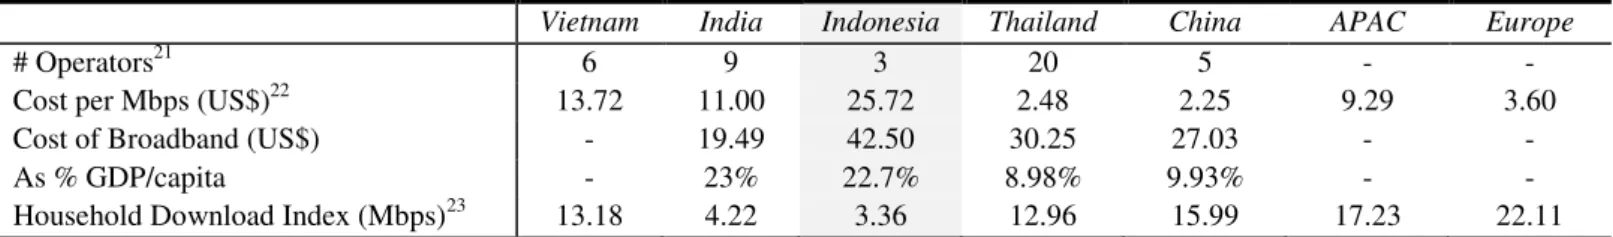
low broadband penetration in the country that has lower GDP per capita than most of its Asia Pacific (APAC) peers. Looking further into the penetration rate, we are left with more questions; as seen in graph 16 and 17 consecutively, Vietnam, India, and Phillipines has higher broadband penetration rate than Indonesia despite their lower production per capita. What might be the setback for Indonesia, besides its rather challenging geography condition? Following is our best guess;
Indonesian customers have fewer fixed-broadband service choices and incur higher prices as the fixed-broadband sector is lack of operators and therefore experiences less efficient competition; in fact, Speedy holds 78% market share in Indonesia (as per December 2012). Unit price for 1 Megabit per second (Mbps) is comparatively much higher in Indonesia, yet the average speed of fixed-broadband internet connection is not truly superior to the available connection speed provided by the mobile broadband services, of which is accessible with a lower cost, see graph 1920. Thus, it is no surprise that fixed-broadband penetration is rather limited in Indonesia.
18
CDMA-base operators currently use 850 MHz frequency band to provide voice and data services, whilst GSM-3G use 2,100 MHz frequency.
19Spectrum license for providing telecommunication services through 850 MHz frequency is priced much cheaper than the
2,100 MHz used for 3G, the associate radio usage charges are also lower, thus allowing Telkomsel to provide cheaper data-service for the lower-end market. This way Telkomsel would have more flexibility to maintain its premium data-services and prices without putting more pressure on its operating margin. If executed rightfully, Telkom would be able to create additional value in the long run through its more efficient spectrum management.
20
The data presented is the actual speed. In practice, operators claim 7.2 Mbps for their 3G connection download speed. Moreover, the average mobile broadband cost per Mbps is lower than 5 US$. Notwithstanding, fixed broadband still has an advantage of higher capacity of usage and a more reliable internet connection. See appendix IV for tariff comparison.
Units: million users (Subs.) and thousand IDR (ARPU) | Source: Company Reports, Analyst’s Estimates
Units: # households | Source: ITU, Analyst’s estimates
Source: World Bank
PT.TELEKOMUNIKASI INDONESIA COMPANY REPORT
PAGE 10/36
Graph 19 –Indonesia Broadband Speed Comparison
Units: Megabit per second (Mbps) | Source: ITU, Ookla
Graph 20 –Fixed Broadband Subscriptions in Indonesia
Graph 23 – Decreasing cost to start a business, and increasing number of new business registered every year Graph 21 – Indonesia Households Consumption
Expenditure
Table 6 - 2013 Fixed Broadband Comparison Matrix
Vietnam India Indonesia Thailand China APAC Europe
# Operators21 6 9 3 20 5 - -
Cost per Mbps (US$)22 13.72 11.00 25.72 2.48 2.25 9.29 3.60
Cost of Broadband (US$) - 19.49 42.50 30.25 27.03 - -
As % GDP/capita - 23% 22.7% 8.98% 9.93% - -
Household Download Index (Mbps)23 13.18 4.22 3.36 12.96 15.99 17.23 22.11
Despite the aforementioned hindrance, we believe that low penetration rate would still provide decent growth opportunity for Telkom Speedy in the future.
We expect the subscribers’ base to grow at slightly lower rate in 2014 than seen in 2012-2013 amid recent economy contraction aforementioned under Macroeconomic Outlook section24. As for the longer run, it would be reasonable to forecast stronger growth provided a solid platform formed by rapidly growing middle class population, firm economy growth and
growing number of new enterprises created every year (refer to graph 22 and 23). Additionally, household consumption has also been increasing exponentially, which signals growing demands for premium products/services.
21
This indicator aims to explain bargaining power of buyer, more number of operators implies that customers have more choices and that competition is presumably more efficient resulting in generally lower prices. Though may be not entirely true, but the fact that Speedy holds more than 75% market share, which results in high market concentration, customers are therefore inferred low bargaining power.
22
Cost per Mbps measures the median cost charged by the provider for 1 Mbps. Indonesia is among the highest by a far margin.
23
Household download index measures average download speed per broadband connection. Additional information,
European countries’ average download speed is above 20Mbps.
24Recently high inflation that is expected to persist until mid-2014 would really penalize customers’ purchasing power; as
such we expect their spending behavior would be shifted towards premier needs, such as food, transportation, etc.; thus available income for premium needs would be reduced, and premium products or services, including fixed-broadband service would surely be less attractive.
Source: ITU, Ookla, Companies’ Websites
Units: thousand subscribers | Source: ITU
Graph 22 – Percentage of Household with Disposable Income Larger than 15,000 USD and 25,000 USD
Source: Euromonitor Source: World Bank Units: billion USD | Source: World Bank
PT.TELEKOMUNIKASI INDONESIA COMPANY REPORT
PAGE 11/36
Units: billion IDR (revenues) and thousands IDR (ARPU) | Source: Company Reports, Bloomberg
Graph 24 – Speedy Subscribers and ARPU Forecast
Units: thousand subscribers and thousand IDR (ARPU) | Source: Analyst’s estimates
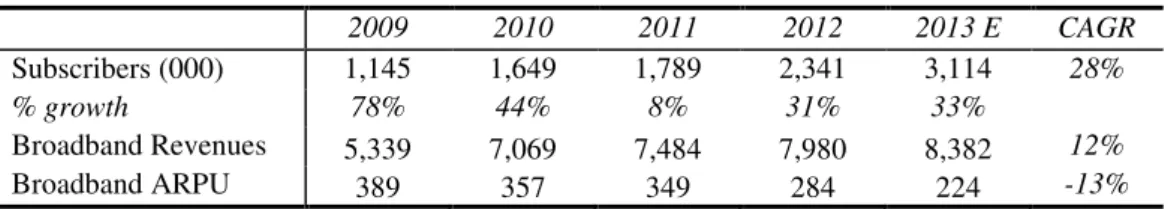
Table 7 - Speedy Subscribers and Monthly ARPU (last 5 years)
2009 2010 2011 2012 2013 E CAGR
Subscribers (000) 1,145 1,649 1,789 2,341 3,114 28%
% growth 78% 44% 8% 31% 33%
Broadband Revenues 5,339 7,069 7,484 7,980 8,382 12%
Broadband ARPU 389 357 349 284 224 -13%
Telkom had introduced “Speedy Instant” or pre-paid subscription25 that provides more flexibility to subscribers, which explains significant ARPU declined in 2012 and 2013, yet the impact on the overall revenue was being offset by the strong growth of
the subscribers’ base, refer to table 7 - Broadband ARPU.
Telkom has recently engaged in fiber network roll-out26, and we foresee the better technology27 would facilitate the demand for larger data capacity and faster connection; we shall later see a clear distinction between mobile and fixed broadband in terms of speed and capacity.
We forecast Speedy subscribers’ base to continue growing at CAGR of 30% for the next 2-3 years, and of 10% thereafter. Our perpetuity growth estimation implies that fixed broadband subscriptions in Indonesia would reach 50% penetration rate in approximately 2028 years from today.
In what concerns ARPU, we expect the declining trend to continue in the future due to increasingly growing number of pre-paid subscribers29 and the fact that Telkom is already charging higher unit price than its APAC peers average, we foresee a gradually declining tariff30.
25Pre-paid subscribers are being charged the same initial amount for equipment (including modem) installation. The monthly
charge will be then accumulated according to their monthly usage.
26We could not infer how many households were actually under FTTH subscriptions. Telkom only disclosed in its reports that
it had roughly 5 million homepass capacity in 2012 and aimed to reach 15 million by 2015.
27
Telkom is upgrading their old copper network with fiber to the home (FTTH), thus we expect higher speed and capacity to be delivered in the future.
28
We assume that the average persons of approximately 4 per household will not change in the future, and the population will continue growing at CAGR of around 1% in the long run-as projected by the IMF.
29
Pre-paid subscribers tend to have control over their own expenditure by simply limiting the usages, hence implying a rather lower ARPU.
30It would be reasonable to see lower tariff in the future driven by the regulator (as was seen in cellular market couple years
PT.TELEKOMUNIKASI INDONESIA COMPANY REPORT
PAGE 12/36
Source: Analyst’s estimates, Company reports
Graph 27 – 2012 Asia Pacific Cellular Penetration per 100 Inhabitants
Units: million users | Source: ITU
Graph 28 – Average Price for a Prepaid Starter Pack
Units: US$ | Source: Company Websites
Cellular Business
Over the past years, mobile cellular market has overshadowed other telecommunication services sectors in Indonesia; and with subscribers’ base totalled to more than 280 million in 2012, it has become the fourth largest cellular market in the world31.
According to the Indonesian Telecommunications Regulatory Authority (BRTI), it is common that a single user owns more than one mobile phone and holds 2-3 active SIM cards with reason to get the best network quality (higher-end user) or cheapest price (lower-end user) available. We see this as an opportunity for continuing growth being sustained in near terms. As such, we forecast Indonesian cellular subscribers’ base to continue increasing at CAGR of 4% (lower than 6% yielded in 2012-2013) for the next 3 years, and of 1% in perpetuity32.
Indonesian cellular market is characterised with high churn rate and highly disproportionate number of prepaid subscribers (refer to graph 30). In fact, we also see a correlation between low GDP per capita and high number of pre-paid subscribers. We believe that a cheap prepaid-starter-pack (refer to graph 28) coupled with limited financial means to commit for a post-paid plan explains why Indonesian cellular market is flooded by pre-paid subscribers. This also partly explicates low cellular average revenue per user (ARPU)33 seen in Indonesian cellular market.
Graph 29 displays ARPU evolution relatives to GDP per capita, which seems, has reached the equilibrium (of around 2%-2.5%). We assume similar pattern to hold in
31
Top 5 global mobile markets by number of subscribers (2012); China (1,112 million users), India (865 million users), USA (303 million users), Indonesia (282 million users), Brazil (248 million users). Source: ITU
32
We look into Bloomberg (Bloomberg Industry – Telco Asia Pacific) forecast for Asia Pacific mobile sector growth of 7% CAGR as proxy; since the forecast made by Bloomberg includes China and India – of which their cellular penetration rate is still below average, it would be reasonable to forecast a slower growth for Indonesia. As for perpetuity, we expect the subscribers base to increase with population; population is projected to grow at CAGR of 1% by World Bank.s
33Bear in mind that pre-paid subscribers have greater control over their own cellular service expenditure by limiting usage.
Generally pre-paid ARPU will be much lower than post-paid ARPU.
Graph 25 – Cellular Revenues Contribution throughout the Years
Units: # users | Source: ITU
Graph 26 – Cellular Subscriptions in Indonesia
PT.TELEKOMUNIKASI INDONESIA COMPANY REPORT
PAGE 13/36
Graph 31 – Indonesian Cellular Market Share Evolution
Graph 29 – ARPU to GDP per Capita Comparison Graph 30 – Churn Rate vs. Prepaid Subscribers (as % of total cellular subscribers)
Graph 32 – HHI of Indonesian Cellular Market
Source: Company reports,
Analyst’s estimate
the long run, meaning that cellular ARPU is to increase consistently with GDP per capita34.
In 2001, the government liberalized the cellular market; and since then there have been three big players namely Telkomsel (TLKM:IJ), Indosat (ISAT:IJ), and XL Axiata (EXCL:IJ) that control more than 80% market share (as of December 2012, see graph 30). The other operators are briefly described in the appendix III.
Using Herfindahl-Hirschman Index (HHI)35-that measures industry concentration level we see that competition has been escalating sharply (measured by a decreasing HHI index – showing of a less concentrated market). Smaller operators namely, Axis (not listed) and Hutchison Indonesia (not listed) have been significantly re-establishing their position in the market for the last 3 years36. As seen in graph 31, XL was the one mostly affected37 by their stronger presence.
In early 2013, XL proposed an acquisition of Axis, which was recently approved38 in the beginning of December 2013 by the Ministry of Communication and Information (KOMINFO) with a certain term that obliges them to return spectrum blocks of 10 MHz in 2,100 MHz frequency band used for 3G network. Even after returning 10 MHz frequency blocks, XL-Axis now has spectrum capacity as large as Telkomsel;
34Note that we only use this additional information to triangulate our ARPU estimation, not to actually forecast the ARPU.
35HHI is calculated by summing of the squares of the market shares of all cellular operators. The value ranges from 0 to
10,000. HHI Index of 10,000 indicates market-monopoly while 0 implies a nearly perfect competition. For example, market of 8 participants (as in the case of Indonesia cellular market) with perfectly equal market share would have a HHI index of 1,250.
36
Axis and Hutchison market share were estimated around 5% and 8% in 2012 respectively, which increased to 7% and 12% in 2013.
37
XL lost 3% of its market share in 2012
38
According to the Indonesian Supervising Committe for Business Competition (KPPU), XL-Axis merger and acquisition would not harm the market competition, and will not cause monopolistic industry. KPPU estimates an increase of 200 points in HHI post-merger.
Source: Analyst’s estimates
PT.TELEKOMUNIKASI INDONESIA COMPANY REPORT
PAGE 14/36
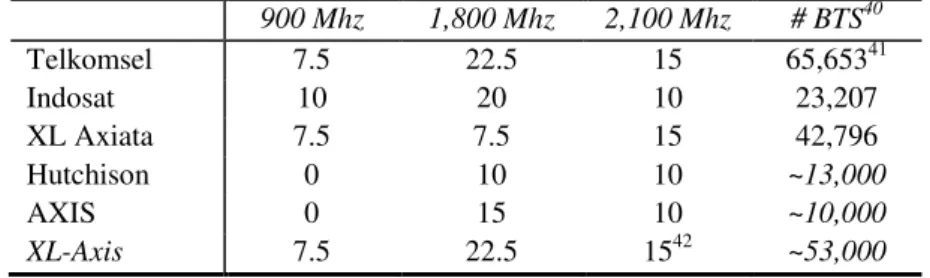
Source: Ministry of Communication and Information Technology, Company reports, Analyst’s estimates
Graph 33 – 2013 Total BTS Comparison
Table 8 – 2013 Spectrum Blocks (MHz) and BTS Comparison Matrix39
900 Mhz 1,800 Mhz 2,100 Mhz # BTS40
Telkomsel 7.5 22.5 15 65,65341
Indosat 10 20 10 23,207
XL Axiata 7.5 7.5 15 42,796
Hutchison 0 10 10 ~13,000
AXIS 0 15 10 ~10,000
XL-Axis 7.5 22.5 1542 ~53,000
In order to understand the implication of those figures presented above, we run some spectrum efficiency calculation that reveals their importance, please consult appendix V. We foresee XL-Axis to become a more formidable player in the future; by retaining Axis’ spectrums and infrastructures, XL would be able to cut its investment budget and save considerable amount in capital expenditure43, and to focus more on rebranding and gaining more market share. Nevertheless, we expect the impact on the industry dynamic and especially on Telkomsel to be more apparent in medium to long term timeframe, considering an integration process44 that XL-Axis has to endure. Furthermore, XL-Axis merger and acquisition will promote industry consolidation as also supported by the regulator who thinks that the cellular market is currently too crowded45. Should the consolidation happen in the future, Telkomsel would most likely be forced out of consolidation to avoid high market concentration46. We expect Telkomsel’s market share to eventually shrink to 40% over the long run.
Best case Scenario
–
market share remains intact
Notwithstanding the aforementioned concern, we see a likely scenario that Telkomsel would be able to maintain its market share through aggressive customer
39
Telkomsel and XL acquired additional 5 MHz in 2,100 MHz band in February 2013. See appendix V for the 2,100 MHz Band Plan by the Ministry of Communication and Information Technology.
40
Base tranceiver station (BTS) is a telecommunication equipment that transmits and receives radio telephony signals to and from other user equipment devices, such as mobile phone.
41Currently Telkomsel has the most BTS employed and spread throughout the country and claims to cover more than 97% of
the population. In 2013, it has added 11,356 new BTS of which 71% are 3G BTS. We estimate the BTS deployed by Telkomsel in 2018 will consist of more than 75% 3G/4G BTS, as the company intends to stop deploying 2G-BTS in near future.
42XL-Axis is obliged to return 10 MHz spectrum blocks in 2,100 MHz
. 43
Looking at our spectrum efficiency calculation, XL-Axis would have enough capacity to accommodate its potentially
growing subscribers’ base without incurring any significant investment for additional BTS and/or spectrum in near future.
44
Integration process would involve network integration, business process re-engineering, streamlining distribution networks, redefining cost-structures, rebranding, etc.
45According to the regulator, it will be hard to obtain additional spectrum in the future without consolidation as spectrum is a
scarce national resource. It is expected that Indonesian telecommunication sector will face spectrum crunch in the next 2-3 years where there are insufficient bandwidth to accommodate excessively growing data demand.
46
Regulator uses HHI index-where level of concentration is divided into 4 spectrum; spectrum 1 is associated with HHI Index that ranges from 0-1800 (low concentration), spectrum 2 with HHI Index ranges from 1801-3000 (moderate concentration); spectrum 3 with HHI Index ranges from 3001-4000 (high concentration); spectrum 4 with HHI Index above 4000 (monoplistic industry tendency)- to assess any potential merger and acquisition. We expect that Telkomsel will not be granted any acquisition proposal as it will cause high industry concentration (referring to HHI Index that might jump to above 4000 level).
PT.TELEKOMUNIKASI INDONESIA COMPANY REPORT
PAGE 15/36
Graph 34 –2013 Subscribers’ base Evolution
Graph 35 – 9M 2013 YoY Revenues Comparison
loyalty program and by continuously maintaining its superior network quality and expanding its coverage as seen in the last 3 years. Telkomsel has the capacity to do so given its strongest operating cash flow resulted from its largest scale business and superior operating efficiency; moreover, it also has the strongest financial position among the three, as summarized in the following table;
Table 9 – 2012 Operational and Financial Highlight Comparison
Telkomsel Indosat XL
Revenues 54,531 22,419 20,970
EBITDA Margin 57% 47% 46%
Operating Cash Flow 25,573 6,989 8,985
OCF/Sales 47% 31% 43%
Interest coverage 11.7 1.54 5.6
Total Debt/EBITDA 0.16 2.23 1.4
Secondly, Indosat recent network roll-out issue has resulted in incremental
subscribers’ base of both Telkomsel and XL, and their respective cellular revenues (refer to graph 34 and 35). Indosat weakest financial position would also limit its ability to engage in decent network upgrade that leads to continuing poor network quality, falling operating revenues, worsening operating cash flow and thus limiting investments and having tenacious network issues47. This on-going concern over Indosat would give Telkomsel opportunity to maintain, if not enlarge its subscribers’ base.
Lastly, Telkomsel’s solid network existence and strong brand awareness outside Java may persist and its market share would likely remain intact48.
Following table summarizes our Indonesian cellular subscribers’ growth and Telkomsel market share forecast;
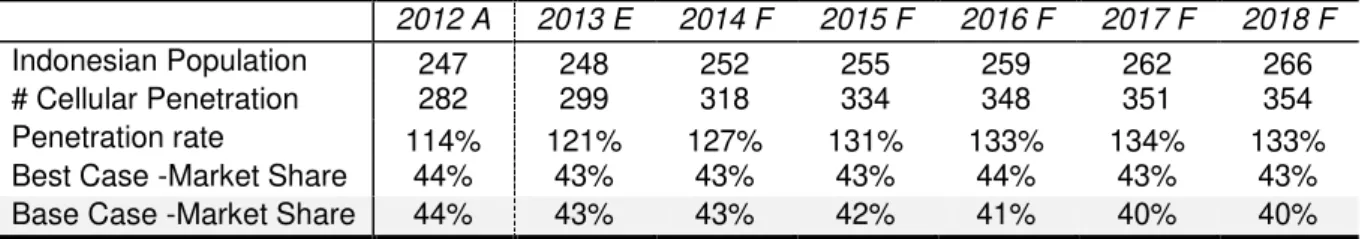
Table 10 – Indonesian Cellular Subscribers and Telkomsel Market Share Forecast
2012 A 2013 E 2014 F 2015 F 2016 F 2017 F 2018 F
Indonesian Population 247 248 252 255 259 262 266
# Cellular Penetration 282 299 318 334 348 351 354
Penetration rate 114% 121% 127% 131% 133% 134% 133%
Best Case -Market Share 44% 43% 43% 43% 44% 43% 43%
Base Case -Market Share 44% 43% 43% 42% 41% 40% 40%
47
Indosat has netted -1.8 trillion IDR lost in 9M-2013 caused by slumping revenues, higher financial cost and excessive forex lost. This worsening condition would limit its ability to recover its network issue.
48 Although Telkom was required to share its network infrastructure by the regulator (under network sharing regulation
introduced in 2008), we are convinced that smaller operators are rather lacking of scale than lacking of access to infrastructure. The fact that they already have access to third party infrastructure provider (with similar capacity with Telkom’s tower subsidiary), we foresee insignificant changes in the industry dynamic for the upcoming terms.
Units: millions users | Source: World Bank, Analyst’s estimates
Units: billion IDR (unless stated) | Source: Company Reports, Analyst’s
Estimates
Source: Company reports
PT.TELEKOMUNIKASI INDONESIA COMPANY REPORT
PAGE 16/36
Graph 36 – Telkomsel MoU/user/month
Source: Company reports, Analyst’s
estimates | Units: minutes/user
Graph 38 – Telkomsel Historical Trend of SMS per Users (LHS) and RPS (RHS)
Source: Company reports, Analyst’s
estimates | Units: IDR/minute
Units (voice revenues): billion IDR | Source: Analyst’s estimates
Voice Usage and Tariff
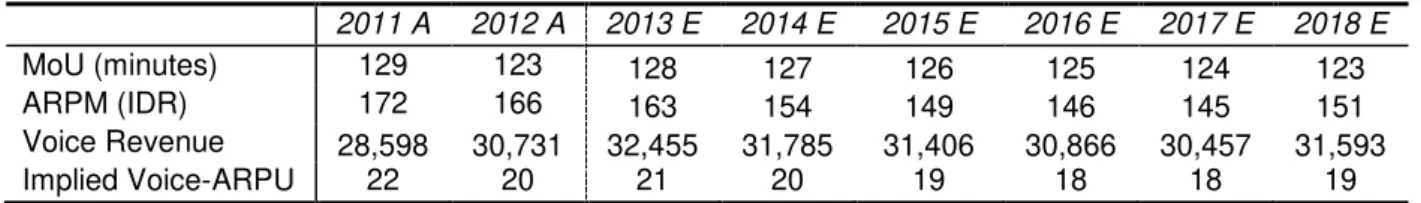
We see voice to data substitution effect has started accumulating through voice over internet protocol (VoIP) applications like Skype, Google Talk, FaceTime, Viber, etc. Minutes of usage (MoU) per user has been declining, whilst operators has been inducing usage through promotions (free calls, for instance) that subsequently, has put pressure on the average revenue per minute (ARPM). Given the fact that smartphone penetration in Indonesia is still relatively low, yet showing significant growth potential49, voice to data substitution effect would only be amplified in near future (refer to Mobile Broadband section for greater detail about m-broadband). The fact that Telkomsel’s has consistently charged higher price per minute (as seen in graph 37) whilst being able to preserve its market share is evidence of economies of scale it has created through its superior network quality that has persisted over the previous years. Moving forward, we expect Telkomsel’s unit price to be maintained above market price, yet we believe that price compression is unavoidable and the ARPM will continue declining due to excessive promotions resulted from fierce competition. As for the longer run (perpetuity); considering that the industry consolidation were to happen, market would reach competitive equilibrium eventually; as such unit price would stop being penalized, and start rising with inflation. Below is our forecast summary;
Table 11 – MoU/User/Month and ARPM Forecast
2011 A 2012 A 2013 E 2014 E 2015 E 2016 E 2017 E 2018 E
MoU (minutes) 129 123 128 127 126 125 124 123
ARPM (IDR) 172 166 163 154 149 146 145 151
Voice Revenue 28,598 30,731 32,455 31,785 31,406 30,866 30,457 31,593
Implied Voice-ARPU 22 20 21 20 19 18 18 19
SMS
We expect that SMS per user will also resume its down trend following increased popularity of on-line messaging through Blackberry messenger (BBM), WhatsApp, Facebook messenger, Lines, etc. Nevertheless, we see that the substitution effect had peaked in 2010; where average SMS/user stumbled from 285 in 2008 to 177 in 2010 and has been rather slowly decreasing (see graph 38); we forecast SMS volume to continue declining yet to a lesser degree.
In what regards revenue/SMS (RPS), we see a similar pattern that happened in 2009 being held currently; RPS seems to be resilient not to drop further below 50 IDR mark as the operators must cover for the SMS interconnect expense about 35
49Smartphone penetration in Indonesia has doubled from 12% in March 2012 to 24% in March 2013, source: Emarketer,
retrieve (December 2013) from:http://www.emarketer.com/Article/Smartphone-Penetration-Doubles-Indonesia/1010102
Units: # SMSs and IDR/SMS (RPS) | Source: Company reports
PT.TELEKOMUNIKASI INDONESIA COMPANY REPORT
PAGE 17/36
Graph 39 – Mobile Broadband Subscribers (LHS) and Total Data Traffic production (RHS)
Units: billion IDR (revenues) | Source: Company Reports, Analyst’s Estimates
Graph 40 – 2012 Broadband Penetration by Age Group
Source: Telkom Presentation 2011
IDR. This in fact implies 30% net-interconnect margin for SMS, which is expected to be the minimum margin. However, we anticipate the pricing compression resulted from lower demand were to persist for the foreseeable future. We assume that Telkomsel would maintain RPS at a similar rate as competitors.
Table 12 - SMS Production and Revenues Forecast
2011 A 2012 A 2013 E 2014 F 2015 F 2016 F 2017 F 2018 F
SMS/user (#) 174 168 163 159 156 153 152 152
RPS50 (IDR) 58 50 51 51 51 52 52 53
Competitors’
RPS (average)
51 - - - -
SMS Revenue 13,093 12,631 12,921 13,202 13,370 13,348 13,354 13,557
Mobile broadband
“Flash” –
the future growth engine
Over the past 5 years, we have seen enormous growth of data usage; as seen in graph 39, Telkomsel’s mobile broadband subscribers’ base has increased massively from 1.8 million in 2009 to 22.7 million in 2013, whilst data traffic production increased immensely from 12 petabyte51 (PB) to 96 PB.
In order to forecast revenues contribution from mobile-broadband properly, we break-down the key drivers as follow;
Young Population and Growing Urbanization
First and foremost, Indonesian young population would provide an economic advantage for the telecommunication carriers as they are more technology savvy, social and connected; which also becomes even more relevant as we see broadband penetration in Indonesia, unlike global broadband penetration, is skewed heavily towards age group of 14-34 years old, see graph 40.
Table 13 - Portion of Indonesian Population by Age Group
2015 F 2025 F 2035 F
Age 0-13 26% 24% 22%
Age 14-24 17% 17% 16%
Age 25-34 17% 17% 17%
Age 35-44 15% 16% 16%
Age 45-54 12% 14% 16%
Age 55+ 13% 19% 26%
Furthermore, urban population has been increasing and its respective poverty headcount has been consistently decreasing since 2006. Though we could not quantify urban population by age group due to lack of data, we assume that growing urbanization in general will promote higher penetration of advance
50
Note that revenue per sms (RPS) is associated with total SMS productions thus including free SMSs
51
1 Petabyte = 1,000,000,000 MB
Units: million users and Petabyte (Data traffic) | Source: Company reports
PT.TELEKOMUNIKASI INDONESIA COMPANY REPORT
PAGE 18/36
Graph 43 – 2012 Facebook users globally (excluding USA)
Graph 44 – 2013 Global Twitter Users (% of Total, excluding USA)
Units: million users |Source: Facebook Annual Report 2012
Source: PeerReach statistics, October 2013
Graph 42 – Urban Population (% of Total)
Graph 46 – Global Mobile Data Traffic Monthly Forecast
Graph 45 – Monthly Data Traffic Production by Region
Graph 47 – Global Mobile Data Traffic by Device Type
telecommunication gadget, such as smart-phones and tablets, which in turn will drive data traffic higher. Altogether, those indicators aforementioned above will provide a solid platform for robust growth in the mobile-broadband sector.
Smartphone + Social Media = the Next Big Thing
It is undeniable that a changing lifestyle within Indonesian society promotes higher usage of smartphone and other large screen devices, such as iPad, Android Tablet, etc. Indonesians are more modernized and seek more sophisticated way to communicate through on-line messaging platform, on-line news portal, on-line social media and video streaming platforms, etc. This argument is supported by the large number of Facebook and Twitter (the most recognized social media platforms globally) users in Indonesia, which is currently the fourth and the third largest market for Facebook and Twitter respectively. Furthermore, smartphone users grew substantially from 11 million in 2011 to 42 million in 2013, which also explains huge jump in data-traffic between the years (refer back to graph 39). Nowadays, smartphone can leverage and deliver those aforementioned needs in a more sophisticated fashion. This is why they are the key value driver to mobile carrier operators of which will surely benefit from this fast growing advance technology gadget. As shown in graph 47 reported by Cisco, data traffic produced by smartphone users has grown substantially and surpassed data traffic produced by notebooks in 2013, whereas graph 45 and 56 shows that Asia Pacific (will) have a high share of the total mobile traffic.
Graph 41 – Poverty Headcount Ratio at Urban Poverty line (% of urban population)
Source: World Bank Source: World Bank
Units: Petabyte | Source: Cisco Visual Networking Index 2013
Units: Terabytes | Source: Cisco Visual Networking Index 2013
PT.TELEKOMUNIKASI INDONESIA COMPANY REPORT
PAGE 19/36
Graph 48 – Connection Speed Threshold
Units: Kbps | Source: Ericsson Mobility Report, November 2013
Graph 51 – 2013 Price/MB, Average Download Speed, and Average Capacity (Advertised) Comparison
750 8,366 1,000
7,200 1,000 7,200 1,000
7,200 750 6,104 1500 154 500
MB
Graph 49 – 2013 Global Smartphone Penetration
Source: Nielsen report, September 2013
Graph 50 – %population has broadband connection
Source: ITU
Graph 48 describes the minimum speed of internet connection required to utilize the respective usages. As of today, mobile cellular broadband has the capacity to accommodate those needs effortlessly with an average connection speed that is faster than 1,000 Kbps. The fact that nowadays, Indonesian can go online by spending as low as 15,000 IDR (less than
2 US$) (which was a decrease from 50,000 IDR (4 US$) 2 years ago52), would only boost mobile broadband penetration higher. Moreover, smartphone penetration rate in Indonesia is still comparatively low, signalling tremendous growth that is yet to be seen.
Flash Market Share, Unit Price and Data Volume
Forecast
Following 9M-2013 results released, Telkomsel Flash has approximately 55% of mobile broadband market share, which is a decline from 74% in 2011. For the last two years competition in mobile broadband has been fiercer than ever, and has led to enormous data pricing compression. Nowadays a single operator provides more than 3 different packages with diverse choices in capacity and speed. Several smaller operator charges much lower tariff which compete purely on value-destroying pricing strategy. Graph 51 summarizes mobile broadband price, speed and capacity comparison between operators;
Telkomsel biggest threat now comes from XL-Axis considering its stronger infrastructures (more BTS-wider coverage) and larger capacity (larger spectrum bandwidth), and its low-cost strategy. As such, we foresee Flash subscribers’ base to deteriorate further to 40% in the long run and in the perpetuity (or at similar level of its cell-phones market share).
52
Average tariff for a mobile broadband prepaid starter pack in Indonesia as of December 2013. Source: Company websites
5,400
Units: IDR/MB | Source: Company reports, Company websites, Analyst’s estimates
Mbps
PT.TELEKOMUNIKASI INDONESIA COMPANY REPORT
PAGE 20/36
Graph 52 – Substantial Data-Pricing Compression (cost/MB) started in 2012
Source: Company reports, Analysts’ estimates |
Units: IDR/MB
Units: million users | Source: Emarketer, Company reports, Analyst’s Estimates
Units: (revenues) billion IDR | Source: Company reports, Analyst’s Estimates
Graph 53 – Monthly Data Traffic per User Forecast
Source: Ericsson Mobility Report, November 2013
Table 14 - Broadband Subscribers' Base and Flash Market Share Forecast
2011 A 2012 A 2013 E 2014 F 2015 F 2016 F 2017 F 2018 F
Indonesian M-Broadband users53 12 26 42 61 75 90 104 114
Penetration rate (% population) 5% 11% 17% 24% 29% 35% 40% 43%
Flash and Blackberry subsccribers 9 17 23 32 37 41 45 45
Market Share 74% 64% 55% 52% 49% 46% 43% 40%
Furthermore, we expect data pricing compression to continue in the future; Telkomsel current price per megabyte (MB) is currently at premium 103 IDR54, whilst the market average is just 6455 IDR. We forecast Telkomsel price to be driven by the market price in the future, especially by XL-Axis, considering business scale they just created.
We foresee data usage (traffic) will increase substantially in the future with enhanced network capacity, namely 4G-LTE technology56. Nevertheless, we forecast Indonesia’s data traffic production to be less than the Ericsson’s projection since the implementation of the LTE network in Indonesia is quite lagging compared to the global average5758.
Table 15 - Mobile Broadband Revenue Forecast
2012 A 2013 E 2014 F 2015 F 2016 F 2017 F 2018 F CAGR
Data/user/month (MB) 258 353 472 619 779 961 1,160 27%
Cost/MB (IDR) 121 109 92 81 72 67 62 -11%
Broadband Revenue 6,273 10,442 16,501 22,168 27,992 34,592 38,879 30%
Implied ARPU (000 IDR) 31 38 43 50 56 65 72 14%
53We expect Indonesian broadband users to grow substantially at CAGR 26% for the next 4 years (using indication from
Ericsson for Asia Pacific mobile broadband sector and Emarketer), and 10% over the longer run. Our estimation infers that penetration rate will be close to 100% in approximately 10 years-time. We assume that multiple subscriptions per user will be more apparent in mobile broadband sector as people generally own tablet and smartphone at the same time (as they provide rather different features). Considering that technology in general always grows swiftly and exponentially, our implicit timeframe should be then reasonable.
54 Global average is at 0.50-1.00 US$ cent (60-120 IDR). Source: international operators websites, analyst’s research
estimates.
55
Please note that this is the offered price on competitors websites, therefore we might overestimate (underestimate) the true price charged per MB due to less (more) actual usage. As for Telkomsel, Indosat and XL we used the actual revenue per MB derived from total data revenues divided by total data traffic production.
56Last October 2013, Telkomsel conducted 4G-LTE network trial, of which the actual (not advertised) 4G internet connection
speed reaches approximately 15 Mbps or about 7-8 times faster than average normal 3G connections.
57
South Korea was the first to commercially deploy 4G technology in 2006, followed by Northern European countries in 2009, and rest of the world (developed countries) in 2010-2011.
58
There are two important factors in estimating data traffic production per user; first is the device being used, 4G enabled and 3G enabled devices apparently have different output. We assume that Indonesians, being less wealthy on average than its international peers, would prefer cheaper product (Indonesia has been flooded by smartphone shipped from China targeting lower-end users) that obviously has technical limitation (most of them are still 2G-3G only devices) when compared with higher end products such as iPhone or Samsung Galaxy (of which are made ready for 4G network), thus limiting their broadband usage. Second is the 4G-LTE network availability; as aforementioned, Indonesian cellular operators have not yet conducted 4G-LTE network roll-out, indication is that they might start as soon as next year. Regulator (BRTI) is still arranging and assessing 4G LTE frequency band. As frequency band is limited, there is speculation that 4G will be operated in 1,800 MHz band, which is currently being used for 2G network, and reaffirming network might take some time, if not years.
PT.TELEKOMUNIKASI INDONESIA COMPANY REPORT
PAGE 21/36
Graph 54 – Net-interconnect Margin Comparison
Graph 55 – On-Net vs. Off-Net Tariff per second
Source: Company reports, Analysts’
estimates
Source: Company reports, Analysts’
estimates | Units: IDR/second Graph 56 – Net Interconnect Margin Forecast
Source: Company reports, Analysts’ estimates
Interconnection
Economies of scale are more apparent in what regards net-interconnect margin59. Given its largest market share, Telkomsel has been able to yield significantly higher
net-interconnect margin, as seen in graph 54.
In 2006, the Ministry of Communication and Informatics Republic Indonesia (KOMINFO) mandated a cost-based interconnection tariff scheme60; where the interconnection charges are determined by the network operator on which a call terminates based on a long-run incremental cost formula. As of today, all network operators charge similar on/off net tariff as presented in graph 55. Regulator has altered the tariff in 2008 that reduced off-net charged per minute by 10% to approximately 30 IDR, which implies termination rate of 5 IDR per second that is equivalent to approximately 0.025 USD/minute. At this rate, interconnection tariff in Indonesia is in fact relatively low compared to its International peers61. We could then argue that cellular market in Indonesia should not be heavily affected by the network effect62; nevertheless, market share would still be the important factor in gaining net-interconnect margin; as larger market share implies higher net-interconnection revenues and lower interconnection expenses. As we expect Telkomsel’s market share to eventually contracting in the future, we suppose the respective net-interconnect margin to shrink too. Graph 56 recaps our interconnection expense and revenue per minutes relative to ARPM forecast.
59 Net-interconnect margin is calculated by deducting interconnection revenues received from other operators by the
interconnection expenses paid to other operators.
60 KOMINFO issued Regulation No.8/PER/M.KOMINFO/02/2006 on interconection on February 8, 2006. (retrieved from:
Telkom annual report 2012, )
61Average termination rates around the world; Europe (0.07 USD), Africa (0.19 USD), Asia Pacific (0.04 USD), USA (0.16
USD). Source: ITU World Tariff Policies Database 2012
62
PT.TELEKOMUNIKASI INDONESIA COMPANY REPORT
PAGE 22/36
Graph 57 – Fixed-line Business EBITDA Margin Forecast
Source: Company reports, Analysts’ estimates, Bloomberg
Graph 59 – 2012 Revenues per Employee
Source: Analysts’ estimates, Bloomberg | Units: billion IDR
Graph 58 – Fixed Business Operational Expense Contribution by Segments
Source: Company reports, Analysts’ estimates
Operating Cost Margin and Investments
Fixed Business Margin
As discussed previously, broadband tariff in Indonesia is relatively more expensive than its International peers; we believe that the regulator would likely to drive price lower, considering currently low broadband penetration rate could be propelled by a decreasing unit price; consequently lowering Telkom operating margin. Moreover, although regulator has not required Telkom to share its fixed-broadband infrastructure, in the future where demand for fixed-broadband is presumed to be increasingly growing, we foresee threat of new entrants and a likely scenario that Telkom would have to share its infrastructure thus decreasing its competitive advantage. It would be then most reasonable to expect a rather contracting margin in the future. Nevertheless, we are still convinced
that Telkom’s fixed-business margin would be higher than comparables due to following reasons; firstly, Telkom’s operation and maintenance expense contributes by relatively low portion to the overall operating expenses, this means that even if unit price margin were to shrink, it would not affect Telkom’s overall margin greatly. In fact the company was able to reduce costs related to the operation and maintenance in 2012, which shows its superb operational efficiency. Secondly, Telkom’s most expensive bill comes from personnel expense63, which consistently contributes around 50% of
total operating expense, whereas comparables’ average is within 20-30% range; Moreover, Telkom’s workforce efficiency in which reflected by the amount of revenue generated per employee is relatively low, suggesting that the company still has some extra space in the trunk for the workforce efficiency enhancement. Lastly, which we consider as best case scenario; though we could not quantify precisely as for Telkom fibre roll-out case64, according to FTTH Council Europe65, “fiber access networks are lower cost to build than copper and much lower cost to operate”; total operational cost reductions were estimated of around 15%-30%; as such we presume higher margin to be sustained.
As for the worst case scenario (Indonesia economy to erode further, appendix II), it is common that companies including Telkom would not be able to adjust its fixed cost instantly, such as personnel cost, SG&A expense, etc. and therefore sudden
63 Being an SOE, Telkom rather assumes responsibility in creating job field.
64
Telkom did not disclose specifically its investments and operational cost related to FTTH, and revenues gained from the investment.
65Stanislawski, S., & Kauze, J. (2012). Financing Stimulus for FTTH. Retrieved from