Research Articles
Temporal and spatial epidemiology of sleeping sickness and
use of geographical information system (GIS) in Kenya
Jane Jemeli Rutto & Julia Wairimu Karuga
Kenya Agricultural Research Institute-Trypanosomiasis Research Centre (KARI-TRC), Kikuyu, Kenya
Abstract
Background & objectives: In Kenya, sleeping sickness (SS) caused by Trypanosoma brucei rhodesiense is confined to the Nyanza and Western Provinces tsetse belts. Over the last two decades, the disease has exhibited great spatial variability in its spread and distribution. The objectives of the study were to map the spatial and temporal distribution of SS and determine possible risk factors associated with the disease in western Kenya.
Methods: Geographical coordinates of villages were obtained using a Global Positioning System (GPS). SS data were analyzed retrospectively and the mapping of villages was done using MapInfo Software®. Epidemiological data of villages affected by SS were then correlated to human and cattle population.
Results: SS has spread northwards affecting the western parts of Busia, Teso, and of Bungoma districts in the late 1990s. Most of the SS cases were reported between March and June. The mainly affected age groups were from 20 to 49 years. SS was highest in areas with low human population density, ranging from 0–340/km2 and high livestock population, ranging from 5000 to 10,000 cattle.
Interpretation & conclusion: There was a shift of SS occurrence from the old foci into new foci occurring at low transmission levels and causing occasional epidemic outbreaks. The study concludes that seasons influenced disease incidences with higher numbers of SS cases being recorded during the wet seasons. Gender and age determined the disease occurrence with most productive age groups being at higher risk. Areas with high livestock populations had low human population densities and had higher SS cases.
Key words Epidemiology – geo-reference – sleeping sickness – spatial – temporal – tsetse
Introduction
Human African Trypanosomiasis (HAT) or sleeping sickness (SS) continues to be a major cause of mor-bidity in sub-Saharan Africa. It is estimated that 55 million people in 36 countries are at risk of the dis-ease1. Although only 45,000 new cases were reported in 1999, the burden of SS was estimated at 66,000 deaths and two million disability-adjusted life years
Prov-gambiense (Tbg) based on clinical diagnosis but a review of historical medical records in Uganda where the disease is presumed to have originated from, con-firms that the patients were suffering from Tbr and not Tbg. The first confirmed form of Tbr in Kenya was reported in 1942, having spread from south-east Uganda through the Sio River. The spread was attrib-uted to Glossina pallidipes infestation in Samia lo-cation in Busia district.
The two sleeping sickness endemic foci (Nyanza and Western Provinces) in Kenya are separated by a vast terrain where cases of SS were reported in the 1940s and early 1960s although the vectors Glossina fuscipes fuscipes and G. pallidipes are present. Most sleeping sickness cases prior to 1990 were from Lambwe Valley in Nyanza Province. However, from 1990 to 2007, the majority of cases have come from new focus in Teso and Bungoma districts in West-ern Province. Therefore, the objectives of the study were to map the temporal and spatial distribution of SS from 1977–2007 and determine possible risk fac-tors associated with the disease in western Kenya.
Material & Methods
The study was carried out in the humid and sub-hu-mid zones of western Kenya where the foci of SS are confined. Secondary data on SS were reviewed and all the cases computed to obtain the annual cases of SS in Kenya from 1950 to 2007. The villages that had recorded SS through both active or passive surveil-lance systems at Kenya Agricultural Research Insti-tute-Trypanosomiasis Research Centre (KARI-TRC) (formerly KETRI) and National Livestock Research Institute (formerly EATRO) hospitals’ databases from 1977–2007 were identified. A review of SS databases from the hospitals was done to establish the nationality and determine their distributions per dis-trict. Only Kenyan cases were considered. The cases (n = 333) between 1977 and 2007 with adequate de-tails were traced and geo-referenced. Out of 125 vil-lages recorded in the SS database, 117 were
wrong entry of the village name or the patient gave a non-existent village name. Each village was traced to its actual position on the earth’s surface using ei-ther the village name or the patient’s name. Geo-graphical coordinates of the village positions were marked using Global Positioning System (GPS-Garmin 12 x L). The navigation setup was set as de-gree decimal units and WGS 84 as the map datum. The village coordinates were downloaded using Mapsource Program®. MapInfo version 6.0 Software was used to produce the final outputs and thematic maps of the villages. The most important landmarks having the village names such as schools, churches, market centres and dispensaries, which marked the centre of the village(s), were geo-referenced during the exercise. The geo-referenced villages in Western Province, which has been continually active since 1977–2006 were then linked to 1989 human popu-lation4 and 1993 cattle population (KARI-TRC, GIS Database).
Results
The latest active SS focus has been restricted prima-rily to Western Province in Busia and Teso districts with Bungoma district emerging as a new focus in the late 1990s. However, from 2001–07, Busia, Bungoma and Teso districts have reported 18 cases of SS. Within the period (October 2002–05), the Western Province was SS free until January 2006 when one case was reported within Busia town, Busia district.
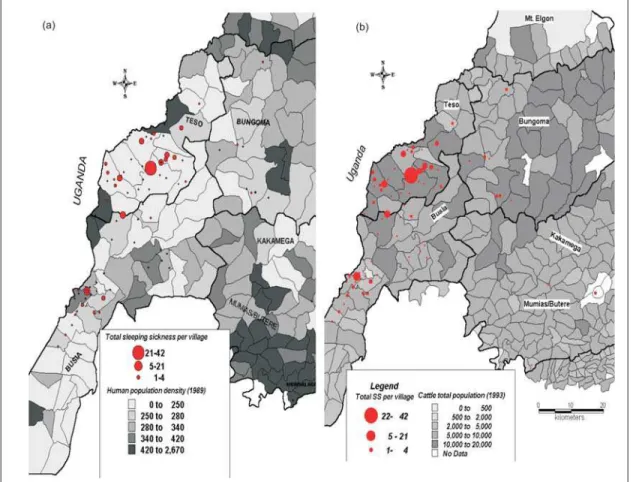
Geographical distribution of sleeping sickness in Kenya: The spatial and temporal distribution of SS was illustrated in Fig. 2. In Nyanza and Western
Prov-Fig. 2: Spatial and temporal distribution of sleeping sickness in Kenya
Fig. 4: Sleeping sickness distribution by age and sex
Fig. 3: Cumulative seasonal transmission of sleeping of sickness
0 10 20 30 40 50 60 70
MONTH(S)
Male Female Total
Jan Feb Mar Apr May Jun Jul Aug Sep Oct Nov Dec
NUMBER
OF
CASES
0 10 20 30 40 50 60 70
0 9– 10–14 15 19─ 20 29─ 30 39─ 40 49─ 50 59─ 60+
AGE (YEARS)
Male Female Total
NUMBER
OF
CASES
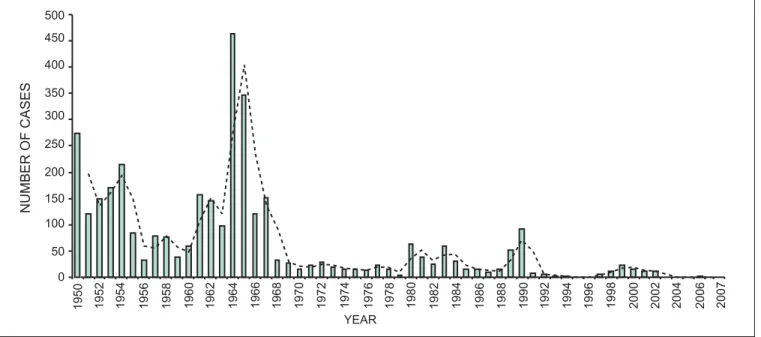
0 50 100 150 200 250 300 350 400 450 500
YEAR
NUMBER
OF
CASES
1950 1952 1954 1956 1958 1960 1962 1964 1966 1968 1970 1972 1974 1976 1978 1980 1982 1984 1986 1988 1990 1992 1994 1996 1998 2000 2002 2004 2006 2007
distribution of SS from 1977–2007 demonstrated changes in the temporal and spatial distribution over time. It is evident from Fig. 2 that the disease has spread northwards affecting the western parts of Busia, Teso, and of Bungoma districts in the late 1990s. In Nyanza Province, the districts initially af-fected by SS have not reported SS cases from 1991– 2007.
The results were further analyzed and correlated with different variables such as age, sex, human and cattle population. The monthly distributions of SS from 1977–2007 are shown in Fig. 3. Most of the SS cases were reported between March and June of each year. The highest numbers of SS occurrence was in March, reporting 65 cases. The lowest occurrence was in February where only 10 cases were recorded. The male gender was the most affected group throughout
The prevalence of SS among the different age groups from 1977–2007 is illustrated in Fig. 4. Male gender also dominated in almost all age categories except 30– 39 years age group. The prevalence of SS increased with age up to the age of 29 years before recording a slight decline. The age categories with high reported cases of SS were 20 to 39 and 50 to 59 years. The least affected age category was the young age group 0–9 years. The results indicate that villages that recorded high SS numbers were Apatit (42), Bukhwamba (14), Obuchun (11), Amaase (10), Katelenyang (9), Kokoki (9). A summary of some affected villages is presented in Table 2. The SS data were further correlated with human density and livestock population. The spatial data showed that SS was highest in areas with low human population density, ranging from 0–340/km2 and high livestock population, ranging from 5000 to 10,000 heads of cattle (Fig. 5).
Discussion
In Kenya, SS was high during the colonial period but the highest peak recorded in 1964 immediately after Kenya attained its independence. The high SS num-bers from 1950s to mid-1960s were attributed to little tsetse work undertaken because of the struggle for independence (Mau Mau Rebellion)5 and change of government from the British colonial rule to the in-dependent Kenyan rule. This trend is not unique to Kenya as Médecins Sans Frontiéres (MSF)6 reported
that after gaining independence most SS endemic countries had inadequate budgets to continue with effective routine control activities and also lacked political goodwill to deal with key public health pri-orities. Moreover, control strategies used during the period included bush clearing, hand catching and insecticide application, mainly concentrated on areas affected by SS, hence, lacked efficacy in large-scale impact on vector.
Over the last two decades, the disease occurrence has been low and sporadic. While tsetse and trypanoso-miasis control activities may have contributed to the observed decline in disease trend other important factors such as anthropogenic activities also played a significant role in reducing tsetse habitats and hence the disease incidence3. Cultivation and settlement for instance in affected SS foci such as Lambwe Valley in Nyanza Province increased from 11% in 1941 to 47% in 1993, while Busia district in western Kenya demonstrated change from 23% in 1967 to 47% in 19973. The most recent data showed that farming activities contribute to 58% of the land cover in Busia district (Rutto, unpublished data). Tsetse and trypa-nosomiasis control in Western and Nyanza Provinces was mainly done using insecticides such as DDT, dieldrin, cypermethrin bush clearing and settlement to control the disease in human and livestock5. The sporadic cases that occurred in districts such as
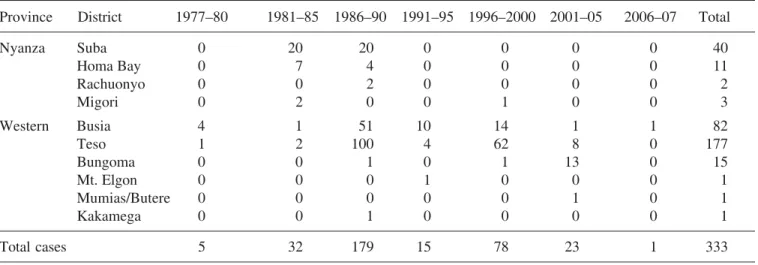
Table 1. Cases of sleeping sickness per province and district in Kenya from 1977 to 2007
Province District 1977–80 1981–85 1986–90 1991–95 1996–2000 2001–05 2006–07 Total
Nyanza Suba 0 20 20 0 0 0 0 40
Homa Bay 0 7 4 0 0 0 0 11
Rachuonyo 0 0 2 0 0 0 0 2
Migori 0 2 0 0 1 0 0 3
Western Busia 4 1 51 10 14 1 1 82
Teso 1 2 100 4 62 8 0 177
Bungoma 0 0 1 0 1 13 0 15
Mt. Elgon 0 0 0 1 0 0 0 1
Mumias/Butere 0 0 0 0 0 1 0 1
Kakamega 0 0 1 0 0 0 0 1
Total cases 5 32 179 15 78 23 1 333
Table 2. Villages in Western Province with high SS cases (1977–2007)
Village No. of cases
Akudiet 8
Amongura 4
Amaase 10
Amoni 4
Amukura 5
Apatit 42
Bukhwamba 14
Ikapolok 5
Katelenyang 9
Kodedema 5
Kokoki 9
Obekai 4
out much impact on the spread of the disease. Such cases may have contracted the disease while visiting SS active foci. Elsewhere, Maudlin7 also attributed the spread of SS in Congo Free State to movement of infected people while another study attributed the disease spread into new foci to livestock restocking8.
The SS wave from 1981–90 period corresponds to the withdrawal of DDT and dieldrin use in ground spray-ing and the epidemics in south-eastern Uganda9. In Kenya, dieldrin was banned after 27 years of use in 19835,10. From 1987–90 cypermethrin application was initiated on trial basis but its efficacy was re-duced by ultra-violet biodegradation before its im-provement to the long-lasting cypermethrin available in the market currently. The cessation of cotton grow-ing due to low world market prices after the introduc-tion of synthetic fabrics perhaps, contributed indirectly to a surge in tsetse and trypanosomiasis prevalence as the insecticides used may have reduced the vectors in the affected regions. Furthermore, the dwindling government and donor funds and introduc-tion of structural adjustment programmes (SAPs) in the 1990s contributed to a decline in tsetse and try-panosomiasis control activities since governments had limited funds for priority issues and also employ-ees undertaking tsetse control activities were reduced through retrenchment, leading to an increase in fly population and consequently the observed SS num-bers. Unfortunately, it is not possible to obtain data on vector population as Angus11 noted that prior to 1990 there were no regular systematic fly-trapping and tsetse control was carried out on an adhoc basis in Kenya.
Most SS cases before 1990 were from Lambwe Val-ley in Nyanza Province while from 1990–2007 these were from Teso and Bungoma districts in Western Province. The absence of SS after 1990 in Nyanza Province could be due to concerted efforts of tsetse and trypanosomiasis control in the late 1980s2,12. In 1988, Kenya Trypanosomiasis Research Institute initiated a tsetse suppression trial in Lambwe Valley
bers3. Recent tsetse survey in Lambwe Valley reported fly per trap per day (FTD) of 0.96% (Mwangangi et al 2007, unpublished report). Con-certed tsetse control activities in Western Province in 1990s reduced tsetse fly FTD from 8 to 1.3 by 199411 which has remained at low levels ranging from 0 to 0.4 FTD. Currently in most areas with the exception of few isolated pockets in northern Busia district, where FTDs of over 200 (currently Teso dis-trict) as reported by Okoth13 and Rutto et al 2008 (unpublished data). The low numbers of tsetse flies experienced during the period and perhaps frequent use of trypanocidal drugs in cattle (to kill pathogenic trypanosomes and non-pathogenic T. brucei human infective species) could have contributed towards absence or reduction of SS in Nyanza and Western Provinces. A vast terrain separates the two SS en-demic areas of Nyanza and Western Provinces and cases were reported in 1940s and early 1960s al-though the vector is still present.
The spread of HAT into new areas (Bungoma and Teso districts) could mean that the clean tsetse flies in the new foci might have been infected with the T. brucei human infective species. Harley14 reported tsetse infestation along Malakisi River which is ad-jacent to Teso district but the flies were not infected with human infective trypanosome species and hence the absence of SS cases reported from the area. Pre-vious reports had also indicated that Busia and Bungoma districts15 had low tsetse fly numbers con-sidered scientifically not capable of transmitting dis-ease16, yet in the area a new SS focus has emerged.
remained constantly high during the wet seasons (1977–2007). Furthermore, during the onset of the wet season, the tsetse fly’s life expectancy is maxi-mal, therefore, the flies survive for long periods, thus, enhancing their capability to transmit disease de-pending on their infection rates. Anthropogenic ac-tivities such as livestock keeping, crop farming and cultural activities increase the human/fly contact. Kokwaro et al19demonstrated that socio-cultural and economic activities undertaken by different gender influenced human-vector interactions. Sociocultural and economic activities are gender designated which accounts for the gender differences in SS incidences.
The studies have shown that livestock could act as reservoirs of the parasite and as host for the tsetse fly11,20,21. Enyaru et al22 found zymodemes from domestic animals such as cows and the pigs as being identical to those in man. The foregoing study sup-ports the current findings that demonstrate a positive correlation of cattle population and SS incidences. The areas with high livestock populations had low human population densities. Low human population could lead to land under-utilization and consequently bush encroachment forming a suitable tsetse habitat.
The study showed a shift of SS occurrence from the classical or traditional foci into new foci occurring at low transmission levels and causing occasional epidemic outbreaks. While current SS incidence in Kenya is low, effective control strategies to control transmission or eliminate the disease are still needed. The study concludes that seasons influenced disease incidences with higher numbers of SS cases being recorded during the wet seasons. Gender and age determined the disease occurrence in the community with most productive age groups being the most af-fected. The study demonstrated a strong correlation between cattle numbers, human population and SS occurrence. The study also demonstrated that the use of GIS in research could assist in mapping disease, prevalence and spread over time and space. There-fore, GIS tool should be refined further to assist in forecasting SS, leading to a better management of the disease in future.
Acknowledgement
The authors would like to thank Dr Grace Murilla (Current Centre Director, KARI-TRC), Dr Joseph Ndungu (former Director KETRI) for facilitation, WHO/TDR, Swiss Tropical Institute (STI), and East-ern Africa Network for Tsetse and Trypanosomiasis (EANETT) for financial support. The authors are grateful to Dr Joseph Sulo and the late Dr Kipkemboi Tengekyon for providing the referral SS data. We are acknowledging Deputy Centre Director KARI-TRC Dr Johnson Ouma and Dr Sospeter Nyamwaro for re-viewing the manuscript. All KARI-TRC staff who participated in this project, especially Mr Michael Musembi are acknowledged for their technical support.
References
1. World Health Report 2000. Health systems improving per-formance. Geneva: World Health Organization 2000. 2. Wellde BT, Waema D, Chumo DA, Reardon JM, Oloo F,
Njogu AR, Opiyo EA, Mugutu S. Review of tsetse con-trol measures taken in Lambwe valley in 1980–84. Ann Trop Med Parasitol 1989; 83(Suppl 1): 119–25.
3. Environmental change and autonomous control of tsetse and trypanosomosis in sub-Saharan Africa: case histo-ries from Ethiopia, Gambia, Kenya, Nigeria and Zimba-bwe. In: Bourn DM, Reid RS, Rogers DJ, Snow WF, Wint GW, editors. Oxford, UK: Environmental Research Group Oxford Limited 2001; ISBN: 1-898028-05-2.
4. Kenya population census of 1989. Government of Kenya, Central Bureau of Statistics, Ministry of Finance and Plan-ning. Population distribution by administrative areas and urban centres. Nairobi: Government Printers 1990; p. 1–242.
5. Davies B. A review of tsetse and trypanosomiasis control in Kenya and effects on land use and the environment. ODA/KETRI Animal Research Project 1992; p. 1–76. 6. Checchi F, Diap G, Karunakara U. Human African
trypa-nosomiasis. Facing the challenges caused by neglect: the need for new treatment and diagnostics. Médecins Sans Frontières Campaign for Access to Essential Medicines. Médecins Sans Frontières 2006.
7. Maudlin I. African trypanosomiasis. Central review. Ann Trop Med Parasitol 2006; 8: 679–701.
9. Fèvre EM, Coleman PG, Welburn SC, Maudlin I. Re-analyzing the 1900–1920 sleeping sickness epidemic in Uganda. Emerg Infect Dis 2004;10(4): 567–73. 10. Rutto JJ. Strategic environmental assessment (SEA) of
tsetse and trypanosomiasis control programmes sustainability in Busia district, Kenya. M.Sc. Thesis. De-partment of Environment Studies. University of East Anglia 1999; p. 1–144
11. Angus DS. The epidemiology of trypanosomiasis in vil-lage livestock in an endemic sleeping sickness area of western Kenya. Ph.D. Thesis. Department of Veterinary Physiology, University of Glasgow 1996; p. 1–408. 12. Opiyo EA, Njogu AR, Omuse JK. Use of impregnated
targets for tsetse control of Glossina pallidipes in Kenya.
Insect Sci Appl 1990; 11(3): 417–25.
13. Okoth SO. Transmission dynamics and epidemiology of Rhodesian sleeping sickness in allopatric populations of
Glossina pallidipes of Kenya. Ph.D. Thesis. Kenyatta Uni-versity 2008.
14. Harley JM. Population of G. fuscipes without trypano-some infections. EATRO Annual Report1966; p. 1–52. 15. Wamwiri F, Rutto J. Report on tsetse survey of FITCA project districts carried out by KETRI. Tech Rep 2000: p. 1–20.
16. Rogers DJ. The dynamics of vector transmitted diseases
17. South Nyanza District Development Plan 1989–1993. Min-istry of Planning and National Development, Kenya. Nairobi: Government Printers 1989; p. 1–326.
18. Busia District Development Plan 1989–1993. Ministry of Planning and National Development, Kenya. Nairobi: Government Printers 1989; p. 1–320.
19. Kokwaro ED, Okoth SO, Kiragu JM, Murilla GA. Influ-ence of socio-economic and cultural activities of vector-host interaction and risk of Rhodesian sleeping sickness at Busia and Nguruman areas of Kenya. Trends Appl Sci Res
2007; 2(1): 28–38.
20. Onyango RJ, Van Hoeve K, De Raadt P. The epidemiol-ogy of Trypanosoma rhodesiense sleeping sickness in Alego, central Nyanza, Kenya. I: evidence that cattle may act as reservoir hosts of trypanosomes infective to man.
Tran R Soc Trop Med Hyg 1966; 60:175–82.
21. Willett KC. Some observations on recent epidemiology of sleeping sickness in Nyanza region, Kenya and its relation to the general epidemiology of the Gambian and Rhode-sian sleeping sickness in Africa. Tran R Soc Trop Med Hyg 1965; 59: 374–86.
22. Enyaru JCK, Stevens JR, Odiit M, Okuna NM, Carasco JF. Isoenzyme comparison of Trypanozoon isolates from two sleeping sickness areas of south-eastern Uganda. Acta Trop 1993; 55: 97–115.
Corresponding author: Jane Jemeli Rutto, Kenya Agricultural Research Institute-Trypanosomiasis Research Centre (KARI-TRC), P.O. Box 362, Kikuyu, Kenya.
E-mail: [email protected]