Carlos Farinha Rodrigues & Isabel Andrade
THE AGE-OLD PROBLEM OF OLD AGE POVERTY
IN PORTUGAL, 2006 – 14
WP242016/DE/CEMAPRE
_________________________________________________________
De pa rtme nt o f Ec o no mic sWORKING PAPERS
1
THE
AGE-OLD
PROBLEM
OF
OLD
AGE
POVERTY
IN
PORTUGAL,
2006
–
14
Carlos Farinha Rodrigues
*Isabel Andrade
October 2016
*
ISEG (School of Economics and Management) / Universidade de Lisboa
and CEMAPRE (the Centre for Applied Mathematics and Economics)
Rua Miguel Lupi 20 1249-078 Lisbon, Portugal
2
THE
AGE-OLD
PROBLEM
OF
OLD
AGE
POVERTY
IN
PORTUGAL,
2006
–
14
Carlos Farinha Rodrigues
Isabel Andrade
Abstract
The elderly poverty rate has decreased significantly in Portugal in recent years with rising elderly incomes and inequality and material deprivation levels converging to national levels. There is also growing evidence of heterogeneity amongst the elderly poor, with marked differences between the higher average incomes of the younger elderly generations versus the older ones. For example, the poverty rate of the elderly aged 75+ and living alone was equal to 27% in 2014, identifying this group as one of great economic and social vulnerability. These results are even more significant when the ageing of the population is taken into account: the ageing index rose from 45% in 1980 to over 90% in late 1990s and 141.3% in 2014, implying that the decreasing elderly poverty has an increasing effect on the national poverty levels. The aim of this paper in to investigate whether the austerity policies implemented in the post-2010 period had a strong impact on the monetary resources and what was their effect on the elderly using the most recent available EU-SILC data. It concludes that
the decrease in the ‘official’ elderly poverty indicators in 2009-14 is connected with the drop in the
poverty threshold caused by the decrease in the average median income of the whole population, and that if its effect is removed from the analysis through the usage of the anchored poverty line, the elderly poverty indicators actually increased, rather than decreased, during the economic crisis.
Keywords: Social Policy, Income Distribution, Inequality, Poverty Alleviation, Demographic Economics, Portugal
JEL Classification: D63, I32, I38, J1
3
THE
AGE-OLD
PROBLEM
OF
OLD
AGE
POVERTY
IN
PORTUGAL,
2006
–
14
11. Introduction
High rates of old age poverty existed in Portugal in the mid-1990s, when more than 35% of those
aged 65 or over were poor compared to about 21% of the total population. Recently, however, the
old-age poverty rate has declined significantly to 25.5% in 2006 and 17.0% in 2014. This remarkable
reduction has been quicker and has achieved lower values than the national poverty rate (18.1% and
19.5% in 2006 and 2014, respectively).
The aim of this paper is to study in detail the age-old problem of old age poverty in Portugal in
2006-14, including the relationship between poverty, inequality and material deprivation. Full attention is
given to the effects of social policies and transfers targeting the elderly specifically, particularly
during the adjustment period, but also their age, gender and household characteristics. It shows that
although the austerity policies affected deeply the elderly income, their effects were less severe
than over the whole population. Furthermore, the progressive character of some policies actually
contributed to the decrease in asymmetries in the distribution of the elderly equivalised income. It
also reveals that the reduction in the poverty indicators reported in official statistics is mainly caused
by the drop in the poverty line itself, rather than a significant improvement in the living standards of
the poor elderly population. Once this effect is ‘neutralised’, the poverty rate of almost all elderly
groups actually increases. Moreover, the elderly are a heterogeneous group with important clusters
of deep poverty remaining.
The specific study of old age poverty and deprivation has been gaining importance with the
significant ageing of the population in most OECD countries at a time of economic crisis and growing
pressure on resources. Some studies concentrate in country specifics like, for example, Albuquerque
et al. (2010) and Rodrigues and Andrade (2014) in Portugal, Prunty (2007) in Ireland, Lindquist and
Wadensjo (2012) in Sweden, Aziz et al. (2013) in New Zealand, and Bosworth et al. (2016) in the US;
others compare elderly poverty across countries, as Brown and Prus (2006) and Zaidi (2009) in OECD
countries, and Ahonen and Bach-Othman (2010), Goudswaard et al. (2012), and Zaidi (2010) in EU
countries. Callan et al. (2011) simulate the effects of the austerity policies in the EU and find their
effects on the elderly to be distinct from the whole population, a result also found by Bosworth et al.
(2016) in the US, where elderly incomes were also less affected by the financial crisis and suffer from
less severe inequality than other age groups.
1
4 The main data source used in this paper is the micro-data database of the European Union Statistics
on Income and Living Conditions (EU-SILC) made available by INE-Statistics Portugal. The EU
methodology for measuring and evaluating poverty and material deprivation is broadly followed in
this paper: the key variable in the analysis of the living conditions of the elderly is the equivalised
income obtained by correcting the household disposable income using the modified OECD scale. The
poverty line is defined as 60% of the median adult equivalent income.
This paper is organised as follows: section 2 describes the Portuguese ageing population; section 3
studies elderly poverty during the 2006-14 period and section 4 the evolution of their equivalised
income and its distribution; section 5 analyses the sensitivity of the elderly poverty to the median
income trap; the other poverty dimension, material deprivation, is discussed in section 6 which then
summarises both dimensions in the study of the elderly consistent poverty; section 7 discusses the
heterogeneity of elderly poverty and income by age group, gender and household type; finally
section 8 concludes the paper and summarises its main conclusions.
.2. Portugal: a country with an ageing population
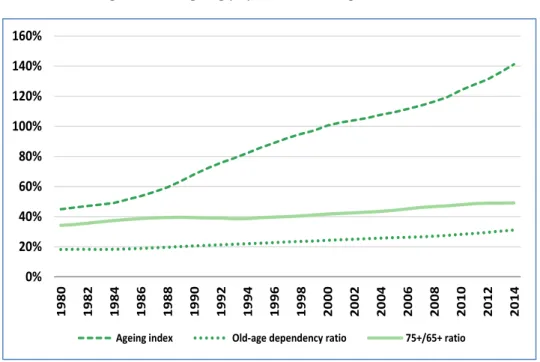
Figures 1 and 2 below show the Portuguese population getting older faster than ever before2. From
around 45% at the start of the eighties, the ageing index exceeded 80% in the mid-nineties, and
crossed the 100% barrier in 2000, then reaching 141.3% in 2014. Simultaneously, the old-age
dependency ratio rose from about 18% in the eighties to about 25% in the early noughties, and
31.1% in 2014. Finally, in 2014, almost half (49.1%) of the elderly were aged 75+, the ‘older old’, up
from 34.2% in 1980. Life expectancy (at birth) has thus risen from 71.1 years in 1980 (men: 67.8
years, women: 74.8) to 80.4 in 2013-15 (77.4 and 83.2, respectively). An important factor in these
results is the substantial drop in fertility with the birth rate falling from 16.2‰ in 1980 to 7.9‰ in
2014, together with an almost unchanged mortality rate (of around 10‰).
2
5 Figure 1: An ageing population, Portugal 1980-2014
Source: INE-Statistics Portugal.
Notes: Ageing index: (population aged 65+/population aged <15)*100; Old-age dependency ratio: (population aged 65+/population aged 15-64)*100; 75+/65+ ratio: (population aged 75+/population aged 65+)*100.
Figure 2 compares the constrictive population pyramids of 1984 and 2014. The decline in fertility is
already visible in 1984, with a clearly narrower 0-4 age group than those above, and is still there 30
years later in the 30-34 age group. However, this group is now followed underneath by successively
narrower younger age groups, a consequence of the falling birth rates. Conversely, the elderly age
groups widened noticeably, particularly the elderly women: 22.7% of the Portuguese women were
aged 65+ in 2014, compared to 17.7% of the men, and much higher than the respective proportions
of 12.6% and 9.8% 30 years before. The gender gap is also widening in the ‘older old’ age groups: in
2014, the proportion of women aged 75+ is 11.8% and those aged 85+ 3.3%, higher than the 8.0%
and 1.7% of men, respectively.
0% 20% 40% 60% 80% 100% 120% 140% 160% 19 80 19 82 19 84 19 86 19 88 19 90 19 92 19 94 19 96 19 98 20 00 20 02 20 04 20 06 20 08 20 10 20 12 20 14
6 Figure 2: Population pyramids, Portugal 1984 and 2014
(in % of total population)
Source: INE-Statistics Portugal.
Another measure of the ageing of the Portuguese population and households can be obtained from
the EU-SILC data in Table 1. In 2014, 20.3% of the Portuguese are aged 65+ and, perhaps more
significantly, 23.7% of the households have elderly members only, well above their 2006 proportions
of 17.3% and 20.3%, respectively.
Table 1: Elderly individuals and households in percentage of total population, 2006-14 2006 2007 2008 2009 2010 2011 2012 2013 2014
65 years or over 17.3 17.4 17.6 17.9 18.2 19.4 19.4 19.9 20.3
Elderly households 20.3 21.0 21.0 21.1 21.6 22.6 22.5 23.4 23.7
Source: INE-Statistics Portugal, EU-SILC 2007-2015. Authors’ calculations.
N.B.: Elderly households are defined as those solely composed of individuals aged 65+.
The next section investigates the poverty status of this ageing population.
10 5 0 5 10
0 - 4 y 5 - 9 y 10 - 14 y 15 - 19 y 20 - 24 y 25 - 29 y 30 - 34 y 35 - 39 y 40 - 44 y 45 - 49 y 50 - 54 y 55 - 59 y 60 - 64 y 65 - 69 y 70 - 74 y 75 - 79 y 80 - 84 y 85+ y
7
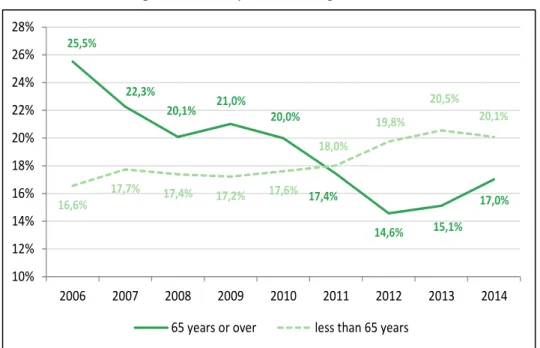
3. An ageing and less poor population: elderly poverty between 2006 and 2014
The evolution of the elderly poverty rate over the 2006-14 period is considerably different from that
of the national rate, as indicated in Figure 3. During the pre-crisis period of 2006-09, the elderly rate
fell from 25.5% to 21.0% (-4.5 percentage points, here-after pp), thus bringing it closer to the
national rate of 17.2% in 2009. During the first years of the economic crisis (2010-12), the elderly
poverty rate moved in the opposite direction of the national rate, and the percentage of elderly poor
decreased from 20.0% to 14.6%, or 5.4 pp. In 2011, the elderly poverty rate actually dropped below
the national rate, a first since the INE started publishing poverty statistics. Finally, in 2013-14, the
crisis and austerity policies started to affect the elderly, reversing the previous gains and raising the
elderly poverty rate from 14.6% to 17.0%, but still below the national rate.
Figure 3: Poverty rates, Portugal 2006-14
Source: INE-Statistics Portugal, EU-SILC 2007-2015. Authors’ calculations.
Figure 4 reveals that there were 466.6 thousand elderly Portuguese living in poverty in 2006, but this
number fell 23% to 358.4 thousand by 2014, whilst the percentage of elderly in the whole
population increased by 3 pp. This reduction had a visible impact on the structure of the population
who live in poverty: in 2006, about a quarter of the poor were elderly, but in 2014 this proportion
dropped to 17.8% (with a minimum of 15.1% in 2011.
25,5%
22,3%
20,1% 21,0% 20,0%
17,4%
14,6% 15,1% 17,0% 16,6%
17,7% 17,4%
17,2% 17,6% 18,0%
19,8%
20,5% 20,1%
10% 12% 14% 16% 18% 20% 22% 24% 26% 28%
2006 2007 2008 2009 2010 2011 2012 2013 2014
8 Figure 4: Number of elderly poor and proportion of elderly poor in poor population,
Portugal 2006-14
Source: INE-Statistics Portugal, EU-SILC 2007-2015. Authors’ calculations.
The analysis of the elderly poverty incidence is complemented by that of its intensity in Figure 5. The
latter investigates how poor the poor actually are, and corresponds to the “relative at risk poverty
gap”3
published by Eurostat. The elderly poverty intensity fell 6 pp in 2006-10 and then rose until
2013 (to 21%), but remained below the national intensity, a direct consequence of the existing
specific social protection policies targeting the elderly. Any individual aged 65+ in a vulnerable
economic situation is legally entitled to the social old-age pension or/and the CSI (“Complemento
Solidário para Idosos”). Although quite different in value, the elderly and national poverty intensities
follow a closer pattern than the two poverty incidence series in Figure 3 above.
3
Eurostat defines the “relative at risk poverty gap” as the difference between the median equivalised disposable income of individuals below the at-risk-of-poverty threshold and the value of this threshold, expressed as a percentage of the same threshold.
24%
21%
20% 21% 20%
19%
15% 15%
18%
0% 5% 10% 15% 20% 25% 30%
0 50 100 150 200 250 300 350 400 450 500
2006 2007 2008 2009 2010 2011 2012 2013 2014
Number of elderly poor (thousands)
9 Figure 5: Relative median at-risk-of-poverty gap of elderly people,
Portugal 2006-14
Source: INE-Statistics Portugal, EU-SILC 2007-2015. Authors’ calculations.
The study of the elderly poverty between 2009 and 2013 in this section reveals a quite distinct
evolution from that of the national poverty: whereas the latter increased by 1.6 pp, the elderly rate
fell 4.0 pp. Moreover, the effects of the economic crisis and austerity policies started hitting the
non-elderly in 2010, but were only noticeably felt by the non-elderly from 2012, as confirmed by the four
times higher increase in non-elderly poverty intensity in 2010-12. The reasons for this disparity
between non-elderly and elderly poverty are necessarily connected with differences in their incomes
in this period which will be investigated in the next section.
4. An ageing and less poor population: elderly income in 2006-14
The income of the 65+ population is evaluated using the concept of the mean equivalised income of
the elderly. Table 2 shows how the elderly real equivalised income improved significantly in the
2006-14 period, overtaking the national average (and the non-elderly) equivalised income in
2011-12.
19%
18%
15% 16%
11% 11%
13%
21% 18% 27%
24%
27%
26% 25% 27%
32% 33% 32%
0% 5% 10% 15% 20% 25% 30% 35%
2006 2007 2008 2009 2010 2011 2012 2013 2014
10
Table 2: Equivalised Disposable Income of the elderly and of the population (€ /year at 2014 prices) , 2006-14
2006 2007 2008 2009 2010 2011 2012 2013 2014
less than 65 years 11494 11565 11343 11591 11225 10496 9870 9869 10040
65 years or over 9656 10062 10142 10426 10442 10561 10005 9665 9823
Population 11177 11303 11131 11383 11083 10509 9897 9829 9996
Source: INE-Statistics Portugal, EU-SILC 2007-2015. Authors’ calculations.
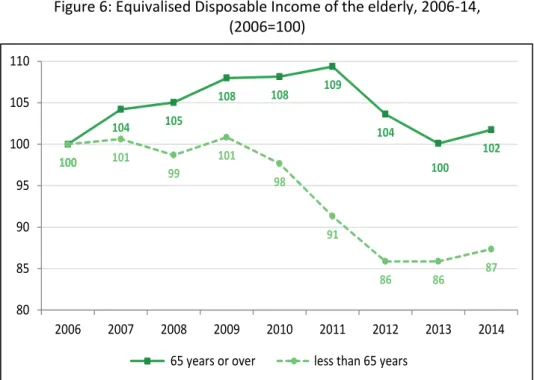
Figure 6 is particularly informative of the way the economic crisis and subsequent austerity policies
affected the income of the elderly population. Furthermore, it shows how throughout this period the
shifts in the elderly income were always less profound than those of the whole population. Before
the crisis, in 2006-09, the income of the 65+ group increased by 8% in real terms, whilst the income
of the whole population rose by less than 2%; during the deepest period of the crisis, 2010-13, the
elderly income increased 7.3%, compared to a 13.7% drop in the national income.
This period can thus be divided into two very different sub-periods in terms of the elderly income:
2010-11, when there is a slowing down in its rate of growth, and 2012-13, when it suffers a sharp
reduction. The first sub-period is explained by the implementation of austerity policies that had a
limited effect on the elderly income, chiefly through freezing the highest old-age pensions. All
changed in 2012-13 with the implementation of austerity policies specifically aimed at the elderly,
such as freezing the nominal value of most old-age pensions; strong increase in taxation of the
highest old-age pensions; new additional solidarity tax (Contribuição Extraordinária de
Solidariedade) payable by old-age pensions above 5,000€ in 2012 and above 1,350€ in 2013; and
11 Figure 6: Equivalised Disposable Income of the elderly, 2006-14,
(2006=100)
Source: INE-Statistics Portugal, EU-SILC 2007-2015. Authors’ calculations.
The cumulative result effect of these measures is a fall of 8.5% in the elderly income in 2012-13,
which the small recovery in 2014 (+1.6%) cannot eliminate, and leads to an average equivalised
elderly income in 2014 5.8% lower than its pre-crisis 2009 value. However, the impact of the
austerity cuts on the elderly is much smaller than on the whole population, whose income fell by
13.7% in 2009-13. A possible explanation for this difference is given in Table 3: pensions (the vast
majority of which are old-age pensions) increased until 2011, whereas disposable household income
started its (much steeper) downward cycle at the start of the crisis in 2010. By 2014, the latter is still
below its 2006 value (92.0%), even though it had a maximum of 101.5% in pre-crisis 2009, but the
average pension is 11.9% above its 2006 average, after an in-crisis 2011 maximum of 113.4%.
Table 3: Evolution of disposable household income and pensions, 2006-14 (2006=100)
2006 2007 2008 2009 2010 2011 2012 2013 2014
Disposable household Income 100.0 100.9 100.3 101.5 100.4 95.1 91.3 90.4 92.0
Pensions 100.0 100.9 100.0 105.4 106.9 113.4 113.1 112.0 111.9
Source:INE-Statistics Portugal, EU-SILC 2007-2015.Authors’ calculations.
100
104 105
108 108 109
104
100
102
100 101
99
101
98
91
86 86 87
80 85 90 95 100 105 110
2006 2007 2008 2009 2010 2011 2012 2013 2014
12
The importance of (old-age) pensions4 can be confirmed in Figure 7, where they represent an
overwhelming proportion of the income resources of the elderly5, which increased from 73.4% in
2006 to 79.2% in 2014. Market income fell consistently from 23.4% in 2006 to 17.9% in 2013, and
then rose to 18.7% in 2014. The very small (below 3.5%) and decreasing (2.1% in 2014) proportion of
‘social transfers excluding pensions’ seems a paradox, but there are two likely database related
explanations for it: the means-tested social pension, the main social transfer to the elderly is
included under the ‘old age and survival pensions’ heading in the EU-SILC database; the CSI, the
other elderly social transfer, is clearly under-represented in the EU-SILC, possibly because many of
the beneficiaries regard it as a pension and therefore include its amount under that same heading.
Figure 7: Structure of elderly income resources, 2006-14
Source: INE-Statistics Portugal, EU-SILC 2007-2015. Authors’ calculations.
However, the differences in the evolution of the elderly and non-elderly incomes cannot explain fully
the disparity between their poverty indicators. Figure 8 reveals how heterogeneous elderly income
4 Portugal has essentially a Bismarckian pension system, where pension values are a function of the
contributions paid and number of years worked by the beneficiary, which is complemented first by a non-contributory means-tested social pension to which those aged 65+ with no other source of income are entitled, and secondly by the CSI when the social pension is not enough to take the household income above the poverty line.
5
When the elderly share their household with non-elderly members, their equivalised income calculations incorporate their pooled incomes (no impact if elderly live in elderly-only households). As an example, in 2014, the contributory pensions corresponded to 91.0% of the elderly (only) income, but to 79.2% of their (pooled) income, as reported in Figure 7. Given that the aim of this study is to investigate the changes in elderly poverty, it is the pooled equivalised income that is used in the analysis.
23% 24% 24% 23% 22% 20% 20% 18% 19%
73% 74% 74% 75% 75% 78% 78% 80% 79%
0% 10% 20% 30% 40% 50% 60% 70% 80% 90% 100%
2006 2007 2008 2009 2010 2011 2012 2013 2014
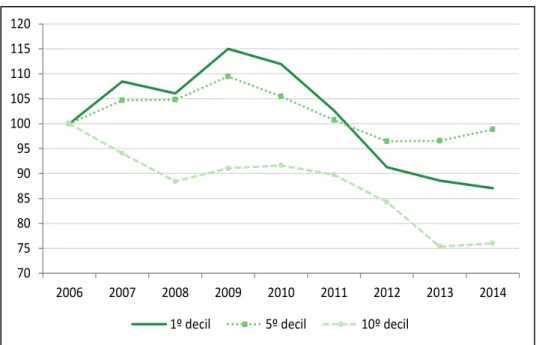
13
variations were in this period by plotting the average income of the elderly situated in the 1st, 5th and
10th deciles of the national income in 2006-14.
Figure 8: Average equivalised income of the elderly in selected national equivalised income deciles, 2006-14
Source: INE-Statistics Portugal, EU-SILC 2007-2015. Authors’ calculations.
The average equivalised income of the elderly in the 1st population decile rose by about 15% in
2006-09, in line with the significant drop in elderly poverty, but it fell consistently until 2014, to 87% of its
2006 value and 76% of 2009’s. The main explanation is that the incomes in the 1st decile are below
the poverty line and are mainly composed of social transfers that were seriously affected by the
austerity cuts from 2010. At the opposite end of the distribution, the fall in the average equivalised
income of the elderly in the 10th decile was more substantial, with a 2014 value 24% lower than that
in 2006, reflecting the deep austerity cuts in the highest pensions from 2012. Finally, the elderly in
the middle of the distribution 5th decile were the least affected, and their average income changed
within much narrower bands. It increased until 2009, and then fell slowly, first due to the austerity
social transfer cuts implemented from 2010 and then to the pension cuts, before enjoying a small
recovery in 2014 which took it back close to the 2006 value.
Figure 8 thus suggests that the decrease in the elderly poverty rate during the first years of the
economic crisis was not caused by an actual increase in the absolute value of the elderly equivalised
income but, instead, by its lower relative, a conclusion confirmed in Figure 9. 70
75 80 85 90 95 100 105 110 115 120
2006 2007 2008 2009 2010 2011 2012 2013 2014
14
Figure 9: Distribution of the number of elderly in the 1st and last quintiles of the
equivalised income distribution, 2006-14
Source: INE-Statistics Portugal, EU-SILC 2007-2015. Authors’ calculations.
The proportion of the elderly in the 1st quintile (1st and 2nd deciles) of the equivalised income
distribution dropped from 29.4% to 17.9%, whereas their proportion in the last quintile (9th and 10th)
rose from 13.6% to 18.2% between 2006 and 2014. Once more, the alterations in the elderly income
did not lead to actual gains, but rather to smaller falls than those of other age groups.
Another way of investigating the heterogeneity of the elderly population is through the analysis of
the inequality of their income distribution measured by the Gini coefficient, particularly relevant
given the high levels of inequality recorded in Portugal as discussed, for example, in Rodrigues
(2015).
29%
25% 25% 25% 22%
18%
15% 16%
18% 14% 15%
16%
15% 16%
19%
18% 18% 18%
0% 5% 10% 15% 20% 25% 30% 35%
2006 2007 2008 2009 2010 2011 2012 2013 2014
15 Figure 10: Gini, 2006-14
Source: INE-Statistics Portugal, EU-SILC 2007-2015. Authors’ calculations.
In 2006, the elderly income distribution was slightly more unequal than that of the whole population
(Gini of 37.3% and 36.8%, respectively), both dropping unevenly to similar levels in 2009-10, as
shown in Figure 10. The different impact of the crisis on the elderly poverty is also reflected on their
inequality, which rose in 2011 (35.1%) and then fell to 32.5% in 2014, compared to a national
inequality that remained above 34%.
Finally, the estimation of density functions of the elderly income in Figure 11 provides a more
comprehensive analysis of its evolution. The shift to the left of the lower part of the (unimodal)
density function between 2010 and 2014 indicates a decrease in the equivalised disposable income
of the poorest elderly, when the ‘peak’ of the distribution remained almost unchanged at around
6000€/year.
.
37,3%
34,9%
34,2%
33,6% 34,0%
35,1%
33,3%
32,3% 32,5%
30% 31% 32% 33% 34% 35% 36% 37% 38%
2006 2007 2008 2009 2010 2011 2012 2013 2014
16 Figure 11: Density function of equivalised disposable elderly income, 2010 and 2014
Source: INE-Statistics Portugal, EU-SILC 2011 and 2015. Authors’ calculations.
5. Sensitivity of the elderly poverty rate to the median income trap
In section 3 above it was shown that the elderly poverty intensity is lower than the national intensity
when both are measured by the relative median at-risk-of-poverty gap. This result suggests that the
distance between the elderly median income and the poverty line value is shorter than for the whole
population. Therefore a sizeable number of the elderly poor have an equivalised income not far off
the poverty line, which points to higher sensitivity of their poverty to fluctuations in the poverty line
itself. This hypothesis can be tested by recalculating the elderly poverty rate for different values of
the poverty line, as done in Figure 12 for values 10% higher or lower than its actual estimated value.
0,000000 0,000020 0,000040 0,000060 0,000080 0,000100 0,000120 0,000140
17 Figure 12: Sensitivity of the elderly poverty rate to changes in the poverty line, 2006-14
Source: INE-Statistics Portugal, EU-SILC 2007-2015. Authors’ calculations.
Even this small variation, equivalent to a change of about 40€ in the monthly income, causes
significant and asymmetric changes in the elderly poverty rate. For example, at the beginning of the
crisis in 2010, it would have produced an increase of +5 pp, or a decrease of -9 pp, in the elderly
poverty rate. This augmented sensitivity is particularly relevant in times of recession, when the
decrease in household incomes can lead to a drop in the median income. The resultant fall in the
poverty line is defined as the “median income trap”, and it warrants particular interest in cases, like
the Portuguese, where the cuts in labour and pension incomes affected mostly incomes close to the
median of its distribution. Its relevance can be appreciated in Figure 13 which shows that the
decrease in household incomes caused a decrease in the ‘official’ poverty line from 434€/month in
2009 to 422€ in 2014 for an individual living alone, or from 911€ to 886€, respectively, for a couple with two young children. A direct consequence of this fall is that many individuals and families that
became non-poor, although their resources did not improve or may even have worsened.
In this context, the ‘official’ poverty indicators tend to undervalue the true extent of poverty and do
not reflect in full the real deterioration of the living conditions of the population: the increase from
17.9% to 19.5% in the poverty rate in 2009-14 is not sufficient to explain the increased poverty
experienced by the organizations that work with the most vulnerable sectors of the Portuguese
society. However, there is a poverty indicator defined by the Eurostat that can reduce or even
overcome this ‘trap’: the ‘poverty lined anchored in a defined year’. This line is estimated for the
26%
22%
20% 21% 20%
17%
15% 15%
17% 33%
31%
29% 29%
25%
20%
19%
23% 23%
17%
16%
13% 14%
11%
9% 9% 11%
12%
0% 5% 10% 15% 20% 25% 30% 35%
2006 2007 2008 2009 2010 2011 2012 2013 2014
18 base year (2009 in Figure 13) and its value in real terms (using the CPI) is used as the poverty line in
the following period (2010-14). Thus, a (partial) approximation to an absolute poverty line
unconditional on the oscillations of the median income is estimated using a relative poverty line.
Figure 13: Poverty line: ‘official’ and anchored in 2009 (€/month), 2009-14
Source: INE-Statistics Portugal, EU-SILC 2010-2015. Authors’ calculations.
The results in Figure 14 show that the decrease in the ‘official’ elderly poverty rate is not confirmed
by the ‘anchored’ rate.
434
421 416
409 411
422
434 440
456
469 470 470
300 320 340 360 380 400 420 440 460 480 500
2009 2010 2011 2012 2013 2014
19 Figure 14: Elderly poverty rate, 2009-14
Source: INE-Statistics Portugal, EU-SILC 2010-2015. Authors’ calculations.
Between 2010 and 2014, the elderly poverty rate increases 2.2 pp instead of decreasing 3.0 pp as
suggested by the ‘official’ rate. Therefore, the ‘anchored’ rate allows for an alternative interpretation of social impact on the elderly of the adjustment program: the apparent maintenance,
or even improvement, in the living conditions of the elderly population becomes, to a large extent,
an illusion produced by the ‘median income trap’.
6. Elderly Material Deprivation and consistent poverty
It is widely agreed that being poor has more than a monetary dimension and also needs to reflect
the living conditions of the individuals and households. The material dimension of poverty, or
material deprivation, is defined as the inability to attain certain basic standards of living and
consumption. The EU has thus selected nine indicators of material deprivation6 which are listed in
the first column of Table 4. Using this information, Eurostat calculates three measures of material
deprivation. The first is given by the proportion of individuals that suffer an enforced lack of at least
(any) three of the nine items, whereas the second measures ‘severe material deprivation’ by increasing that number of deprived items to (any) four. Both are measures of deprivation incidence,
6
See Guio (2005, 2009) and Guio et al. (2009), for example.
21,0%
20,0%
17,4%
14,6% 15,1%
17,0% 21,0% 21,6%
20,0%
22,4%
25,5%
23,8%
10% 12% 14% 16% 18% 20% 22% 24% 26% 28%
2009 2010 2011 2012 2013 2014
20 whilst the third measures the intensity of deprivation, defined as the mean of the actual number of
items the deprived individuals are deprived of.
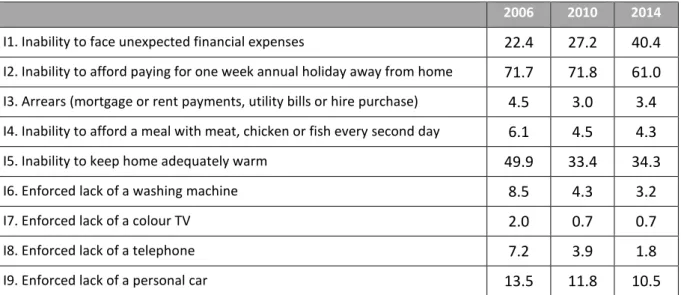
Table 4 records the ‘enforced lack’, i.e., the percentage of the elderly that would have liked, but
could not afford, to own each of the nine items7 in 2006, 2010 and 20148. The three items the
elderly are mostly deprived are: “Inability to afford paying for one week annual holiday away from
home” (I2), “Inability to face unexpected financial expenses” (I1), and “Inability to keep home
adequately warm” (I5), followed by a distant fourth “enforced lack of a personal car” (I9). There is a general decrease in elderly deprivation in this period, with the exception of the capacity to deal with
unexpected financial expenses which, hardly unexpectedly, rose strongly since the start of the
economic crisis. The small importance of ‘arrears’ (I3) for the elderly population possibly reflects age circumstances, as the elderly have probably finished paying their mortgages.
.
Table 4: Deprivation Indicators of older people(%), 2006, 2010 and 2014
2006 2010 2014
I1. Inability to face unexpected financial expenses 22.4 27.2 40.4
I2. Inability to afford paying for one week annual holiday away from home 71.7 71.8 61.0
I3. Arrears (mortgage or rent payments, utility bills or hire purchase) 4.5 3.0 3.4
I4. Inability to afford a meal with meat, chicken or fish every second day 6.1 4.5 4.3
I5. Inability to keep home adequately warm 49.9 33.4 34.3
I6. Enforced lack of a washing machine 8.5 4.3 3.2
I7. Enforced lack of a colour TV 2.0 0.7 0.7
I8. Enforced lack of a telephone 7.2 3.9 1.8
I9. Enforced lack of a personal car 13.5 11.8 10.5
Source: INE-Statistics Portugal, EU-SILC 2006, 2010 and 2014. Authors’ calculations.
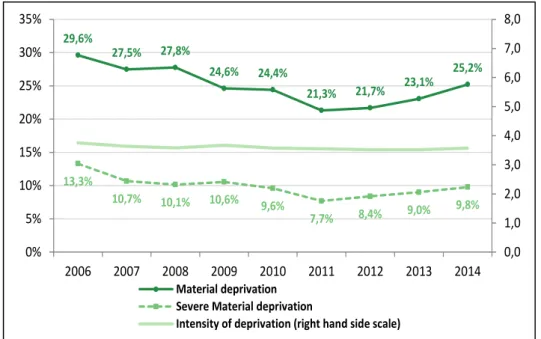
The increase in elderly income discussed in section 4 above is reflected in the decline in their
material deprivation and severe material deprivation rates until 2011, as shown in Figure 15. The
onset of the economic crisis led to an increase in both rates to just over a quarter of the elderly
lacking three or more items, and just below 10% lacking four or more in 2014, but still below the
7
These indicators distinguish between individuals that do not own items 6 to 9 due to lack of financial capacity and those who have no interest or necessity in them.
8
21 2006 rates. The deprivation intensity (measured by the number of lacked items in the RHS scale of
Figure 15) remained basically unchanged throughout the period at just over 3.5 items.
Figure 15: Material, severe material and intensity of deprivation of elderly, 2006-14
Source: INE-Statistics Portugal, EU-SILC 2006-2014. Authors’ calculations.
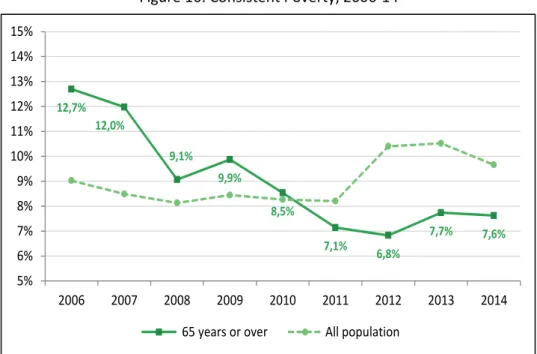
The two dimensions of poverty are brought together in the concept of consistent poverty:
individuals that are both poor and materially deprived are defined as consistently poor9. The already
noted drop in both elderly poverty and material deprivation rates led to the reduction in the elderly
consistent poverty rate to values below the national rate in 2011 and 2012 (6.8% compared to
10.4%) confirmed in Figure 16. However, the increase in the elderly poverty rate in 2013 increased
consistent poverty, but still below both its pre-2011 and national rate values.
9
See Whelan et al. (2006), for example. 29,6%
27,5% 27,8%
24,6% 24,4%
21,3% 21,7% 23,1%
25,2%
13,3%
10,7% 10,1% 10,6% 9,6%
7,7% 8,4% 9,0%
9,8%
0,0 1,0 2,0 3,0 4,0 5,0 6,0 7,0 8,0
0% 5% 10% 15% 20% 25% 30% 35%
2006 2007 2008 2009 2010 2011 2012 2013 2014 Material deprivation
Severe Material deprivation
22 Figure 16: Consistent Poverty, 2006-14
Source: INE-Statistics Portugal, EU-SILC 2007-2015. Authors’ calculations.
7. Elderly individuals or elderly groups?
So far, the elderly have been considered a homogeneous group only defined by the usual age
threshold of 65 years. This definition is used by both the Portuguese and EU statistical systems, and
is generally implicit in the design of social policies targeting the older population10. However, it is
debatable whether poverty and social vulnerability affect all elderly individuals equally, are
exclusively income-related and can be dealt with satisfactorily through means-testing, or whether
there are specific elderly groups which are more vulnerable to their consequences. Furthermore, it is
questionable whether the adjustment program affected all elderly in a similar manner. In order to
address these issues in detail in this section, the elderly are divided into categories defined by age11,
gender and type of household.
Table 5 reports the structure of the elderly population in this period. Two important characteristics
of the elderly stand out immediately: (a) their rapid ageing, with the proportion of 75+ increasing
from 44.9% of the total number of elderly to 49.1% in 2014, or from 7.7% to 10.0% of the total
population; (b) the higher female longevity, with about 30% of all elderly being women aged 75+;
10
Nonetheless, some Portuguese social policies, such as the social pension and the CSI, provide additional benefits to the elderly aged 75+.
11
The main reason for the consideration of only two age groups, 65-74 and 75+, is that all ages above 80 years old are simply recoded as 80 in all INE and Eurostat micro-data databases in order to protect data anonymity.
12,7% 12,0%
9,1%
9,9%
8,5%
7,1%
6,8%
7,7% 7,6%
5% 6% 7% 8% 9% 10% 11% 12% 13% 14% 15%
2006 2007 2008 2009 2010 2011 2012 2013 2014
23 and (c) the high proportion of elderly living alone (24.2% in 2014) and in elderly-only households
(66.1%).
Table 5: Structure of the elderly population (%), 2006-14
2006 2007 2008 2009 2010 2011 2012 2013 2014
From 65 to 74 years 55.1 54.3 53.6 53.2 52.6 51.6 51.1 51.0 50.9
75 years or over 44.9 45.7 46.4 46.8 47.4 48.4 48.9 49.0 49.1
From 65 to 74 years-Males 24.6 24.3 24.0 23.8 23.6 23.3 22.8 22.8 22.8
From 65 to 74 years-Females 30.5 30.0 29.6 29.3 29.0 28.2 28.3 28.2 28.1
75 years or over-Males 17.1 17.5 17.7 17.9 18.2 18.7 18.6 18.6 18.7
75 years or over-Females 27.7 28.2 28.6 28.9 29.3 29.8 30.3 30.3 30.4
One person family aged 75+ 14.1 14.2 14.5 14.3 16.0 15.2 14.5 15.6 15.5
One person family aged 65-74 8.0 9.0 8.4 8.5 8.5 7.9 8.2 9.1 8.7
Couple both 75+ 11.6 12.4 13.0 13.6 14.0 15.1 15.8 15.3 15.1
Other elderly couples 27.5 27.2 27.1 26.2 24.8 26.0 26.0 25.8 26.8
Couple with one elderly person 5.4 5.2 4.9 4.6 4.8 5.0 5.1 5.1 5.3
Other elderly persons 33.4 32.0 32.2 32.8 31.8 30.9 30.4 29.0 28.6
Source:INE-Statistics Portugal, EU-SILC 2007-2015.Authors’ calculations.
Starting with the analysis of the elderly equivalised income, its evolution by age group and gender is
24 Figure 17: Elderly equivalised income by age group and gender,
2006, 2009 and 2014 (€/year)
Source: INE-Statistics Portugal, EU-SILC 2007, 2010, and 2015. Authors’ calculations.
Throughout, the average equivalised income of the younger old (65-74) is higher than that of the
older old (75+). Although the age group stays the main discriminatory factor, its importance has
decreased in time: the 65-74 income was 28% higher than the 75+ in 2006 and 20% in both 2009 and
2014. A possible reason is that each new generation of elderly has retired having had longer
contributory careers and higher pre-retirement salaries which have led to higher pensions. The
average equivalised male income is about 10% higher than the female one, and the gender gap has
increased: 12.2% in 2014 up from 8.7% in 2009. The gap widens when the age group is also included:
the poorest category is that of the older old females.
Figure 17 also shows that the equivalised incomes of all categories increased between 2006 and
2009, but the opposite happened between 2009 and 2014, a direct result of the economic crisis and
austerity already discussed. However, the fiscal policies and cuts in highest pensions followed in the
adjustment process had some progressive character and therefore contributed to a slight alleviation
in the differences between the equivalised incomes of the different categories. This result is also
consistent with the fall in the Gini detected in section 4 above.
The type of household the elderly inhabit is another important factor in elderly income
differentiation, as demonstrated in Figure 18. The elderly living alone and the elderly couples with
both spouses aged 75+ are the most vulnerable categories, but were the least affected during the 0
2 000 4 000 6 000 8 000 10 000 12 000 14 000
From 65 to 74 years-Males
From 65 to 74 years-Females
75 years or over-Males
75 years or over-Females
25 adjustment process, when their incomes decreased by a comparably paltry 1.5%. In fact, the
equivalised income of the elderly living alone is always below 80% of the average elderly equivalent
income. Conversely, the categories of elderly that live in extended households have the highest
levels of equivalised income, but were also those that were more heavily penalised by the
adjustment process.
Figure 18: Elderly equivalised income by Household Type,
2006, 2009 and 2014 (€/year)
Source: INE-Statistics Portugal, EU-SILC 2007, 2010, and 2015. Authors’ calculations.
The variation in elderly poverty using the ‘official’ poverty line for all elderly categories in the two
sub-periods 2006-09 and 2009-14 is shown in Figures 19 and 20. The poverty rate of nearly all
categories fell consistently, but at different speeds, and still the lower rates kept their heterogeneity
across the categories. The extra information in these figures gives a further insight into the analysis
of elderly poverty in section 3 above. It had concluded that in the pre-crisis period, the elderly
poverty rate fell from 25.5% in 2006 to 21.0% in 2009, but it is now possible to uncover that this
reduction is more evident in some categories with higher poverty rates (75+ males (21%) and
couples both spouses 75+ (27%)), but not in others (75+ females (29%) and elderly living alone (39%
for 75+ and 27% for 65-74)). This asymmetric poverty reduction thus created pockets of extreme
poverty amongst the elderly just before the onset of the economic crisis. 0
2 000 4 000 6 000 8 000 10 000 12 000 14 000
One person family aged
75+
One person family aged
65-74
Couple both 75+
Other elderly couples
Couple with one elderly
person
Other elderly persons
26 Figure 19: Elderly poverty rate by age and gender, 2006, 2009 and 2014
Source: INE-Statistics Portugal, EU-SILC 2007, 2010, and 2015. Authors’ calculations.
In the second sub-period, 2009-14, the categories with lower average equivalised income achieve
higher decreases in their poverty rate, but the elderly living alone remain much more vulnerable
than all others. Their 2014 poverty rates of 26% (65-74) and 27% (75+) stand well apart all other
household type categories whose rates fell to between 10%–18%.
18%
23%
31% 31%
15%
18%
21%
29%
13%
17%
15%
21%
0% 5% 10% 15% 20% 25% 30% 35%
From 65 to 74 years-Males
From 65 to 74 years-Females
75 years or over-Males
75 years or over-Females
27 Figure 20: Elderly poverty rate by Household Type, 2006, 2009 and 2014
Source: INE-Statistics Portugal, EU-SILC 2007, 2010, and 2015. Authors’ calculations.
It is important to determine whether the above reduction in the elderly poverty rates was achieved
by, or is spite of, the public policies implemented during the adjustment process. On one hand, the
old-age pension cuts and the deep increases in the tax burden effectively hit the incomes situated
well above the poverty line, and therefore would not be expected to affect the elderly poverty rate.
On the other hand, the cuts in some social benefits targeted at the elderly, such as the CSI, would
necessarily increase the poverty indicators.
The only plausible explanation for the above improvement in the poverty indicators is that the
austerity policies provoked a decrease in the poverty level itself, an explanation that seems
vindicated by Figures 21 and 22. These figures follow from the discussion on the median income trap
in section 5 above, and are hence constructed using the poverty line anchored in 2009 before the
crisis. They show that the poverty rates of virtually all elderly categories increased between 2009
and 2014, with the sole exceptions of the elderly 75+ living alone and couples both spouses 75+,
already identified as highly vulnerable. Therefore, the main justification for the decrease in the
elderly poverty rate in the period of budget consolidation becomes the fall in the poverty line itself,
rather than an actual improvement in the income and living conditions of the elderly.
38% 35% 39% 18% 34% 18% 39% 27% 27% 15% 23% 13% 27% 26% 13% 10% 18% 17% 0% 5% 10% 15% 20% 25% 30% 35% 40% 45% One person family aged 75+ One person family aged 65-74 Couple both 75+ Other elderly couples Couple with one elderly person Other elderly persons
28 Figure 21: Elderly poverty rate anchored in 2009 by age group and gender,
2009 and 2014
Source: INE-Statistics Portugal, EU-SILC 2010 and 2015. Authors’ calculations.
Figure 22: Elderly poverty rate anchored in 2009 by household type, 2009 and 2014
Source: INE-Statistics Portugal, EU-SILC 2010 and 2015. Authors’ calculations. 15% 18% 21% 29% 18% 22% 24% 29% 0% 5% 10% 15% 20% 25% 30% 35%
From 65 to 74 years-Males
From 65 to 74 years-Females
75 years or over-Males
29
8. Conclusion
One of the paradoxes of the profound economic and social crisis that affects our country since 2010
is the decrease in the elderly poverty rate, which fell 4 pp between 2009 and 2014, from 21% to
17%. It actually attained an historical minimum of 14.6% in 2012, when it was about 4 pp lower than
the national poverty rate.
An initial justification put forward for this decline is that it is a lingering result from the earlier elderly
poverty reduction cycle, one which started at the beginning of the 1990s with social policies
specifically targeting the elderly and improved contributory and means-tested old-age pensions, and
achieved extraordinary success. The rise in the number and proportion of elderly in the Portuguese
population, continuously ‘joined’ by new generations of old-age pensioners who had enjoyed
average higher wages and longer contributory periods during their working lives, would be enough
to overcome the effects of the crisis and explain the observed reduction in poverty. However, this
explanation is easily challenged by the 6% fall in the average real elderly income in this period.
A second justification is that the austerity policies, such as the cuts in old-age pensions and increases
in the tax burden, targeted the highest pensions/incomes and thus safeguarded the incomes of the
more vulnerable elderly. This is only partially accurate: although the poorest elderly may have
avoided these cuts, they were nevertheless hit by the cuts in social benefits, such as the CSI. This
impact is clearly revealed by the significant reduction in both its number of beneficiaries and total
amount of benefits paid out.
The third and final justification is proposed for the first time in the current study. The decrease in
the ‘official’ elderly poverty indicators in 2009-14 is connected with the drop in the poverty
threshold caused by the decrease in the average median income of the whole population. If its effect
is removed from the analysis through the usage of the anchored poverty line, the elderly poverty
indicators actually increased, rather than decreased, during the economic crisis.
This study also establishes the heterogeneity of the elderly population in terms of poverty indicators:
although their (official) poverty rate as a whole fell, poverty pockets subsist where this rate persists
at disturbingly high levels. In particular, the elderly living alone record a poverty rate of about 27% in
2014, implying that this group remains one of great economic and social vulnerability, and calling for
30
References
Ahonen, K. and Back-Othman, J. (2010).Tracing old-age poverty – the significance of the household
structure on gender differences in the poverty rate in eight EU countries, Finnish Centre for Pensions Working Papers, 2010:7.
Albuquerque, P., Arcanjo, M., Nunes, F. and Pereirinha, J. (2010). Retirement and the Poverty of the
Elderly: The Case of Portugal, Journal of Income Distribution, vol. 19(3-4), pp. 41-64.
Aziz, O., Gemmell, N., and Laws, A. (2013). The distribution of income and fiscal incidence by age and
gender: Some evidence from New Zealand, Victoria University of Wellington Working Papers in Public Finance 10/2013.
Bosworth, B., Burtless, G, and Zhang, K. (2016). Later retirement, inequality in old age, and the
growing gap in longevity between rich and poor, Economic Studies at Brookings, The Brookings Institution, Washington.
Brown, R.L. and Prus, S.G. (2006). Income inequality over the later-life course: A comparative
analysis of seven OECD countries, Annals of Actuarial Science 1, 307-317.
Callan, T., Leventi, C., et al. (2011). The distributional effects of austerity measures: a comparison of
six EU countries, EUROMOD Working Papers EM6/11, Institute for Social and Economic Research, Colchester.
Carrilho, M.J. and Craveiro, M.L. (2013). A situação demográfica recente em Portugal, Revista de
Estudos Demográficos, 50, 45-90, INE, Lisboa.
Goudswaard, K., van Vliet, O., Been, J. and Caminada, K. (2012). Pensions and income inequality in
old age, CESifo DICE Report, 4/2012, 21-26.
Guio, A-C. (2005). Material Deprivation in the EU, Statistics in Focus: Population and Social
Conditions, 21/2005, Eurostat, Luxembourg.
Guio, A.C. (2009). What can be learned from deprivation indicators in Europe, Luxembourg, Eurostat.
Guio, A-C., Fusco, A. and Marlier, E. (2009). A European Union Approach to Material Deprivation
using EU-SILC and Eurobarometer Data, IRISS Working Paper 2009-19.
Lindquist, G.S. and Wadensjo, E. (2012). Income distribution among those of 65 years and older in
Sweden, IZA DP No. 6745.
Prunty, M. (2007). Older people in poverty in Ireland: An analysis of EU-SILC 2004, Combat Poverty
Agency Working Paper Series 07/02.
Rodrigues, C.F. (2015). Efeitos redistributivos do Programa de Ajustamento em Portugal. In Viriato
Soromenho-Marques e Paulo Trigo Pereira (Eds), Afirmar o Futuro: Políticas Públicas para Portugal,
Vol I - Estado, Instituições e Políticas Sociais, Fundação Calouste Gulbenkian, Lisboa, pp 216-259.
Rodrigues, C.F. and Andrade, I. (2014). Ageing and poverty: how older Portuguese adults became
less poor in the noughties, European Journal of Ageing, 11, 285-92.
Whelan, C. T., Nolan, B.T., et al. (2006). Measuring Consistent Poverty in Ireland with EU SILC Data,
ESRI Working Paper 165, Economic and Social Research Institute, Dublin.
Zaidi, A. (2009). Poverty and income of older people in OECD countries, ECSWPR, Vienna.
Zaidi, A. (2010). Poverty risks for older people in EU countries – An update, ECSWPR Policy Brief