NHESSD
1, 3735–3762, 2013Flash-heat events in the Mediterranean
basin
J. Mazon et al.
Title Page
Abstract Introduction
Conclusions References
Tables Figures
◭ ◮
◭ ◮
Back Close
Full Screen / Esc
Printer-friendly Version Interactive Discussion
Discussion
P
a
per
|
D
iscussion
P
a
per
|
Discussion
P
a
per
|
Discuss
ion
P
a
per
|
Nat. Hazards Earth Syst. Sci. Discuss., 1, 3735–3762, 2013 www.nat-hazards-earth-syst-sci-discuss.net/1/3735/2013/ doi:10.5194/nhessd-1-3735-2013
© Author(s) 2013. CC Attribution 3.0 License.
Geoscientific Geoscientific
Geoscientific Geoscientific
Natural Hazards and Earth System Sciences
Open Access
Discussions
This discussion paper is/has been under review for the journal Natural Hazards and Earth System Sciences (NHESS). Please refer to the corresponding final paper in NHESS if available.
Rapid and sudden advection of warm and
dry air in the Mediterranean basin
J. Mazon1, D. Pino1,2, and M. Barriendos3
1
Applied Physics Department, BarcelonaTech (UPC), Barcelona, Spain 2
Institute for Space Studies of Catalonia (IEEC–UPC), Barcelona, Spain 3
Institut Català de Ciències del Clima (IC3), Barcelona, Spain
Received: 21 May 2013 – Accepted: 20 July 2013 – Published: 2 August 2013
Correspondence to: J. Mazon ([email protected])
NHESSD
1, 3735–3762, 2013Flash-heat events in the Mediterranean
basin
J. Mazon et al.
Title Page
Abstract Introduction
Conclusions References
Tables Figures
◭ ◮
◭ ◮
Back Close
Full Screen / Esc
Printer-friendly Version Interactive Discussion
Discussion
P
a
per
|
D
iscussion
P
a
per
|
Discussion
P
a
per
|
Discuss
ion
P
a
per
Abstract
Rapid advection of extremely warm and dry air is studied during two events in the Mediterranean basin. On 27 August 2010 a rapid advection of extremely warm and dry air affected the northeast Iberian Peninsula during few hours. At the Barcelona city center, the temperature reached 39.3◦C, which is the maximum temperature value 5
recorded during 230 yr of daily data series. On 23 March 2008 a similar synoptic sit-uation was the cause of a rapid increase of temperature and drop of relative humid-ity recorded for few hours in Heraklion (Crete). During the morning on that day the recorded temperature reaches 34◦C for several hours in the north coastline of this
island.
10
According to the World Meteorological Organization none of these events can be classified as a heat wave, which requires at least two days of abnormally high temper-atures; or as a heat burst as defined by the American Meteorological Society, where abnormal temperatures take place over a few minutes. For this reason, we suggest naming this type of eventflash heat.
15
By using data from automatic weather stations in the Barcelona and Heraklion area and WRF mesoscale numerical simulations, these events are analyzed. Additionally, the primary risks and possible impacts on several fields are presented.
1 Introduction
The World20010 Meteorological Organization (WMO) defines a heat wave as a
phe-20
nomenon in which the daily maximum temperature of more than five consecutive days exceeds the average maximum temperature by 5◦C with respect to the period 1961–
1990 (Frich et al., 2012). The glossary of meteorology of the American Meteorological Society (AMETSOC, Glickman, 2000) defines a heat wave as a period of abnormally and uncomfortably hot and usually humid weather, which should last at least one day,
25
NHESSD
1, 3735–3762, 2013Flash-heat events in the Mediterranean
basin
J. Mazon et al.
Title Page
Abstract Introduction
Conclusions References
Tables Figures
◭ ◮
◭ ◮
Back Close
Full Screen / Esc
Printer-friendly Version Interactive Discussion
Discussion
P
a
per
|
D
iscussion
P
a
per
|
Discussion
P
a
per
|
Discuss
ion
P
a
per
|
slight variations in the values of exceeded temperature with respect to the average temperature depending on the national weather service. However, a common charac-teristic is found in all regional definitions: speaking about a heat wave requires duration of at least 2 consecutive days of abnormal temperature values. Thus, heat waves are considered a synoptic phenomenon that cover several thousands of kilometers and last
5
at least one day, but typically 2 or more days.
Many authors have studied the dynamics of heat waves and their effects in sev-eral fields, such as agriculture (Jolly et al., 2005), human health (Smoyer-Tomic et al., 2003; Meehl and Tebald, 2004), tourism (Steadman, 1984; Hamilton et al., 2005; Lise and Tol, 2002), energy consumption (Karl and Quayle, 1981; Hassid et al., 2000) and
10
water demand (Smoyer-Tomic et al., 2003). Furthermore, several studies (Meehl and Tebald, 2004; Trenberth et al., 2007) show that an increase in intensity, frequency and the duration of heat waves around the Earth will occur during the XXI century. In all scenarios shown in the 4th IPCC report (Trenberth et al., 2007), the Mediterranean basin will be one of the most significant regions affected by an increase in both the
15
intensity and frequency of heat waves during this century.
If a smaller scale is considered, the glossary of AMETSOC defines a heat burst as a rare atmospheric event characterized by gusty winds and a rapid increase in tem-perature and a decrease in relative humidity, typically occurring at night or in the early morning (Johnson, 1976; Glickman, 2000) and associated with descending air during
20
a thunderstorm. A heat burst occurs only for a few minutes. Recorded temperatures during heat bursts have reached well above 32◦C, sometimes rising by 11◦C or more
within only a few minutes. Heat bursts are also characterized by extremely dry air and are sometimes associated with strong winds.
This paper aims to study two events associated with an increase in temperature and
25
NHESSD
1, 3735–3762, 2013Flash-heat events in the Mediterranean
basin
J. Mazon et al.
Title Page
Abstract Introduction
Conclusions References
Tables Figures
◭ ◮
◭ ◮
Back Close
Full Screen / Esc
Printer-friendly Version Interactive Discussion
Discussion
P
a
per
|
D
iscussion
P
a
per
|
Discussion
P
a
per
|
Discuss
ion
P
a
per
associated with an adiabatic warming of downslope winds, associated to Foehn effect (Maninns and Sawford, 1979; Egger and Hoinka, 1992; Wakonigg, 1990).
However, the two studied cases here are associated to a rapid movement of a ridge from North Africa that shifted a warm and dry air mass from the Sahara desert. To our knowledge, there is no previous scientific reference naming this type of events. Table 1
5
summarizes the differences between the three types of abnormal high temperature events mentioned above. Note the different spatial and temporal scales of flash heat, as well as the dynamics of its formation.
The structure of this paper is as follows. Section 2 is devoted to analyze and describe by using observations and WRF mesoscale model numerical simulations the 27 August
10
2010 event in the northeast of the Iberian Peninsula, where a very warm and dry air mass affected this area over 8 h. It focuses on the Barcelona area, where the maximum daily temperature in over 230 yr was recorded. According to this analysis, a preliminary flash-heat definition is proposed in order to analyze the existence of similar flash-heat events during the XIX century in the daily temperature series of Barcelona (1790–
15
2012). The rapid increase of temperature and decrease of relative humidity occurred on 23 March 2008 in Heraklion (Crete island) is analyzed in Sect. 3. In Sect. 4 we describe the main impacts that this event could produce on several fields, mainly in agriculture, energy demand, health and fires. Finally, in Sect. 5 the main conclusions are presented.
20
2 The 27 August 2010 event (Barcelona event)
The summer of 2010 was the third warmest summer recorded in the Iberian Peninsula, according the Agency of Spanish Meteorology (AEMET). Particularly, August 2010 was the fifth warmest month since 1971; its mean temperature was 1.5◦C higher than the
average monthly temperature and it was the third warmest month in this century. At the
25
NHESSD
1, 3735–3762, 2013Flash-heat events in the Mediterranean
basin
J. Mazon et al.
Title Page
Abstract Introduction
Conclusions References
Tables Figures
◭ ◮
◭ ◮
Back Close
Full Screen / Esc
Printer-friendly Version Interactive Discussion
Discussion
P
a
per
|
D
iscussion
P
a
per
|
Discussion
P
a
per
|
Discuss
ion
P
a
per
|
were recorded. Minimum early morning temperatures of between 23 and 26◦C were
recorded by several official AEMET weather stations during this period.
However, the heat wave does not affect the north and northeast Iberian Peninsula. The warm and dry air mass was practically stationary, affecting the entire center and southern part of the Iberian Peninsula. But a rapid and brief movement of this warm
5
air mass from the southeast to northeast on the 27 August 2010 affected the northeast Iberian Peninsula for several hours, when a significant increase in temperature was recorded as well as a decrease in the relative and absolute humidity. Automatic weather station located in the Barcelona city center recorded 39.3◦C (the highest temperature
since 1780) and the relative humidity dropped to 19 %. In addition, the recorded
tem-10
perature values from 11:00 to 16:00 UTC were above 30◦C, higher than 5◦C than the
mean maximum temperature in August during the period 1961–1990, that has been 26.8◦C. However, for the 12 h prior to and later than the hours in which the maximum
value was recorded, the temperature remained within normal values. As will be shown, the period of abnormally high temperature could be considered as occurring from 11:00
15
to 16:00 UTC. This event cannot be classified according to the above definitions either as a heat wave or as a heat burst.
2.1 Synoptic situation
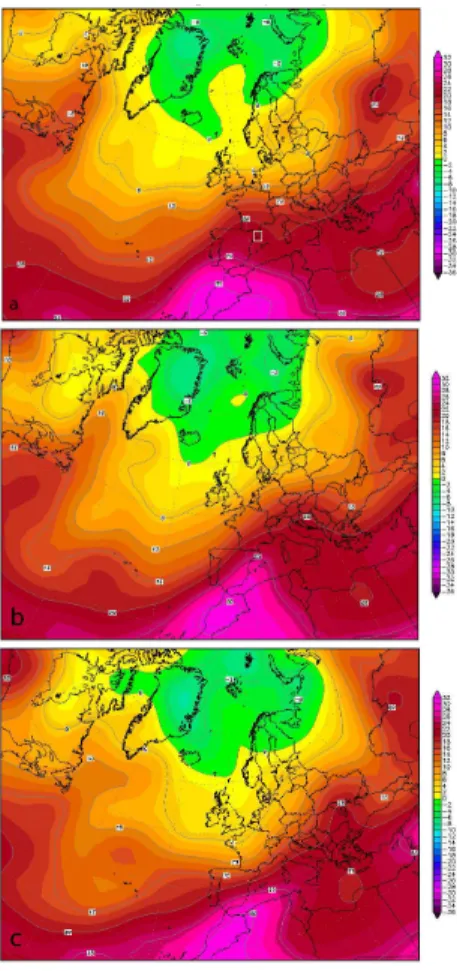
Figure 1 shows the temperature at 850 hPa obtained by the NCEP reanalysis at 00:00 UTC from 26 to 28 August 2010. A ridge from North Africa remained
station-20
ary in Northwest Africa for a few days before the 25 August 2010, when it began to move to the north. On 25 August at 00:00 UTC (not shown), the 25◦C isotherm at
850 hPa was located at the southern Iberian Peninsula and a large anticyclonic ridge was located in Northwest Africa. At the northern third of the Iberian Peninsula the 850 hPa isotherm was 15◦C at 00:00 UTC. On 26 August, the ridge moved to the north. 25
At 850 hPa (see Fig. 1a), the 25◦C isotherm was in the central and southern Iberian
Peninsula. On the 27, at 00:00 UTC (Fig. 1b), the ridge (25◦C isotherm at 850 hPa)
NHESSD
1, 3735–3762, 2013Flash-heat events in the Mediterranean
basin
J. Mazon et al.
Title Page
Abstract Introduction
Conclusions References
Tables Figures
◭ ◮
◭ ◮
Back Close
Full Screen / Esc
Printer-friendly Version Interactive Discussion
Discussion
P
a
per
|
D
iscussion
P
a
per
|
Discussion
P
a
per
|
Discuss
ion
P
a
per
to the southeast, displaced by a northeast advection. On the 28 August, at 00:00 UTC (see Fig. 1c), the border of the 25◦C isotherm at 850 hPa was displaced to the
south-east of the Iberian Peninsula. The 15◦C isotherm at 850 hPa approximately followed
the Pyrenees Mountains. On the 29 of August the northeast advection increased, with a 10◦C isotherm at 850 hPa at 00:00 UTC over the Pyrenees (not shown). Several 5
storms formed in the northeast Pyrenees during those days. In the south and south-east of the Iberian Peninsula, the heat wave continued, with temperatures between 20◦C and 25◦C at 850 hPa at the south and southeast until the 31 August 2010.
2.2 Analysis of surface observations
To avoid heat-island effect, data from the weather station installed at the Fabra
Obser-10
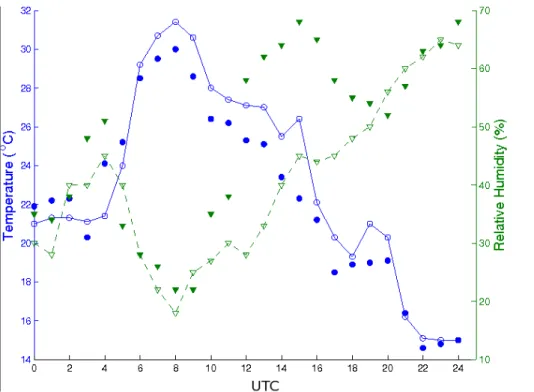
vatory, located 10 km away from the city center (420 m a.s.l.) was selected. Figure 2 shows the observed (closed symbols) temporal evolution during 27 August 2010 of temperature, relative humidity, wind speed and direction. Figure 2a shows that from approximately 06:00 to 12:00 UTC the temperature increased by about 2.3◦C h−1, from
nearly 22◦C at 05:00 UTC (a typical temperature value for this date and hour) to more 15
than 36◦C at 12:00 UTC. During this period the relative humidity dropped, from
ap-proximately 90 % at 05:00 UTC to 20 % at 12:00 UTC. From noon to 16:00 UTC the relative humidity changed slightly. However, the temperature increased between 12:00 and 15:00 UTC, reaching the fifth historically high temperature recorded since 1914 in this observatory, 38.3◦C, at 15:00 UTC. Until this hour wind direction (see Fig. 2b) 20
was approximately constant, around 270◦. Therefore, westerly wind advected extreme
warm and dry air mass from the inland of the Iberian Peninsula.
From approximately 15:00 UTC, a change in wind direction occurred and western flow was replaced by easterly winds which removed the warm and dry air mass, ad-vecting a relatively cold and wet Mediterranean air mass.This fact produced a decrease
25
in temperature and a rise in relative humidity that can be clearly observed in Fig. 2a. From 15:00 to 16:00 UTC, the temperature dropped from 37◦C to 28◦C, and relative
NHESSD
1, 3735–3762, 2013Flash-heat events in the Mediterranean
basin
J. Mazon et al.
Title Page
Abstract Introduction
Conclusions References
Tables Figures
◭ ◮
◭ ◮
Back Close
Full Screen / Esc
Printer-friendly Version Interactive Discussion
Discussion
P
a
per
|
D
iscussion
P
a
per
|
Discussion
P
a
per
|
Discuss
ion
P
a
per
|
period of the year for both temperature and relative humidity were recorded. Conse-quently, the change in wind direction clearly drove the evolution of temperature and relative humidity.
2.3 Mesoscale numerical simulation
In order to analyze the dynamics of the atmosphere that produced this rapid change
5
of temperature and relative humidity, the version 3.3 of the Advanced Research WRF– ARW (Skamarock et al., 2008) has been used. Four nested domains were defined with respective horizontal resolutions of 27, 9, 3 and 1 km. The smallest domain covers 70×70 km2. The initial and boundary conditions were updated every six hours with data
from the ECMWF operational analysis. The following parameterizations were used for
10
the different physical processes: the Kain–Fritsch scheme in the two larger domains; no parameterization of cumulus formation in the two smallest domains; the MRF scheme for processes in the mixed layer; a simple ice scheme for the cloud microphysics; and cloud–radiation parameterization for the radiation parameterization. The simulation be-gins on the 25 August 2010 at 00:00 UTC and finishes on the 28 at 18:00 UTC.
15
In order to validate the simulation, Fig. 2 also shows the WRF simulated temperature, relative humidity, wind speed and direction (line and open symbols) at the nearest point of the model to the Fabra weather station. Both simulated temperature and relative humidity fit well the observed values. However, some discrepancies can be noticed in the maximum values. The maximum simulated temperature is around 35◦C, almost 20
3◦C less than the observed value. In addition, at 05:00 and 06:00 UTC the simulated
temperature is around 3◦C higher than the observed one. Moreover, the simulated
relative humidity overestimates the observed value at 15:00 UTC. The simulated wind velocity and direction (not shown) also fit well the observations except the rapid change in wind direction recorded from 15:00 UTC that occurs slowly in the WRF simulation.
25
NHESSD
1, 3735–3762, 2013Flash-heat events in the Mediterranean
basin
J. Mazon et al.
Title Page
Abstract Introduction
Conclusions References
Tables Figures
◭ ◮
◭ ◮
Back Close
Full Screen / Esc
Printer-friendly Version Interactive Discussion
Discussion
P
a
per
|
D
iscussion
P
a
per
|
Discussion
P
a
per
|
Discuss
ion
P
a
per
air mass from the center and south of the Iberian Peninsula to the east and northeast region, where the maximum values of temperature were recorded on the 27 August.
Figure 3 shows the simulated 2 m temperature (color contour) and the surface wind field (arrows) at the largest domain on the 27 August 2010. West and southwest syn-optic flow advected warm and dry air mass from the center of the Iberian Peninsula
5
to the northeast coast. The simulated maximum temperatures at 10:00 UTC were lo-cated at the Mediterranean coast, with values of around 33–36◦C at the eastern and
southeastern area, and 30–33◦C at the northeastern area, in agreement with the
ob-served values by AEMET. During that day the intensity of the westerly flow prevented the formation of the sea breeze that usually helps to keep the temperature at
mod-10
erate values in this area. At 15:00 UTC (Fig. 3b) the westerly flow increased and the maximum recorded temperatures rose to 40◦C in many places of the coastline.
Ac-cording to the simulation, a northern advection affected the northern part of the Iberian Peninsula between 17:00 and 18:00 UTC. In this type of synoptic configuration, the flow turned northeast and east at the northeast coast of the Iberian Peninsula. At 18:00 UTC
15
(Fig. 3c) a relative cold and wet air mass from the northeast and east swept the warm and dry air mass, which cooled and moistened the air, decreasing the temperature to the usual values.
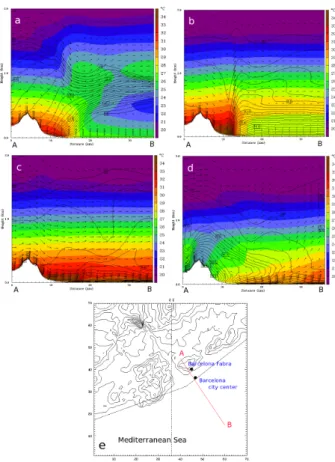
Figure 4a–d shows the vertical cross section of temperature and water vapor–mixing ratio along the line AB defined in Fig. 4e at different hours. At 10:00 UTC (Fig. 4a) a cold
20
and dry air mass from the southwest arrives at the Mediterranean coastline, which remains stationary for approximately 4 h (from 10:00 to 14:00 UTC). The relatively cold and wet Mediterranean air mass avoids the offshore displacement of the warm and dry air mass. Notice how in the boundary between both masses, the warm one rises vertically over the cold one. At 12:00 UTC (Fig. 4b) a large gradient in temperature
25
and humidity appears at the coastline of Barcelona. The simulated 2 m temperature reached more than 35◦C (see Fig. 4a) and the water vapor–mixing ratio lowered to
9 g kg−1. Around 10 km o
NHESSD
1, 3735–3762, 2013Flash-heat events in the Mediterranean
basin
J. Mazon et al.
Title Page
Abstract Introduction
Conclusions References
Tables Figures
◭ ◮
◭ ◮
Back Close
Full Screen / Esc
Printer-friendly Version Interactive Discussion
Discussion
P
a
per
|
D
iscussion
P
a
per
|
Discussion
P
a
per
|
Discuss
ion
P
a
per
|
accumulated warm air mass is estimated by looking at Fig. 4b, which is around 600 m. At 15:00 UTC (Fig. 4c) the warm air moves offshore and displaces the relatively cold and wet Mediterranean air mass. This situation changed from 18:00 UTC, as is shown in Fig. 4d. The north advection shown in Fig. 3c ruled to the east at the Barcelona area, moistening and cooling the air while mixing the different layers and breaking
5
the stratification. At 20:00 UTC (not shown) the maritime flow restored the values of temperature and relative humidity.
2.4 Flash–heat definition and occurrence
According to the evolution of temperature observed during 27 August 2010 at the Barcelona area, a definition of flash heat event is suggested. An event of rapid
in-10
crease of temperature could be considered as a flash heat if the following conditions are verified:
1. The maximum daily temperature (Tmax) exceeds at least by 5◦C the absolute
max-imum temperature (Tmax-abs) averaged during the considered month in the period
1960–1990 (Tmax>5+Tmax-abs). This criterion follows the definition of heat wave
15
by the WMO.
2. The temperature 24 h prior to and later than the extreme temperature recorded (T24) does not exceed the monthly average of the absolute maximum
temper-ature (T24< Tmax-abs). This criterion assures that the maximum temperature the
day before and after the maximum daily temperature recorded remains in
aver-20
age values.
3. The temperature 12 h prior to and after the extreme temperature recorded (T12)
NHESSD
1, 3735–3762, 2013Flash-heat events in the Mediterranean
basin
J. Mazon et al.
Title Page
Abstract Introduction
Conclusions References
Tables Figures
◭ ◮
◭ ◮
Back Close
Full Screen / Esc
Printer-friendly Version Interactive Discussion
Discussion
P
a
per
|
D
iscussion
P
a
per
|
Discussion
P
a
per
|
Discuss
ion
P
a
per
By using these criteria, Table 2 shows the Tmax, T24, and T12 for a flash-heat event during July and August by using the recorded values at Fabra weather station during the period 1961–1990.
According to these data, a flash-heat event occurs during these summer months if:
1. The maximum daily temperature exceeds 37.6◦C in July and 36.6◦C in August. 5
2. The temperature 24 h prior to and after the maximum daily-recorded temperature does not exceed 32.6◦C in July and 31.6◦C in August.
3. The temperature 12 h prior to and after the maximum–recorded temperature does not exceed 28.6◦C in July and 27.6◦C in August
To know the frequency of these types of events, the definition of a flash-heat event has
10
been applied to the daily temperature series of Barcelona starting from 1780. Although the series is not homogeneous (Mazon et al., 2011), a first approach to flash-heat events is possible by looking into a partial series of the daily temperature record. Table 3 shows some events detected as a flash heat during the XVIII and XIX centuries.
3 The 23 March 2008 event (Heraklion event)
15
The island of Crete, located at the middle-East part of the Mediterranean sea, near the north African coastline and consequently to the big Sahara desert, uses to be affected by advection of warm and dry air masses from the Sahara desert, also associated to intense dust events (Kaskaoutis et al., 2008; Fotiadi et al., 2006; Moulin et al., 1998). This advection produces an increase of temperature that only lasts several hours,
es-20
NHESSD
1, 3735–3762, 2013Flash-heat events in the Mediterranean
basin
J. Mazon et al.
Title Page
Abstract Introduction
Conclusions References
Tables Figures
◭ ◮
◭ ◮
Back Close
Full Screen / Esc
Printer-friendly Version Interactive Discussion
Discussion
P
a
per
|
D
iscussion
P
a
per
|
Discussion
P
a
per
|
Discuss
ion
P
a
per
|
3.1 Synoptic situation
On 21 March 2008 a low-pressure area was placed over the South of Greece, around 1005 hPa at sea-level (not shown). A southwesterly flew to the Island of Crete. On 22 March this low pressure moved to South Turkey. At sea level, a southeast flow affected Crete. Figure 5 shows the temperature at 850 hPa obtained by the NCEP reanalysis on
5
22, 23 and 24 March 2008 at 00:00 UTC. On 22 March (Fig. 5a) a warm air mass was located over North Africa. A ridge moved on 23 March to the north, affecting the whole island of Crete (Fig. 5b). On 24 March, the ridge moved out to the south (Fig. 5c).
3.2 Analysis of surface data
Data from the automatic weather station (39 m a.s.l., 35◦19′N; 25◦10′E) placed near 10
Heraklion is used to detect this flash-heat event, and to validate the mesoscale nu-merical simulation. Figure 6 shows the temporal evolution during 23 March 2008 of the observed temperature and relative humidity (closed symbols). During the early morning the observed temperature shows a large increase from 03:00 UTC, reaching 30.2◦C at
08:00 UTC. Relative humidity shows a large drop from 04:00 UTC, reaching the
min-15
imum value around 20 % at 08:00 UTC. From 10:00 UTC temperature decreases and relative humidity increases gradually.
3.3 Mesoscale numerical simulation
WRF mesoscale model has been used to analyze the dynamics of the atmosphere that produced this rapid change of temperature and relative humidity. Three nested
do-20
mains were defined with horizontal resolutions of 18, 6, and 2 km.The smallest domain covers 150×150 km2. ECMWF operational analysis was used to provide the initial and
NHESSD
1, 3735–3762, 2013Flash-heat events in the Mediterranean
basin
J. Mazon et al.
Title Page
Abstract Introduction
Conclusions References
Tables Figures
◭ ◮
◭ ◮
Back Close
Full Screen / Esc
Printer-friendly Version Interactive Discussion
Discussion
P
a
per
|
D
iscussion
P
a
per
|
Discussion
P
a
per
|
Discuss
ion
P
a
per
The simulation begins on the 22 March 2008 at 00:00 UTC and finishes on the 24 March at 18:00 UTC.
The simulated evolution of 2 m temperature (blue line and open circles) and relative humidity (green dashed line and open triangles) at the nearest point of the model to the Heraklion weather station is also shown in Fig. 6. A slight overestimation of
tempera-5
ture in the simulation is observed with respect the observations (around 2◦C) between
07:00 to 16:00 UTC. However, the simulated relative humidity shows a remarkable dif-ference to the recorded values, especially from 11:00 to 19:00 UTC. While the recorded values of relative humidity between 11:00 and 17:00 UTC are around 70 %, the simu-lated values are lower than 50 %.
10
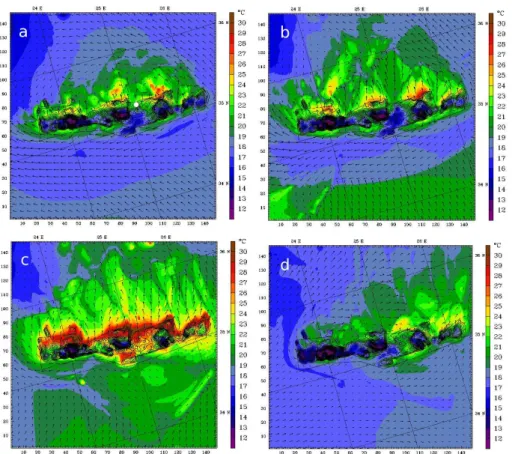
Figure 7 shows the simulated 2 m temperature (color contours) and surface wind field (arrows) at the smallest domain at several hours on 23 March 2008. At 00:00 UTC (Fig. 7a) the simulation shows a southeasterly flow over the south coast of Crete, where the temperature was around 17◦C. However, at the north side a higher temperature,
between 24◦C and 28◦C is simulated. At 04:00 UTC (Fig. 7b) the southeasterly wind 15
ruled to southerly; the warm and dry air mass associated to the North Africa advec-tion, that can be considered as a warm front, lifted over the relatively cold sea air at around 70 km offshore the south coastline of the island. Consequently, the temperature remained around 17◦C in the south coastline of the island. This large thermal di
ff er-ence between both faces is even larger at 08:00 UTC (Fig. 7c), when the simulated
20
temperature shows the higher values at the north face, around 31◦C (at the south face
the temperature remained between 20 and 23◦C). From 11:00 UTC the temperature
began to decrease. As shown in Fig. 7d, during the afternoon the temperature shows normal values in both sides of the island.
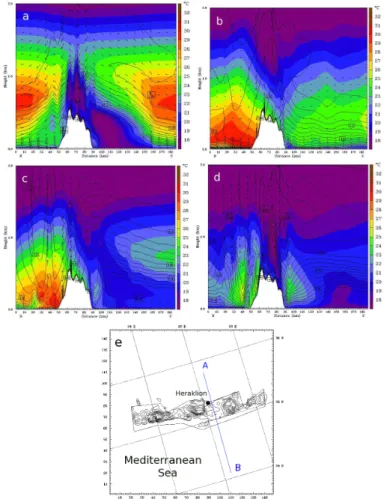
Figure 8a–d shows the temperature and water vapor–mixing ratio along the line AB
25
NHESSD
1, 3735–3762, 2013Flash-heat events in the Mediterranean
basin
J. Mazon et al.
Title Page
Abstract Introduction
Conclusions References
Tables Figures
◭ ◮
◭ ◮
Back Close
Full Screen / Esc
Printer-friendly Version Interactive Discussion
Discussion
P
a
per
|
D
iscussion
P
a
per
|
Discussion
P
a
per
|
Discuss
ion
P
a
per
|
sea air. However, at the north part the temperature increases, reaching 25◦C at many
areas due to strong descending air not associated to a Foehn effect. The warming at the north coast of the island is associated to an air mass with the same characteris-tics of the African air mass that descends (vertical wind speed at the north side was around−1 m s−1) once the colder Mediterranean air mass located at the south coast is 5
overpassed. For this reason this air mass only affects the north part of the island. Thermal difference between the north and the south coasts of the island increased in the coming hours. At 07:00 UTC (Fig. 8b) the simulated temperature reaches 31◦C at
Heraklion (north side) while at the south side the temperature remained around 20◦C.
The largest value in the thermal difference between the north and the south sides
10
of the island occurred around 10:00 UTC (Fig. 8c). The simulated temperature at the north side reaches 31.8◦C at sea level, with 4.5 g kg−1of water vapor–mixing ratio. At
the south side, the air temperature reaches 21.3◦C and around 9 g kg−1 in the water
vapor–mixing ratio. A change in the wind direction from 14:00 UTC restored the normal values for both temperature and relative humidity. At 16:00 UTC (Fig. 8d) the simulated
15
temperature and water vapor–mixing ratio at both coasts are similar, around 22◦C and
9 g kg−1, respectively.
4 Potential risk and impacts of flash heats
Flash-heat events, a rapid increase of temperature, which lasts less than 2 consecutive days, could be associated with a variety of harm to human health, economic activities,
20
and the environment.
According to data from the main Spanish electric company (Endesa), at midday on 27 of August 2010, a new record in electricity consumption was recorded; during few hours around 38 000 MW were required in the whole country. The day before and after, consumption did not reach 23 000 MW. The power network was working at 64 % over
25
NHESSD
1, 3735–3762, 2013Flash-heat events in the Mediterranean
basin
J. Mazon et al.
Title Page
Abstract Introduction
Conclusions References
Tables Figures
◭ ◮
◭ ◮
Back Close
Full Screen / Esc
Printer-friendly Version Interactive Discussion
Discussion
P
a
per
|
D
iscussion
P
a
per
|
Discussion
P
a
per
|
Discuss
ion
P
a
per
Moreover, most of the big wild fires in the Mediterranean are produced by a combina-tion of high temperature and low relative humidity (Millan et al., 1998). Consequently, flash-heat events are likely to be one of the main risks in triggering wild fires because the drop in relative humidity and increase in temperature contribute to drying the veg-etation.
5
Probably one of the most affected sectors during a flash-heat event is agriculture. Un-like what happens during a heat wave, when temperature and relative humidity changes slowly gradually and some measures (e. g. to irrigate to decrease water stress) can be taken in order to avoid its impact, during a flash heat the changes are more abruptly. For instance, during the flash-heat event on 27 August 2010 several regions in the
north-10
east of the Iberian Peninsula lost around the 20 % of their grape production. Grapes are very sensitive to a sudden increase in temperature and drop in relative humidity, causing the fruit to lose a lot of internal water. After the event, the process cannot be restored and the production of wine is greatly disturbed in the quantity as well as the quality of wines (personal communication with the Torres wine company).
15
5 Conclusions
According to WMO and AMETSOC, as well as several national weather services, heat wave is defined as an abnormal period of higher temperatures over 2 or more days. In addition, AMETSOC defines a heat burst as a rapid increase in temperature that takes place over a period of minutes, usually associated to downstream flows occurring
20
during storms or because of local Foehn effects. Thus, the events described in this paper are not a heat wave or burst. We propose to name this type of events flash heat. The first analyzed flash heat occurred on 27 August 2010 at the northeast area of the Iberian Peninsula due to a rapid and sudden advection of a warm and dry air mass from the North Africa that affected this area for around 12 h. The analysis of data from
auto-25
NHESSD
1, 3735–3762, 2013Flash-heat events in the Mediterranean
basin
J. Mazon et al.
Title Page
Abstract Introduction
Conclusions References
Tables Figures
◭ ◮
◭ ◮
Back Close
Full Screen / Esc
Printer-friendly Version Interactive Discussion
Discussion
P
a
per
|
D
iscussion
P
a
per
|
Discussion
P
a
per
|
Discuss
ion
P
a
per
|
13:00 UTC the temperature reached the maximum value, 39.3◦C, at the city center and
38.3◦C at the Fabra Observatory. The relative humidity decreased to 19 % at the city
center and around 22 % at the Fabra Observatory. From 15:00 UTC the temperature decreased; and at 18:00 UTC it was less than 24◦C, i.e., within normal values for this
season and time of the day.
5
WRF simulation shows a westerly flow over the Iberian Peninsula that advects warm and dry air over the Mediterranean coast, where the maximum temperature is simu-lated and in agreement with the observed values. This advection disappears at the northeast of the Iberian Peninsula and is replaced by an easterly flow that advects a relatively cold and wet air mass as it displaces the warm and dry mass onshore.
10
Applying the preliminary definition of flash heat to the historical temperature data series of Barcelona, we found that in the XIX century at least 13 episodes could be identified as flash heats.
The second analyzed event occurred on 23 March 2008 at the north face of the island of Crete. A rapid increase of temperature in Heraklion, a city located at the north coast
15
of the island, caused by a strong downward flow, that keeps the characteristics of an air mass advected from Africa, has been studied and simulated. During almost 8 h the tem-perature reaches higher than average values, and relative humidity show unexpected low values. These recorded larger temperatures are due to the lift of a warm and dry African air mass caused by a colder Mediterranean air mass located at the south coast
20
of Crete. This fact and the mountain waves that appeared due to the orography pro-duce that the warm air mass only affected the north side of the island producing a large temperature difference between both coasts. From approximately 00:00 to 11:00 UTC on 23 March 2008 the temperature at Heraklion, and all over the north coast of the island reached more than 30◦C. From noon and early afternoon, when the southerly 25
flow disappeared and ruled to easterly and southeasterly, the temperature decreased having usual values for this period of the year.
NHESSD
1, 3735–3762, 2013Flash-heat events in the Mediterranean
basin
J. Mazon et al.
Title Page
Abstract Introduction
Conclusions References
Tables Figures
◭ ◮
◭ ◮
Back Close
Full Screen / Esc
Printer-friendly Version Interactive Discussion
Discussion
P
a
per
|
D
iscussion
P
a
per
|
Discussion
P
a
per
|
Discuss
ion
P
a
per
Acknowledgements. This project has been carried out by using the resources of the Supercom-puting Center of Catalonia (CESCA) and it has been funded by the Spanish projects CGL2009-08609 and CGL2012-37416-C04-03. The NCEP images are from www.wetterzentrale.de. Ob-servational data was provided by MeteoCat, AEMET and the Hellenic National Meteorological Service. We are also grateful to P. Nastos from the University of Athens for his helpful com-5
ments.
References
Egger, J. and Hoinka, K. P.: Fronts and orography, Meteor. Atmos. Phys., 48, 3–36, 1992. 3738 Fotiadi, A., Hatzianastassiou, N., Drakakis, E., Matsoukas, C., Pavlakis, K. G., Hatzidim-itriou, D., Gerasopoulos, E., Mihalopoulos, N., and Vardavas, I.: Aerosol physical and optical 10
properties in the Eastern Mediterranean Basin, Crete, from Aerosol Robotic Network data, Atmos. Chem. Phys., 6, 5399–5413, doi:10.5194/acp-6-5399-2006, 2006. 3744
Frich, A., Alexander, L. V., Della-Marta, P., Gleason, N., Haylock, M., Klein Tank, A. M. G., and Peterson, T.: Observed coherent changes in climatic extremes during the second half of the twentieth century, Climate Res., 19, 193–212, 2012. 3736
15
Glickman, T. S.: Glossary of Meteorology, 2nd Edn., American Meteorological Society, 2000. 3736, 3737
Hamilton, J. M., Maddison, D. J., and Tol, R. S. J.: Climate change and international tourism: a simulation study, Global Environ. Change, 15, 253–266, 2005. 3737
Hassid, S., Santamourins, M., Linardi, A., Klitsikas, N., Georgakis, C., and Assi-20
makopoulus, D. N.: The effect of the Athens heat island on air conditioning load, J. Energy Build., 32, 131–141, 2000. 3737
Johnson, B. C.: The heat burst of 29 May 1976, Mon. Weather Rev., 111, 1776–1792, 1976. 3737
Jolly, W., Dobbertin, M., Zimmermann, N. E., and Reichstein, M.: Divergent vegetation growth 25
responses to the 2003 heat wave in the Swiss Alps, Geophys. Res. Lett., 32, 18409–18418, 2005. 3737
NHESSD
1, 3735–3762, 2013Flash-heat events in the Mediterranean
basin
J. Mazon et al.
Title Page
Abstract Introduction
Conclusions References
Tables Figures
◭ ◮
◭ ◮
Back Close
Full Screen / Esc
Printer-friendly Version Interactive Discussion
Discussion
P
a
per
|
D
iscussion
P
a
per
|
Discussion
P
a
per
|
Discuss
ion
P
a
per
|
Kaskaoutis, D. G., Kambezidis, H. D., Nastos, P. T., and Kosmopoulos, P. G.: Study on an intense dust storm over Greece, Atmos. Environ., 42, 6884–6896, 2008. 3744
Lise, W. and Tol, R. S. J.: Impact of climate on tourism demand, Clim. Change, 55, 429–449, 2002. 3737
Maninns, P. C. and Sawford, B. L.: A model of katabatic wind, J. Atmos. Res., 36, 619–630, 5
1979. 3738
Mazon, J., Barriendos, M., Prohom, M., Rodríguez, R., Blanch, A., and Ripoll, R.: Reconstruc-tion of long temperature series of Barcelona, in: 11th EMS Annual Meeting, Berlin (Ger-many), 2011. 3744
Meehl, G. A. and Tebald, C.: More intense, more frequent and longer lasting heat waves in the 10
21st century, Science, 13, 994–997, 2004. 3737
Millan, M. M., Estrella, M. J., and Badenas, C.: Meteorological processes relevant to forest fire dynamics on the Spanish Mediterranean coast, J. Appl. Meteorol., 37, 83–100, 1998. 3748 Moulin, C., Lambert, C. E., and Dayan, U.: Satellite climatology of African dust transport in
Mediterranean atmosphere, J. Geophys. Res., 103, 13137–13144, 1998. 3744 15
Orlanski, I.: A rational subdivision of scales for atmospheric processes, B. Am. Meteorol. Soc., 56, 527–530, 1975. 3752
Skamarock, W. C., Klemp, J. B., Dudhia, J., Gill, D. O., and Barker, D. M.: A description of the Advanced Research WRF Version 3, Tech. Rep. TN-475+STR, NCAR, 2008. 3741
Smoyer-Tomic, K. E., Khun, R., and Hudson, A.: Heat wave hazards: an overview of heat waves 20
impacts in Canada, Nat. Hazards, 28, 465–486, 2003. 3737
Steadman, R. G.: A universal scale of apparent temperature, J. Clim. Appl. Meteorol., 23, 1674– 1687, 1984. 3737
Trenberth, K. E., Jones, P. D., Ambenje, P., Bojariu, R., Easterling, D. Klein Tank, A., Parker, D., Rahimzadeh, F., Renwick, J. A., Rusticucci, M., Soden, B., and Zhai, P.: Observations: sur-25
face and atmospheric climate change, in: Contribution of Working Group I to the Fourth Assessment Report of the Intergovernmental Panel on Climate Change, 2007, edited by: Solomon, S., Qin, D., Manning, M., Chen, Z. Marquis, M., Averyt, K. B. M. T., and Miller, H. L., Cambridge University Press, Cambridge, UK and New York, NY, USA, 2007. 3737
Wakonigg, H.: The north foehn in the south-eastern Alpine border zone, Mitt. Oesterr. Geol. 30
NHESSD
1, 3735–3762, 2013Flash-heat events in the Mediterranean
basin
J. Mazon et al.
Title Page
Abstract Introduction
Conclusions References
Tables Figures
◭ ◮
◭ ◮
Back Close
Full Screen / Esc
Printer-friendly Version Interactive Discussion
Discussion
P
a
per
|
D
iscussion
P
a
per
|
Discussion
P
a
per
|
Discuss
ion
P
a
per
Table 1.Three different scales of events linked to abnormal high temperatures. The scales are adapted from Orlanski (1975).
Event Temporal scale Spatial scale Driving mechanism Heat wave From 2 to few weeks Meso-α(200–2000 km) General atmospheric circulation Heat burst Few minutes Micro-β,γ(<2 km) Thunderstorms
NHESSD
1, 3735–3762, 2013Flash-heat events in the Mediterranean
basin
J. Mazon et al.
Title Page
Abstract Introduction
Conclusions References
Tables Figures
◭ ◮
◭ ◮
Back Close
Full Screen / Esc
Printer-friendly Version Interactive Discussion
Discussion
P
a
per
|
D
iscussion
P
a
per
|
Discussion
P
a
per
|
Discuss
ion
P
a
per
|
Table 2.Values of the average of the absolute maximum temperature, the average of the max-imum monthly temperature and the 60th percentile of the average of the maxmax-imum monthly temperature recorded during the period 1961–1990 at the Barcelona–Fabra weather station (Barcelona).
Month Tmax-abs(◦C) T
max(◦C) p60Tmax(◦C)
Jul 32.6 27.6 28.6
NHESSD
1, 3735–3762, 2013Flash-heat events in the Mediterranean
basin
J. Mazon et al.
Title Page
Abstract Introduction
Conclusions References
Tables Figures
◭ ◮
◭ ◮
Back Close
Full Screen / Esc
Printer-friendly Version Interactive Discussion
Discussion
P
a
per
|
D
iscussion
P
a
per
|
Discussion
P
a
per
|
Discuss
ion
P
a
per
Table 3.Most significant flash-heat episodes affecting Barcelona since 1780. Note that on 27 August 2010, the maximum temperature was 39.3◦C (24◦C in the early morning and 26◦C
in the evening). T12− and T12+ indicate the temperature 12 h before and after the maximum temperature recorded (Tmax), respectively.
Date Tmax(◦C) T
12− (
◦C) T
12+ (◦C) Wind direction
1 Jul 1790 36 23.5 25 SW
10 Jul 1820 34.4 21 26.5 SW
27 Jul 1843 35.5 23.5 24 SSW–SW
5 Aug 1846 35.5 26 27 S
15 Jul 1859 35 27 26 SSW–SW
17 Aug 1881 35.5 25 26 SSW
NHESSD
1, 3735–3762, 2013Flash-heat events in the Mediterranean
basin
J. Mazon et al.
Title Page
Abstract Introduction
Conclusions References
Tables Figures
◭ ◮
◭ ◮
Back Close
Full Screen / Esc
Printer-friendly Version Interactive Discussion
Discussion
P
a
per
|
D
iscussion
P
a
per
|
Discussion
P
a
per
|
Discuss
ion
P
a
per
|
Fig. 1.Temperature at 850 hPa (in◦C) obtained by the NCEP reanalysis at 00:00 UTC on(a)26,
NHESSD
1, 3735–3762, 2013Flash-heat events in the Mediterranean
basin
J. Mazon et al.
Title Page
Abstract Introduction
Conclusions References
Tables Figures
◭ ◮
◭ ◮
Back Close
Full Screen / Esc
Printer-friendly Version Interactive Discussion
Discussion
P
a
per
|
D
iscussion
P
a
per
|
Discussion
P
a
per
|
Discuss
ion
P
a
per
|
NHESSD
1, 3735–3762, 2013Flash-heat events in the Mediterranean
basin
J. Mazon et al.
Title Page
Abstract Introduction
Conclusions References
Tables Figures
◭ ◮
◭ ◮
Back Close
Full Screen / Esc
Printer-friendly Version Interactive Discussion
Discussion
P
a
per
|
D
iscussion
P
a
per
|
Discussion
P
a
per
|
Discuss
ion
P
a
per
|
Fig. 5.Temperature at 850 hPa (in◦C) obtained by the NCEP reanalysis at 00:00 UTC on(a)22,
NHESSD
1, 3735–3762, 2013Flash-heat events in the Mediterranean
basin
J. Mazon et al.
Title Page
Abstract Introduction
Conclusions References
Tables Figures
◭ ◮
◭ ◮
Back Close
Full Screen / Esc
Printer-friendly Version Interactive Discussion
Discussion
P
a
per
|
D
iscussion
P
a
per
|
Discussion
P
a
per
|
Discuss
ion
P
a
per
|
NHESSD
1, 3735–3762, 2013Flash-heat events in the Mediterranean
basin
J. Mazon et al.
Title Page
Abstract Introduction
Conclusions References
Tables Figures
◭ ◮
◭ ◮
Back Close
Full Screen / Esc
Printer-friendly Version Interactive Discussion
Discussion
P
a
per
|
D
iscussion
P
a
per
|
Discussion
P
a
per
|
Discuss
ion
P
a
per