www.biogeosciences.net/11/3107/2014/ doi:10.5194/bg-11-3107-2014
© Author(s) 2014. CC Attribution 3.0 License.
Vertical and lateral flux on the continental slope off Pakistan:
correlation of sediment core and trap results
H. Schulz1,*and U. von Rad2,*
1Fachbereich für Geowissenschaften, Paleobiology, University of Tübingen, Hölderlinstr. 12, 72074 Tübingen, Germany 2Rosenstraße 19c, 30916 Isernhagen, Germany
*formerly at: Bundesanstalt für Geowissenschaften und Rohstoffe (BGR), PF 510153, 30631 Hannover, Germany
Correspondence to:H. Schulz ([email protected])
Received: 13 May 2013 – Published in Biogeosciences Discuss.: 23 July 2013 Revised: 27 March 2014 – Accepted: 12 April 2014 – Published: 16 June 2014
Abstract. Due to the lack of bioturbation, the
varve-laminated muds from the oxygen minimum zone (OMZ) off Pakistan provide a unique opportunity to precisely determine the vertical and lateral sediment fluxes in the nearshore part of the northeastern Arabian Sea. West of Karachi (Hab area), the results of two sediment trap stations (EPT and WPT) were correlated with 16 short sediment cores on a depth tran-sect crossing the OMZ. The top of a distinct, either reddish-or light-gray silt layer, 210Pb-dated as AD 1905±10, was
used as an isochronous stratigraphic marker bed to calcu-late sediment accumulation rates. In one core, the red and gray layer were separated by a few (5–10) thin laminae. Ac-cording to our varve model, this contributes < 10 years to the dating uncertainty, assuming that the different layers are al-most synchronous. We directly compared the accumulation rates with the flux rates from the sediment traps that col-lected the settling material within the water column above. All traps on the steep Makran continental slope show excep-tionally high, pulsed winter fluxes of up to 5000 mg m−2d−1. Based on core results, the flux at the seafloor amounts to 4000 mg m−2d−1and agrees remarkably well with the bulk
winter flux of material, as well as with the flux of the individ-ual bulk components of organic carbon, calcium carbonate and opal. However, due to the extreme mass of remobilized matter, the high winter flux events exceeded the capacity of the shallow traps. Based on our comparisons, we argue that high-flux events must occur regularly during winter within the upper OMZ off Pakistan to explain the high accumula-tions rates. These show distribution patterns that are a neg-ative function of water depth and distance from the shelf. Some of the sediment fractions show marked shifts in
ac-cumulation rates near the lower boundary of the OMZ. For instance, the flux of benthic foraminifera is lowered but sta-ble below∼1200–1300 m. However, flux and sedimentation
in the upper eastern Makran area are dominated by the large amount of laterally advected fine-grained material and by the pulsed nature of the resuspension events at the upper margin during winter.
1 Introduction
About 1 million km3of shelf and slope waters of the global ocean are found to be permanently hypoxic, with more than half of that volume in the Indian Ocean (Helly and Levin, 2004). After the pioneering study of von Stackelberg (1972) on the sedimentation along the Indian–Pakistan margin of the northern Arabian Sea, numerous campaigns and initiatives revealed the key role of the organic-rich, laminated sediments in studying the linkages between the production, pathways and preservation of marine organic matter under low bottom-water oxygen conditions (Paropkari et al., 1992; Pedersen et al., 1992; Calvert et al., 1995; Cowie et al., 1999; Keil and Cowie, 1999; van der Weijden et al., 1999; von Rad et al., 1999; Schulte et al., 2000; Suthhof et al., 2000; Cowie, 2005; Wiggert et al., 2005; Cowie and Levin, 2009).
KARACHI Hingol River Porali R. Hab River 66°E 25°N 24°N 67°E 85 35 158 142 79 64 39 44 1 2 3 4 65 42 54 46 144 72 69 14376 58 53
EPT
Oman Abyssal Plain
WPT
Basul R.r 64°E
A
C
0 500 1000 1500 2000 2500 3000 158 64 66 1 42 44 53 76 143 46 14479 54 85 39 72 2345 6 69 142 EPT WPTOMZ
155 35 58B
51 66 shallow deep Makran Indu s m w.d.Figure 1.Investigation area in the northwestern Indian Ocean off Pakistan.(A)Arabian Sea with Makran and Indus continental
mar-gins.(B)Position of sediment trap deployments and sediment sta-tions (“Hab area” W of the Hab river) from two oceanographic cruises,SONNE90 (numbers 35 onward) andMETEOR32/2
(num-bers 1–6). Most sites are distributed below the narrow Makran shelf to the northeast and some down the broader Indus margin to the southeast. (C)Idealized transect “Hab transect” of sediment
sta-tions between 92 and 2881 m with sediment traps EPT and WPT. Distance between traps is∼20 km. Stippled area is the oxygen min-imum zone, OMZ.
decomposition of organic matter within the water column and on the seafloor. High surface water primary productivity and organic matter flux is triggered by the strength and di-rection of the seasonally reversing summer (southwest) and winter (northeast) monsoonal circulation, and may also de-pend on fluvial and eolian terrigenous input (Sirocko and Sarnthein, 1989; Ramaswamy et al., 1991). Vertical fluxes in the open oceanic environment in the western Arabian Sea were intensely studied by means of time series of moored and drifting sediment traps (Haake et al, 1993; Nair et al., 1989; Rixen et al., 1999; Pollehne et al., 1993). In contrast, our knowledge on the scales and seasonal timings of the marine biogenic and terrigenous fluxes on the steep margin zones of the northern Arabian Sea is still fragmentary.
The sediments along the continental slope off Pakistan (Fig. 1a) are characterized by a distinct lamination due to suppressed bioturbation (von Stackelberg, 1972). However, the hypoxic bottom water conditions preventing the sediment from being mixed by burrowing organisms may be only one important factor for the preservation of laminae. Exception-ally high sedimentation of more than 1 mm per year, linked to the high lateral fluxes of remobilized terrigenous and ma-rine matter, was observed off the active, steep Makran mar-gin off western Pakistan (Schulz et al., 1996; Andruleit et al., 2000; Lückge et al., 2002; Schulz et al., 2002; von Rad et al., 2002a, b). Thus, high fluxes and sediment redistribution may also contribute to the preservation of sediment lamina-tion. However, comparable laminations are not observed off India, where slope sedimentation rates can be as high, nor are they off Oman, where slopes are also steep (Paropkari et al.,
1992). But sediment laminations are also found off the In-dus Delta, where sedimentation rates are lower and the slope is less steep (Cowie et al., 1999). From sedimentary models of varve formation and from simple mass calculations, we may expect a significant contribution of fine-grained, remo-bilized matter to the steep continental slope from the narrow shelf areas nearby. This adds also to the particle flux derived from local biological productivity and thus complicates the identification of the sediment sources and processes. Also, MODIS satellite images show examples of distinct sediment plumes extending from the coastal zone offshore (Bourget et al., 2010). These plumes might also contribute to the forma-tion of the winter sediment laminae.
The cores from the steep Hab area west of Karachi (Fig. 1b) host the most distinct sediment laminae on millime-ter to sub-millimemillime-ter scales (von Rad et al., 1999; 2002b). The distinct nature of the varved sediments along the steep Makran is dominated by a high fraction of lithic compo-nents. For at least the past 5000 years, there has been a con-tinuous deposition of annual laminae couplets, which point to a strong seasonality in the amount and composition of material settling to the seafloor (von Rad et al., 1999). Mi-croscopic analyses of thin sections show distinct alterna-tions of dark-colored, organic-carbon-rich and light-colored, organic-carbon-poor terrigenous laminae, which suggest a cyclic pattern due to changes in the flux and composition dur-ing summer and winter (Berger and von Rad, 2002; Lückge et al., 2002). Cores from the less steep Indus Pakistan mar-gin, situated to the southeast and distant from the Makran, are characterized by a more regular pattern in lamina thickness.
Quantitative flux estimates are needed to better describe the complex sedimentation processes in the water column and on the seafloor at the continental margin off Pakistan. However, direct observations of the summer and winter sit-uations are missing to corroborate the formation of the sed-iment laminae and the transfer of sedsed-iments to the deep sea. Four sediment trap moorings in eastern Pakistan (EPT) and western Pakistan (WPT) (Fig. 1) have been deployed within and below the OMZ off Pakistan. However, the flux estimates from these traps were only fragmentary and showed strong, unexpected temporal and spatial variability. None of the four traps in 1993/1994 and 1995/1996 sampled the full year as planned. All traps stopped collecting in the winter season, three of four traps presumably due to a huge flux of mat-ter remobilized on the upper margin (von Rad et al., 1995; Andruleit et al., 2000; Schulz et al., 2002; von Rad et al., 2002b). The reason for these flux events recorded in the traps and their role in the sedimentation off Pakistan is poorly con-strained.
In the present study, we focus on the quantification of sediments accumulated along a depth transect in the Hab area (Fig. 1) between∼200 and∼2000 m water depth, and
surface water productivity can be used to quantitatively better describe the local flux of organic carbon at a certain depth de-rived from primary production (Sarnthein et al., 1992). How-ever, this approach may not be valid in the near-coastal envi-ronment, where lateral fluxes are high and may be temporally dominant. To better determine their role, we will focus on possible differences in the amount and preservation of bulk fractions of biogenic and mineral matter found above, in the center and below the OMZ. The concentration and accumu-lation of the major sand-sized components preserved along our core transect across the OMZ will be used to provide ad-ditional information.
2 Geologic setting and previous geological
investigations
The study area on the continental margin of Pakistan in the northeastern Arabian Sea represents a restricted area between the narrow active Makran margin to the northwest and the Indus margin to the southeast (Fig. 1a), where the broad shelf is typical for the passive Indian margin (Fig. 1a).
The “Hab area” (Fig. 1b) is characterized by the three tectono-sedimentologic settings: (1) to the north the accre-tionary complex covered by thick uplifted wedges and sedi-ment prisms that is part of the steep Makran margin (stations 39, 53), (2) a lower accretionary wedge zone with rather reg-ular topography on vertical scales of some 100 m (stations 1, 35, 58–158) and (3) a more gentle NE slope of the Murray Ridge to the southeast that was formed by large blocks of slumped sediments (stations 2–6, 42–46, 54). The Hab area is drained by deep, mostly ENE–WSW-trending channels.
In the near-surface sections of 16 box cores and 6 mul-ticores, up to 12 cm thick reddish- or gray-whitish-colored silty-clay layers were identified (Staubwasser and Sirocko, 2001). Based on the strong visual contrast of both layer types to the over- and underlying laminated sediment (Fig. 2), these thick layers can be traced over large overlapping ar-eas, possibly covering some 1000 and 600 km2, respectively. Most cores show either the red or the gray-whitish layer. The red layer is found more on the Makran side, to the north of the ENE–WSW-trending channels. All laminatedSONNE
cores (except station 35 at 416 m) showed a distinct reddish-colored silt layer that can be regarded as a silt turbidite, sometimes with fining upward or indistinct internal lami-nations (Schulz et al., 1996). In contrast, the gray-whitish layer is observed more to the southeast on the Indus side, at shallower depths (stations 2–6; see also supplementary on-line material), but not at all sites: cores 44 KG and 42 KG are more similar to the Makran cores (Staubwasser and Sirocko, 2001). In core 58 KG (Fig. 2d) presumably both types of lay-ers were found, with the reddish-colored layer (∼13–22 cm)
above the whitish one (∼22.5–25.5 cm). The whitish layer is
separated from the red layer by 5–10 thin sediment laminae. The two types of fine-grained clastic sediment appear to be
Varve Thickness
(mm) Age (Varve Years A.D.)
SO90-39KG (24°50.0’N, 65°55.0’E, 704m w.d.)
0.40 0.60 0.80 1.00 1.20 0
5 10 15 20 25 30 35 40 45
Dry Bulk Density
(g cm-3) 0.1 1.0 10.0 100.0 2000 1900 1800 1700
Sediment Lightness
L*a*b*-Scale Fraction (%) Sand Dry Bulk Density (g cm-3) CaCO (%)3 OC (%)
M32-2MC5 (24°38.4’N 66°02.9’E, 386m w.d.)
b)
35 40 45 50 0 1 2 3 4 0.4 0.6 0.8 1.0 1.2 10 15 20 0 1 2 3turbidite laminated
a)
0
5
10
15
20
25
30
>1950 AD
664+28
705+27
-Core depth (cm)
Core depth (cm)
M32-2MC3 23°37.9’N 66°04.6’E, 247m w.d.)
Sediment Lightness
L*a*b*-Scale Sand Dry Bulk Density (%)CaCO3 OC (%)
40 45 50 0 1 2 3 4Fraction (%) 0.4 0.6 0.8 1.0 1.2 10 15 20 25 0 1 2 3 (g cm-3)
bioturbated turbidite
laminated
c)
0 5 10 15 20 25 301900 1950 2000
0.2 0.4 0.6 0.8 1.0 -2.0 -1.0 0.0 1.0 10.0 2000 1950 1900
SO90-58KG (24°46.6’N 65°49.2’E, 876m w.d.)
d)
0 5 10 15 20 25 30
Sediment Color/Red-Channel L*a*b*-Scale Dry Bulk Density
(g cm-3) Varve Thickness (mm) Age (Varve Years A.D.)
Age (Years AD) Pb-Dating
Core depth (cm)
Core depth (cm)
Figure 2.Examples from four short sediment cores along the
very similar in their elemental ratios, as well as in their bulk organic carbon and calcium carbonate contents (Staubwasser and Sirocko, 2001, unpublished data). The type of reddish-colored sediment also occurs in up to a few centimeter-thick intervals in the longer piston and long box cores of the area, interpreted to represent an episodic redeposition of fluvial matter from the Indus shelf, possibly linked to strong rain-fall or floods in the hinterland (Schulz et al., 1996; von Rad et al., 2002a). Staubwasser and Sirocko (2001) investigated the light-gray clastic sediment in more detail and concluded that these might consist of material expelled by mud volca-noes from the active Makran margin. In contrast von Rad et al. (2002a) argued that the distinct light-gray to whitish layers are explained as “plume deposits” transporting mud-charged suspensions across the narrow shelf to the slope.
No additional, similarly thick layers are observed further downcore in the longer Holocene records from the Hab area. By establishing the stratigraphic position of the turbidite and plume sedimentation events, the unique event layers, in-terbedded between laminated sediment, could be ideally used as stratigraphic marker beds for correlation of the short cores. The described layers were sampled again bySONNEcruise
130 in the Hab area by the following box cores (KG) and multicores (MC): 268 MC, 605 m; 276 KG, 780 m; 262 MC, 875 m; and 291 MC, 902 m water depth. In cores 262 MC and 291 MC from the same area as 58 KG, the red and whitish layers were found on top of each other again, questioning their exact synchronism.
3 Material and methods
3.1 Sediments and accumulation rates
Twenty box cores (KG) and 6 multicores (MC) (short gravity cores of ∼10–50 cm length) were taken in 1993
during SONNE cruise SO 90 and in 1995 during ME-TEORcruise M32/2, respectively, and recovered undisturbed
top sediments from water depths between 96 and 2881 m. The organic carbon (OC), calcium carbonate (CaCO3)and opal concentrations were determined following Dietrich and Marchig (1995) and Suthhof et al. (2000). The composi-tion of the coarse fraccomposi-tion larger than 150 microns (µm) in core top samples was counted from a few milliliters of freeze-dried sediment of the top centimeter washed through a 63 µm mesh. The residue was dried at 60◦C and sieved into
sub-fractions of 63–150, 150–200, 200–250, 250–315, 315– 400 and > 400 µm, respectively. Splits of at least 70 grains from the fractions > 150 µm were obtained with an Otto mi-crosplitter for each sample. In these splits all grains were identified following the categories (1) inorganic compounds (Inorg.: quartz, mica, oxides, lithic grains), (2) megafossils (Megaf.: sponge spicules, ophiurid remains, pteropods, fish debris, etc.), (3) siliceous tests (Silic.: large radiolarians, diatoms, silicoflagellates), (4) planktic foraminiferal debris
(P.F. debris), (5) intact planktic foraminiferal tests (P.F.) and (6) benthic foraminifera (B.F.). The six categories represent more than 95 % of the > 150 µm size fraction. They were used to better characterize the texture and composition of the surface sediment and to identify possible remobilization of sand-sized particles across the steep margin. For exam-ple, potential disturbances of the fluffy top layer could be de-duced from coarse fractions. Increased numbers of the lithic fractions would indicate mass flows or sediment winnow-ing. Further, calcite dissolution or corrosion at certain depth may be identified by an increased fragmentation of planktic foraminiferal shells.
Profiles of sedimentγ-ray attenuation were analyzed at 0.5 cm intervals using a GEOTEC-multisensor core logger (Schultheiß and Weaver, 1992). Discrete samples were taken at 1–2.5 cm intervals by 10 cm3syringes or from sliced sed-iment profiles in order to determine the sedsed-iment physical properties of natural water content as well as wet and dry bulk density. The latter two were used to calibrate the parallel profiles ofγ-ray attenuation that vary as a function of sedi-ment density (Weber et al., 1997). Using these calibrations from selected cores, a homogenous set of dry bulk density data was generated for 15 sediment profiles of 12 to 40 cm length from water depths of 250 to 1970 m. The 30 cm long multicore MC2 from a depth of 197 m was only described vi-sually prior to discrete sampling, and showed a homogenous light-colored layer of silty clay between 18.0 and 21.0 cm core depth.
A detailed varve chronology was developed for the lam-inated sediments from the Pakistan margin (Schulz et al., 1996; von Rad et al., 1999). This chronology is based on the assumption that a couplet of one light-gray-colored (win-ter) lamina plus one dark-gray, organic-rich (summer) lamina was deposited in one year. This assumption was verified by the observation that five light–dark couplets of laminae were accumulated at the upper Makran slope in between 1993
(SONNE90) and 1998SONNE130). Lückge et al. (2002)
in-terpreted the thicker light-colored laminae as representing re-current suspension events linked to high winter precipitation, and the dark-colored laminae as caused by the high summer productivity during the SW monsoon.
About 150 samples from the top 20 cm of laminated sedi-ment at 1 cm intervals of cores MC1, MC3, MC5 and 39 KG, 58 KG were used for 210Pb dating to precisely determine the sedimentation rates during the last 150 years. These data are presented here only for core 58 KG (Erlenkeuser, unpub-lished data). The relative error for the past 1000 years is bet-ter than 10 % for that method. Analytical details of the210Pb method are outlined in Erlenkeuser and Peterstad (1984). AMS14C ages of monospecific samples ofGlobigerinoides
ruber(white) or of mixed P.F. were determined at the
Leib-niz Labor Kiel, Germany.
based on the sedimentation rate estimates from the cores and from the dry bulk densities, following Thiede et al. (1982):
ARbulk sediment=SRpdry, (1)
with AR in g cm−2kyr−1, SR in cm kyr−1, andpdry(dry bulk density) in g cm−3.
The accumulation rate of individual compounds, or of the individual sediment components in a sample, is calculated as follows:
ARcomponent=SRpdryC/100, (2)
where C is the concentration of a compound in percent, and N is the number of the specimens per gram of dry sediment.
3.2 Sediment traps
Four trap moorings of type MARK 7G-21 (McLane Research Laboratories Inc.) at sites EPT (24◦45.4′N, 65◦48.7′E) and
WPT (24◦35.9′N, 65◦35.3′E; 2004 m seafloor depth) had
been deployed within and below the OMZ off Pakistan (Fig. 1). Collection time was programmed as October 1993 to February 1994 and May 1995 to February 1996 (EPT2). Sampling intervals for the 28 cups used in the present study were 22 days for WPT and EPT1 and 24 days for EPT2, re-spectively (Table 2). Prior to deployment, cups were treated with mercuric chloride. The total mass fluxes, CaCO3 and lithogenic particle fluxes were also presented in Andruleit et al. (2000) and in Schulz et al. (2002), who studied the coccolithophore and planktic foraminiferal fluxes, and by Treppke, who studied the diatoms (von Rad et al., 2002b, their Fig. 11). Details of trap and sample preparation, OC, CaCO3, biogenic opal analyses, and of the derivation of fluxes are described in Haake et al. (1993), Andruleit et al. (2000) and Suthhof et al. (2000). The mass accumulation rates were previously used by Suthhof et al. (2000).
All flux and accumulation rate results are listed in Table 2. Estimates of local primary productivity were adopted from Antoine at al. (1996). The accumulation rate for the respec-tive sediment property was derived from that analysis of the core top sample 0–1 cm. The density value for a particu-lar station was averaged from the measurements above the marker layer (Fig. 3). Similarly, sedimentation rates were calculated assuming a linear accumulation process of the laminated/bioturbated sediments over the past∼100 years.
Most estimates for the study are expressed as mg m−2d−1or specimens (= spec.) m−2d−1to allow for direct comparison.
4 Results
4.1 A turbidite or turbid top layer as stratigraphic
marker for core correlation
Staubwasser and Sirocko (2001) presented sedimentological and geochemical data on the distinct, up to 12 cm thick red-dish turbidite they observed in nearly allSONNEcores of the
Hab area. An investigation of theMETEORshort multicores,
overlapping with theSONNEsediments, shows in some cases
thatMETEORcores 1–6 are thinner, having a gray to
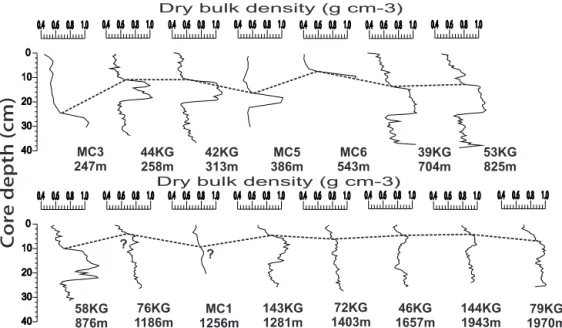
light-gray silty layer at 10 to 24 cm depth (see supplementary on-line material). The cores 2–6 were taken from a channel, while cores 42 and 44 KG ware recovered from the nearby flank of that channel on the NE slope of the Murray Ridge, (Fig. 1b). We show that both types of layers display internal structures that can be best seen in their high-resolution pro-files of dry bulk density (Fig. 2b, d). We observe faint grading in the reddish-colored, decimeter-thick beds in someSONNE
cores, as well as highest density at their bottoms (Fig. 3), that might reflect coarser grain sizes or compaction at the base of these layers. The density profile of shallow core 44 KG sug-gests that the thick layers might also display more internal structure reflecting at least two sublayers. From a slight in-crease in sand content near the base, faint regular grading can also be traced in the relatively thin, light-gray layer of core MC5 (Fig. 2b).
All cores display high sediment densities for the layer of
≥0.8 (Fig. 3) corresponding to low OC content of < 1 %
(Fig. 2). Few pelagic microfossils, grading and rapid flow ex-pansion leading to variable thicknesses are typical diagnos-tic features of that type of fine-grained silt turbidite (Piper and Stow, 1991). However, quality of the extremely soft ME-TEOR cores is poor compared to the SONNE box cores,
where most of these criteria can be observed. Due to in-creasing bottom water oxygen at depths above and below the OMZ supporting macrofaunal bioturbation, the marker could not be determined with precision outside the OMZ. The upper boundary of that marker layer is still feasible as a slight relative increase in density in the high-resolution logs below the OMZ down to 1970 m (Fig. 3). Although the sed-imentation at the central Makran is characterized by the de-position of up to some millimeter- to decimeter-thick light-colored “turbid layers” (von Stackelberg, 1972) and by larger turbidites (Schulz et al., 1996, von Rad et al., 2002b; Bour-get et al., 2010), no other thick red and/or light-gray whitish layer was found in the upper meters of cores in the Hab area. Assuming that the reddish and light-gray to whitish layers reflect different sedimentation events, we are able to esti-mate the level of uncertainty from assuming that the layers are diachronous. In 58 KG (and also in coresSONNE130–
262 MC and 291 MC), the reddish turbidite is separated from that whitish layer immediately below by thin, alternating black and olive-gray laminae. According to our varve model, these 5–10 millimeter-thick layers would correspond to less than 10 years (Fig. 2d; see X-ray figure of Staubwasser and Sirocko, 2001).
4.2 Local sedimentation rates by Pb dating, varve
chronology and14C ages
0.4 0.6 0.8 1.0 0.4 0.6 0.8 1.0
0.4 0.6 0.8 1.0 0.4 0.6 0.8 1.0
0 10 20 30 40
0.4 0.6 0.8 1.0
0.4 0.6 0.8 1.0
0.4 0.6 0.8 1.0 0.4 0.6 0.8 1.0 0.4 0.6 0.8 1.0 0.4 0.6 0.8 1.0 0.4 0.6 0.8 1.0 0.4 0.6 0.8 1.0 0.4 0.6 0.8 1.0 0.4 0.6 0.8 1.0
0.4 0.6 0.8 1.0 0
10 20 30 40
Coredepth(cm)
Dry bulk density (g cm-3)
Dry bulk density (g cm-3)
MC3
247m 44KG258m 42KG313m 386mMC5 543mMC6 39KG704m 53KG825m
MC1 1256m 58KG
876m 1186m76KG 143KG1281m 1403m72KG 1657m46KG 144KG1943m 1970m79KG ?
?
Figure 3.Correlation of short box (KG) and multicores (MC) by means of their sediment density (here expressed as dry bulk density) profiles
above and below the silt turbidite, used for correlation (stippled line). A sudden increase in density with depth (in centimeters) is evident for the laminated cores within the OMZ. Density is lowest near the core top and increases with depth by compaction. Below OMZ depths, this boundary is smoothed by bioturbation, becoming more faint with water depth and distance from the shelf.
and 58 KG, respectively (Fig. 2a, d).210Pb dating of core 58 KG and of other short sediment profiles indicates that the younger date of AD 1905 (i.e., about 90 years before 1993/1996) may be more reliable. The error of that data amounts to not more than 10 %, which conforms to <±10
years. The sedimentation rate (SR) has a strong impact on the respective accumulation rates (ARs) (see Eq. 1), as changes in dry bulk density are relatively small, and in general show similar trends with very low values near the core top. The 13 density profiles show a rather uniform density maximum for the marker turbidite used for the correlation. Density pro-files from above that layer show values increasing with wa-ter depth. Most profiles for the past ∼100–500 years from
OMZ depths show values of < 0.6 g cm−3with a major shift at∼1200 m (compare 76 KG and MC1, Fig. 3) to densities
of > 0.7 g cm−3.
The date of AD 1905 suggests sedimentation rates of 167 cm kyr−1 and 150 cm kyr−1 for the two core profiles,
whereas by the correlation via the marker horizon, sed-imentation rates at shallow depth are distinctly higher (up to 272 cm kyr−1). At greater depth and more distant
from the coast, sedimentation rates were lower (46 KG and 144 KG, 44 cm kyr−1) (Table 2). Sedimentation rates of
≥ ∼200 cm kyr−1on the shelf (MC2, MC3) are in line with
Limmer et al. (2012), who determined a sedimentation rate of 195 cm kyr−1 in the core Indus-10 on the inner shelf at 71 m, to the east of the Hab area. In order to support our stratigraphic models, the AMS14C ages from intervals from above and further below the clay-silt layer in cores M32– MC1 and M32–MC5 show a difference of 4014C years over
the interval of 7.3 cm in the latter core. The suggested sedi-mentation rate for that interval is∼180 cm kyr−1.
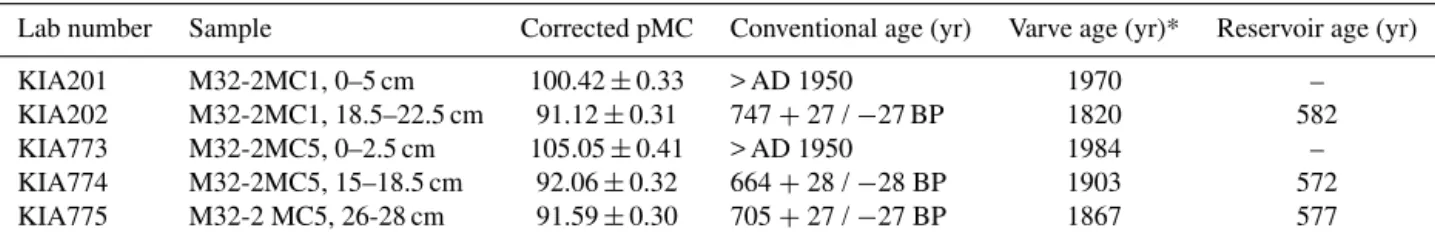
Further, the ages of the laminated intervals can be used to assess the radiocarbon age of the local surface water. This “reservoir effect” of the ocean water is known to be highly variable in space and time. As expected, the plank-tic foraminiferal 14C dates of the top sediments of MC1 and MC5 yielded negative ages caused by the post-bomb high atmospheric radiocarbon concentrations (Table 1). In contrast, the three laminated intervals in cores MC1 and MC5 from the OMZ yielded uncorrected, “conventional”14C ages of 747±27, 664±25, and 705±23 years, respectively,
that correspond to varve ages of AD 1820, AD 1903, and AD 1867. From the difference between the varve ages of 175 years, 92 years and 128 years of these depth intervals (which clearly predate the spike of “bomb” radiocarbon in 1964),and the corresponding “conventional”14C ages, we could determine essentially uniform reservoir ages of 582, 572 and 577 years from the three different14C dates. The average reservoir age of 577 years is different from the 640 years used by von Rad et al. (1999).
4.3 Sedimentation patterns
4.3.1 Bulk and sand fraction analysis across the OMZ
Table 1.List of AMS14C dates from latest Holocene laminated sediments of the oxygen minimum zone (OMZ) off Pakistan.
Lab number Sample Corrected pMC Conventional age (yr) Varve age (yr)* Reservoir age (yr)
KIA201 M32-2MC1, 0–5 cm 100.42±0.33 > AD 1950 1970 – KIA202 M32-2MC1, 18.5–22.5 cm 91.12±0.31 747+27 /−27 BP 1820 582 KIA773 M32-2MC5, 0–2.5 cm 105.05±0.41 > AD 1950 1984 – KIA774 M32-2MC5, 15–18.5 cm 92.06±0.32 664+28 /−28 BP 1903 572 KIA775 M32-2 MC5, 26-28 cm 91.59±0.30 705+27 /−27 BP 1867 577
*assuming constant sedimentation rates (Table 2).
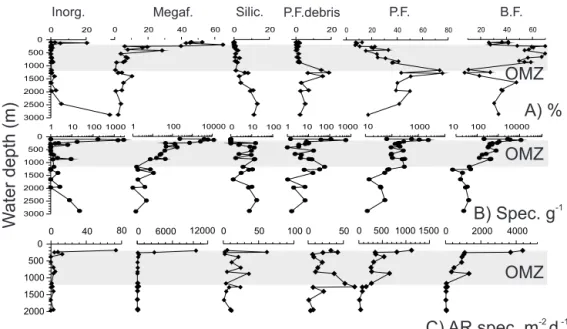
comparable depth on the Indus slope. An exception is the carbonate-rich facies of relict sands on the shelf, which con-tain a significant component of biogenic calcite and a bulk carbonate content of up to 70 % (von Stackelberg, 1972). These carbonate sands are restricted to shallow water depths of < 200 m on the Makran side, but are found down to 400 m below present sea level on the Indus side. The shallow sites (Fig. 1c) are situated within a relatively flat channel mor-phology. Above the OMZ the flat shelf may provide space and substrate for sessile and vagile CaCO3-producing organ-isms, which is in line with the high relative abundance and AR of megafossils at < 250 m water depth (Fig. 4). Below that depth, the sand fraction decreases to only 0.5–3.0 wt% (Fig. 2), where most of the coarse fraction is of planktic and benthic foraminiferal tests with a few hundred to a few thou-sand spec. g−1.
Remarkable for OMZ sediments is the high abundance of benthic foraminifers (Fig. 4). Based on accumulation rates, we can say that the benthic foraminiferal popula-tion at the lower OMZ boundary and below shows stable but low numbers (∼10–50 spec. m−2yr−1), while benthic
foraminifera clearly are more important within the OMZ (∼500–1000 spec. m−2yr−1). The accumulation of benthic
foraminiferal shells is highest in the shallow waters, with a maximum AR of 4000 spec. m−2yr−1 on the shelf
out-side the OMZ. The minimum in the benthic foraminifera fre-quencies found at the lower OMZ boundary is in contrast to a maximum in relative abundance of planktic foraminifera, the latter group making up to 80 % of the sand fraction. We note also an increase in the AR of planktic foraminifera and planktic foraminiferal debris, thus causing the dilu-tion effect on the benthic foraminifera. In contrast to other high-productivity areas, siliceous microfossils (diatoms, ra-diolarians, silicoflagellates, sponge spicules) are rare in the sand fraction of the surface sediments.In general, the abun-dance and relative frequencies of siliceous tests in the coarse fraction increase with depth; however no clear pattern is seen, possibly because of the low numbers of less than 100 spec. g−1.
The accumulation of inorganic particles can be interpreted mostly as precipitates of small oxides/oxihydroxides (Law et al., 2009) at the lower OMZ. Pyrite was found sporadically
inside the spherical tests of the planktic foraminiferOrbulina
universa.
4.3.2 High accumulation rates of bulk sediment
fractions
A general decrease of SRs, and hence ARs, is observed with increasing water depth. Individual stations at the shelf edge show a large variability with the highest AR of bulk sediment of > 4000 mg m−2d−1 (Fig. 5a). In contrast, the two sites 42 KG and 44 KG immediately below display only half of that flux. MC5 shows a slightly higher AR bulk of 2600 mg m−2d−1. On the shelf, ARs are highest and show
largest variability. MC6 (543 m, Fig. 1) from the same region is the uppermost core on the slope and displays a relatively low AR bulk of 1110 mg m−2d−1(Table 2).
The deeper sites (e.g., 39 KG) are situated on the Makran side of the Hab transect. Also, these sites show, in general, a decrease of AR bulk, with a decline with water depth and distance from the shelf from > 2700 to∼1100 mg m−2d−1
(Fig. 5a). The negative trend is typical for all bulk compo-nents (Fig. 5b, c) except for the sediment concentration of OC (Fig. 5d) that is distinctly lowered at the uppermost sites at the Indus side of the investigated Hab transect. In con-trast, CaCO3has very high relative and absolute accumula-tion rates on the shelf, where its relative fracaccumula-tion is about 25 %. At greater depths, that fraction decreases to less than 15 %.
4.3.3 High-flux events (HFEs) during winter caused
incomplete trap time series
The longest trap series (EPT2; see Table 2) collected from late spring (May 1995) to late winter, but stopped abruptly in February 1996. An extremely high bulk particle flux of 2000 to > 5000 mg m−2d−1was also measured two years
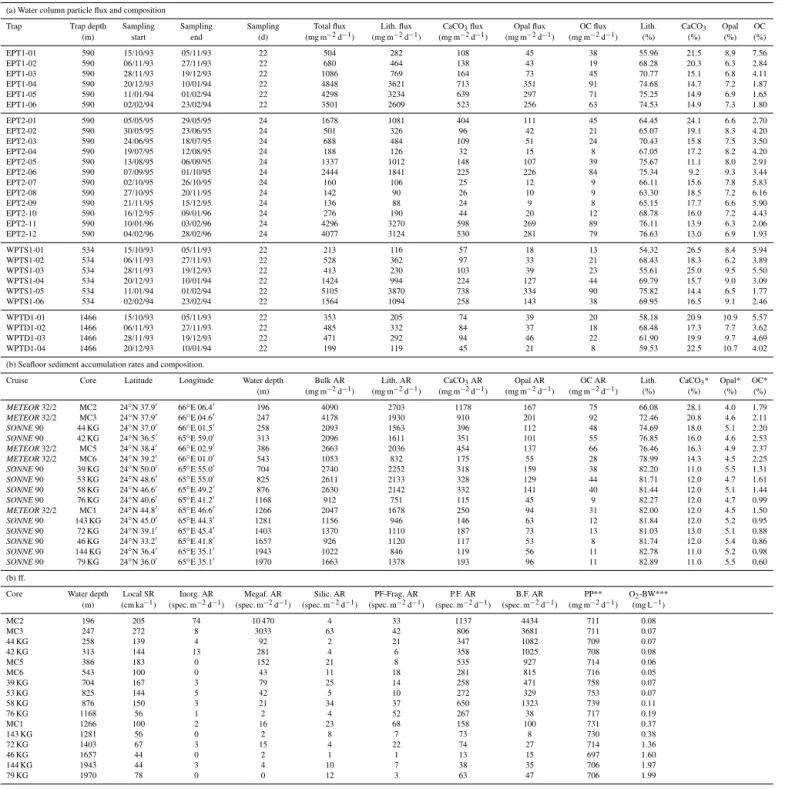
Table 2.List of fluxes of lithic matter, calcium carbonate (CaCO3), and organic carbon (OC) in the water column (sediment traps EPT1,
EPT2, WPTs and WPTd) and reconstructed accumulation rates (ARs) at the seafloor for 16 short cores at water depths between 196 and 1970 m.
(a) Water column particle flux and composition
Trap Trap depth Sampling Sampling Sampling Total flux Lith. flux CaCO3flux Opal flux OC flux Lith. CaCO3 Opal OC
(m) start end (d) (mg m−2d−1) (mg m−2d−1) (mg m−2d−1) (mg m−2d−1) (mg m−2d−1) (%) (%) (%) (%)
EPT1-01 590 15/10/93 05/11/93 22 504 282 108 45 38 55.96 21.5 8,9 7.56
EPT1-02 590 06/11/93 27/11/93 22 680 464 138 43 19 68.28 20.3 6.3 2.84
EPT1-03 590 28/11/93 19/12/93 22 1086 769 164 73 45 70.77 15.1 6.8 4.11
EPT1-04 590 20/12/93 10/01/94 22 4848 3621 713 351 91 74.68 14.7 7.2 1.87
EPT1-05 590 11/01/94 01/02/94 22 4298 3234 639 297 71 75.25 14.9 6.9 1.65
EPT1-06 590 02/02/94 23/02/94 22 3501 2609 523 256 63 74.53 14.9 7.3 1.80
EPT2-01 590 05/05/95 29/05/95 24 1678 1081 404 111 45 64.45 24.1 6.6 2.70
EPT2-02 590 30/05/95 23/06/95 24 501 326 96 42 21 65.07 19.1 8.3 4.20
EPT2-03 590 24/06/95 18/07/95 24 688 484 109 51 24 70.43 15.8 7.5 3.50
EPT2-04 590 19/07/95 12/08/95 24 188 126 32 15 8 67.05 17.2 8.2 4.20
EPT2-05 590 13/08/95 06/09/95 24 1337 1012 148 107 39 75.67 11.1 8.0 2.91
EPT2-06 590 07/09/95 01/10/95 24 2444 1841 225 226 84 75.34 9.2 9.3 3.44
EPT2-07 590 02/10/95 26/10/95 24 160 106 25 12 9 66.11 15.6 7.8 5.83
EPT2-08 590 27/10/95 20/11/95 24 142 90 26 10 9 63.30 18.5 7.2 6.16
EPT2-09 590 21/11/95 15/12/95 24 136 88 24 9 8 65.15 17.7 6.6 5.90
EPT2-10 590 16/12/95 09/01/96 24 276 190 44 20 12 68.78 16.0 7.2 4.43
EPT2-11 590 10/01/96 03/02/96 24 4296 3270 598 269 89 76.11 13.9 6.3 2.06
EPT2-12 590 04/02/96 28/02/96 24 4077 3124 530 281 79 76.63 13.0 6.9 1.93
WPTS1-01 534 15/10/93 05/11/93 22 213 116 57 18 13 54.32 26.5 8.4 5.94
WPTS1-02 534 06/11/93 27/11/93 22 528 362 97 33 21 68.43 18.3 6.2 3.89
WPTS1-03 534 28/11/93 19/12/93 22 413 230 103 39 23 55.61 25.0 9.5 5.50
WPTS1-04 534 20/12/93 10/01/94 22 1424 994 224 127 44 69.79 15.7 9.0 3.09
WPTS1-05 534 11/01/94 01/02/94 22 5105 3870 738 334 90 75.82 14.4 6.5 1.77
WPTS1-06 534 02/02/94 23/02/94 22 1564 1094 258 143 38 69.95 16.5 9.1 2.46
WPTD1-01 1466 15/10/93 05/11/93 22 353 205 74 39 20 58.18 20.9 10.9 5.57
WPTD1-02 1466 06/11/93 27/11/93 22 485 332 84 37 18 68.48 17.3 7.7 3.62
WPTD1-03 1466 28/11/93 19/12/93 22 471 292 94 46 22 61.90 19.9 9.7 4.69
WPTD1-04 1466 20/12/93 10/01/94 22 199 119 45 21 8 59.53 22.5 10.7 4.02
(b) Seafloor sediment accumulation rates and composition.
Cruise Core Latitude Longitude Water depth Bulk AR Lith. AR CaCO3AR Opal AR OC AR Lith. CaCO3* Opal* OC*
(m) (mg m−2d−1) (mg m−2d−1) (mg m−2d−1) (mg m−2d−1) (mg m−2d−1) (%) (%) (%) (%)
METEOR32/2 MC2 24◦N 37.9′ 66◦E 06.4′ 196 4090 2703 1178 167 75 66.08 28.1 4.0 1.79
METEOR32/2 MC3 24◦N 37.9′ 66◦E 04.6′ 247 4178 1930 910 201 92 72.46 20.8 4.6 2.11
SONNE90 44 KG 24◦N 37.0′ 66◦E 01.5′ 258 2093 1563 396 112 48 74.69 18.0 5.1 2.20
SONNE90 42 KG 24◦N 36.5′ 65◦E 59.0′ 313 2096 1611 351 101 55 76.85 16.0 4.6 2.53
METEOR32/2 MC5 24◦N 38.4′ 66◦E 02.9′ 386 2663 2036 454 137 66 76.46 16.3 4.9 2.37
METEOR32/2 MC6 24◦N 39.2′ 66◦E 01.0′ 543 1053 832 175 55 28 78.99 14.3 4.5 2.25
SONNE90 39 KG 24◦N 50.0′ 65◦E 55.0′ 704 2740 2252 318 159 38 82.20 11.0 5.5 1.31
SONNE90 53 KG 24◦N 48.6′ 65◦E 55.0′ 825 2611 2133 328 129 44 81.71 12.0 4.7 1.61
SONNE90 58 KG 24◦N 46.6′ 65◦E 49.2′ 876 2630 2142 332 141 40 81.44 12.0 5.1 1.44
SONNE90 76 KG 24◦N 40.6′ 65◦E 41.2′ 1168 912 751 115 45 9 82.27 12.0 4.7 0.99
METEOR32/2 MC1 24◦N 44.8′ 65◦E 46.6′ 1266 2047 1678 250 94 31 82.00 12.0 4.5 1.50
SONNE90 143 KG 24◦N 45.0′ 65◦E 44.3′ 1281 1156 946 146 63 12 81.84 12.0 5.2 0.95
SONNE90 72 KG 24◦N 39.1′ 65◦E 45.4′ 1403 1370 1110 187 73 13 81.03 13.0 5.1 0.88
SONNE90 46 KG 24◦N 33.2′ 65◦E 41.8′ 1657 926 1120 117 53 8 81.74 12.0 5.4 0.86
SONNE90 144 KG 24◦N 36.4′ 65◦E 35.1′ 1943 1022 846 119 56 11 82.78 11.0 5.2 0.98
SONNE90 79 KG 24◦N 36.0′ 65◦E 35.1′ 1970 1663 1378 193 96 11 82.89 11.0 5.5 0.60
(b) ff.
Core Water depth Local SR Inorg. AR Megaf. AR Silic. AR PF-Frag. AR P.F. AR B.F. AR PP** O2-BW***
(m) (cm ka−1) (spec. m−2d−1) (spec. m−2d−1) (spec. m−2d−1) (spec. m−2d−1) (spec. m−2d−1) (spec. m−2d−1) (mg m−2d−1) (mg L−1)
MC2 196 205 74 10 470 4 33 1137 4434 711 0.08
MC3 247 272 8 3033 63 42 806 3681 711 0.07
44 KG 258 139 4 92 2 21 347 1082 709 0.07
42 KG 313 144 13 281 4 6 358 1025 708 0.08
MC5 386 183 0 152 21 8 535 927 714 0.06
MC6 543 100 0 43 11 18 281 815 716 0.05
39 KG 704 167 3 79 25 14 258 471 758 0.07
53 KG 825 144 5 42 5 10 272 329 753 0.07
58 KG 876 150 3 21 34 37 650 1323 739 0.11
76 KG 1168 56 1 2 4 52 267 38 717 0.19
MC1 1266 100 2 16 23 68 158 100 731 0.37
143 KG 1281 56 0 2 8 7 73 8 730 0.38
72 KG 1403 67 3 15 4 22 74 27 714 1.36
46 KG 1657 44 0 2 1 1 13 15 697 1.60
144 KG 1943 44 3 4 10 7 38 35 706 1.97
79 KG 1970 78 0 0 12 3 63 47 706 1.99
*Suthhof et al., 2000.
**Primary productivity PP ( Antoine et al., 1996).
1 10 100 1000 0
500 1000 1500 2000 2500 3000
1 100 10000 10 100 1 10 100 1000 10 1000 100 10000
0 20 40 60 0 20
0 20
0 500 1000 1500 2000 2500 3000
0 20 0 20 40 60 80 20 40 60
0 10
12000 0 6000 0 40 80 0
500 1000 1500 2000
0 50 1000 50 0 500 1000 15000 2000 4000
OMZ
OMZ
OMZ
Megaf. Silic.
Inorg. P.F.debris P.F. B.F.
A) %
-1
B) Spec. g
-2 -1
C) AR spec. m d
W
ater depth (m)
Figure 4. Main components of the coarse fraction (> 150 µm) along the Hab transect (see Fig. 1b, c). Inorg. stands for lithogenic and
authigenic particles (quartz, concretions, pyrite, etc.), Megaf. for megafossils (mussels, snails, fish, etc.), Silic. for siliceous biogenic particles (radiolarians, diatoms, sponge spicules), P.F. debris for fragments of planktic foraminifera shells, P.F. for intact planktic foraminifera, and B.F. for benthic foraminifera and fragments. The rows display(A)relative abundance (%),(B)concentration (number of spec. g−1), and(C)
accumulation rates (AR) of spec. m−2d−1of the six categories. OMZ stands for oxygen minimum zone.
Here we define the onset of the winter high-flux period due to the dramatic shift in bulk flux as high-flux events (HFEs). According to the definition of Schott et al. (2009), that pe-riod in the northern Arabian Sea temporally coincides with the late winter NE monsoon period, although the timing of the start of the HFE is slightly different for the two winters sampled.
In EPT2 the HFE shift is observed from collection period 10 to 11 (10 January 1996). In EPT1 an increase is noticed in sampling cup 3, and the strong shift is from cup 4 to cup 5 (20 December 1993). For the deployment of the same year fur-ther offshore (WPTs and WPTd were programmed to sam-ple flux simultaneously to EPT1 closer onshore, Table 2), the start of an HFE is fully recorded at the shallow trap WPTs, but occurs one collection period (22 days) later (cup 4). The vertical trap particle flux in the Hab area is about 10 times higher when compared to the open ocean areas of the Arabian Sea (Haake et al., 1993). Moreover, the flux rates and compo-sition within the water column (Fig. 6b), which could be de-termined only for a limited period of time, agree rather well in dimensions, with the accumulation rates and fractions de-termined at the seafloor (Fig. 5). Both the water column and seafloor estimates of the bulk flux amount to several thou-sand mg m−2d−1, and the CaCO
3and OC fluxes range from several tens to several hundreds of mg m−2d−1(Table 2). An
elevated trap flux during and after summer (SW) monsoon (in July/August according to the definition of Schott et al., 2009) could be recorded in EPT2. It is characterized by a higher concentration of OC (∼2%), whereas all winter fluxes have
relatively low OC (∼1%). An analysis of the winter coarse
fraction of EPT2 hints at the origin of the HFE matter: small benthic foraminifera, presumably remobilized from the shelf and upper slope, constitute up to 10 % of the foraminiferal flux during the winter season (Schulz et al., 2002).
5 Discussion
Based on our detailed studies of the sediment profiles, the finding of more than one layer leaves some uncertainty on the exact patterns displayed by the sedimentation rates. We described different colors and thicknesses of layers, and ob-serve presumably different event layers deposited one on top of the other at one site (58 KG). This refutes exact synchro-nism of that marker bed. We suggest that the red and gray lay-ers are almost synchronous. These are separated by 5–10 thin sediment laminae (Staubwasser and Sirocko, 2001), since they were deposited by a similar turbidite or turbid-layer-type gravitational deposition process around AD 1905±10.
Figure 5.Estimated accumulation rates (AR) of selected bulk
pa-rameters vs. water depth. Note that upper stations are on the Indus side, whereas the deeper cores are from the Makran margin.(A)
AR bulk,(B)AR CaCO3,(C)AR organic carbon OC and(D)
sedi-mentary organic carbon OC (%). OMZ stands for oxygen minimum zone.
sandwiched between laminated sediments, are unique and of-fer a good opportunity for correlation.
We find a rather low, stable accumulation of or-ganic carbon below the OMZ with an OC AR of only
∼10 mg m−2d−1. At these sites, we also notice the very low
but uniform accumulation of benthic foraminifera. The par-allel accumulation rates may document the close relation-ship between the benthic faunas and available OC (food). This may be valid only for the aerobic fauna. However, ap-proaching the lower margin of the OMZ, significant changes in the faunal composition have been noticed (Schumacher et al., 2007). Zobel (1973) observed a strong reduction of benthic foraminifera at the lower boundary and explained the gap in the study’s percentage data (Fig. 4) by a ben-thic community change between a more aerobic deeper
wa-terBulimina aculeatafacies and an OMZBuliminacea
bio-facies. The high density of benthic foraminifera of ∼200–
1000 spec. m−2yr−1(live+dead fauna) in the upper part of
the OMZ is in line with the more recent observations show-ing that benthic foraminifera, as part of the meiofauna, play a central role in OM cycling. In particular, the formUvigerina
ex. gr.semiornatais present in the upper part of the Pakistan
OMZ (Larkin and Gooday, 2009). However, off the Indus margin to the south of Karachi, these authors observe high benthic foraminiferal densities at the deep OMZ, whereas
ac-Fall intermonsoon Winter monsoon
?
260 280 300 320 340 360 380 400 420 440 0
1000 2000 3000 4000 5000 6000
EPT1 EPT2
WPTs WPTd
Days (start January 1,1993; traps EPT1, WPTs, WPTd) Days (start January 1,1995; trap EPT2)
FLUX (OC)/Flux (Lith.)
HFE
Fall intermonsoon Winter monsoon
260 280 300 320 340 360 380 400 420 440
0.00 0.05 0.10 0.15
EPT1
EPT2 WPTs WPTd
Days (start January 1,1993; traps EPT1, WPTs, WPTd) Days (start January 1,1995; trap EPT2)
FLUX (OC)/Flux (Lith.)
?
HFE
a)
b)
Figure 6.Summarized details of flux recording prior and during
the winter high-flux events (HFEs) from the four sediment traps (EPT2, EPT1, WPTs and WPTd). Note that the latter three have synchronous collection periods (see Table 2).(A)Differences in the
timing of increasing and peak flux in the shallow traps EPT and WPTs).(B)Composition of settling flux (exemplified by the ratio
cumulation rates in the Hab transect on the eastern Makran show a pattern of decline with water depth, as depicted by most other sediment properties.
Within the OMZ, sediment profiles are largely intact as they lack the smoothing effect of bioturbation. As expected, sedimentation rates are highly variable in an active continen-tal margin setting. It should be mentioned here that neither the OC AR nor the concentration data of our data set can provide us with an estimate of the key parameter, which is or-ganic carbon burial efficiency, to assess any potential preser-vational effect on OC by the OMZ. Here we provide esti-mates on the age and porosity (which parallels density) of the sediments, as well as on the O2content of the local bot-tom waters (Table 2), but we miss a measure for diffusion of O2 into the sediment to comment on whether there are differences in O2exposure time. Hartnett et al. (1998) indi-cated that oxygen exposure time is important, especially in explaining the decline in OC below the OMZ. However, at no site, even with the sediment trap data, can we determine the percentage of OC delivered to the sediments that is actu-ally buried.
As a main finding, our profiles show that the upper bound-ary of the OMZ is characterized by high OC fluxes at the outer shelf and downslope transport of allochthonous matter. OC AR (mg m−2d−1)and OC (%) strongly decline from the upper slope∼400 m to∼800–900 m, and again towards the
lower margin of the OMZ, where both parameters reach low values at 1200–1300 m and do not decrease further below. Down to 2000 m water depth, OC ARs are∼10 mg m−2d−1
(∼1.5 % of the regional primary productivity estimate at the
sea surface (720±17 mg OC m−2d−1)). On the outer shelf,
at 250 m water depth, that fraction is∼10 % (Table 2).
We suggest that the local shelf drainage system of the Hab area may be unique, dominated by a seasonally variable de-position of extremely fine-grained matter downslope. Only very little coarse materials like macrofossil shells or clastic material escape from the shelf (Fig. 4). Our suggestion is in line with the findings to the south of our region, where organic matter on the seafloor of the Indus area is found strongly degraded in the laminated sediments (Woulds and Cowie, 2009; Jeffreys et al., 2009; Vandewiele et al., 2009). However, there is little information on the various sources and pathways of matter. By the comparatively weak bottom currents and the very low ventilation, and by of the local drainage system, the Hab sedimentary environment contrasts with the other highly productive, low-oxygen margin zones of the Arabian Sea basin to the west and to the southeast. For example, OC, C / N, hydrogen index data and miner-alogical indicators do not match to the mid-depth oxygen-minimum patterns along the highly productive, steep Oman margin (Pedersen et al. 1992). Attendant downslope rework-ing and sediment winnowrework-ing were found to best explain the OC patterns found there, but sediment laminae today are absent from the Oman margin. As reported previously by Calvert et al. (1995), laminae are also absent, and there is
ma-jor variability in OC content and sediment grain size at any given depth within the OMZ on the Indian margin. However, compared to the eastern Makran, on both margins there is sufficient oxygen to permit some level of bioturbation, even at the OMZ core, and/or insufficient seasonal change in in-puts, resulting in the lack of laminae there. The key point that can be inferred from the two studies of Pedersen et al. (1992) and Calvert et al. (1995) is the large range of grain size and OC contents, associated with strong bottom currents on the upper slope and shelf, ultimately resulting in more sandy sed-iments on the West Indian and Oman margins. Coarse sedi-ments and ripple beds were also clearly observed at the OMZ core off India (von Stackelberg, 1972; Petra Heinz, personal communication, 2014). On the Indus margin, the OC maxi-mum is found at the lower boundary of the OMZ (Cowie et al. 1999), as in many transects off India and Oman. Therefore in these settings, local near-bottom transport and changes in sediment texture are obviously the dominant control on OC distribution, overriding any oxygen effect there. In contrast, our data exhibit an OC maximum near the upper boundary of the OMZ.
The preservation of laminae (Fig. 2) and the complete-ness of the sediment profiles (Fig. 3) point to a rather sta-ble sedimentary environment and to the reduced importance of near-bottom sediment transport off the Makran coastal zone (Fig. 4). Strong and event-like near-bottom resedimen-tation events (except the marked clay-silt turbidite) were not recorded from the sediments during the past ∼100 years
in the Hab area and on the upper Indus slope. However, thin silty event deposits of light-gray color are eventually interbedded between the seasonal laminae couplets (see “C layers” in Schulz et al. (1996) and von Rad et al. (2002b); core photos provided as a supplement).
Unique sedimentary conditions may prevail not only across the slope (Fig. 2–5) but also in the water column off the Hab transect. We emphasize that the extremely fine-grained, organic and clastic material resuspended from shal-low depths during the winter season is one of the main sed-imentary factors that causes the OC maximum near the up-per continental margin, and plays an important role for the formation of the Pakistan laminated sediments. Von Rad et al. (2002b) report that there is continuous lamination in the Holocene core 56KA at station 39 KG. For at least the past
∼5000 years, more than 50 wt% (up to 65 %) of the bulk
matter flux was in the clay fraction, with a small median of only 1.8 µm.
For the Pakistan margin, we assume that, due to winter HFE, sediment trap cups and possibly even the funnels were filled with sediment. In both sediment trap time series EPT1 and WPTs of 1993/1994, only the first six cups were filled (Andruleit et al., 2000; Schulz et al., 2002) because trap func-tions terminated. By the same suspension events traps and finally became clogged (Fig. 6). Whatever the exact reason was for the termination of the records, the three traps (except WPTd) collected a huge amount of suspended matter imme-diately before they stopped functioning (Fig. 6a). The exact timing of increases in flux is different for the three traps, but it is possible that fluxes followed a temporal and spa-tial evolution: an HFE in 1993/1994 at EPT1 started in the last weeks of 1993 and was recorded in trap WPTs offshore only in early 1994. We speculate that the HFE of that winter evolved in the coastal and/or shelf margin zones and subse-quently spread away from the coast to record the high fluxes 20 km further offshore at WPTs one sampling period later. A very similar winter flux pattern was observed two years later in EPT2. The increase in fluxes recorded in 1995/1996 started relatively late compared to EPT1.
The average flux composition for the winter period was very similar between the more coastal sites and WPTs trap further offshore (Fig. 6b), and the winter flux material strongly resembles that of the sediments (Table 2). We spec-ulate that the upper water column in the late winter season must have been loaded to more than 30 km distance from the shelf edge (2004 m seafloor depth) with a rather uniform sed-iment suspension. Based on our bulk sedsed-iment AR below the traps, we stress that a “normal” flux of sinking matter (as is observed in EPT2 before the HFE) would not be high enough to explain the deposition of several 1000 mg m−2d−1of
lam-inated sediment offshore. As an example, we speculate that the longest time series, EPT2, must have received an HFE up to 20 000 to 30 000 mg m−2d−1. This large winter flux is needed to balance the low fluxes of only∼750 mg m−2d−1
recorded during spring, summer and fall in order to reach the 2000 to 2500 mg m−2d−1of flux that we reconstructed from sediment stations MC1 and 58 KG below the EPT moorings. However, because of the lack of direct observations, we can only speculate on the temporal and spatial dimensions of the winter resuspension process.
6 Conclusions
1. A quantitative reconstruction of sediment fluxes using a combination of high-quality short sediment cores with sediment trap results leads to a better understanding of the roles of low-oxygen conditions and of the horizon-tal vs. vertical particle transport across the easternmost part of the upper Makran and the northern section of the Indus margin. As a major finding of the study, we present here precise estimates of the mass accumulation rates and a detailed characterization of the different sed-iment fractions. We estimate that the total error for the sediment flux reconstructions is<20 %.
2. Profiling of210Pb, sediment AR determinations and14C dating has previously been done on the Pakistan, Indus and other margins, though not with the spatial coverage and precision of AR estimates presented in our study. Our studies indicate that the trends in organic carbon concentration seen on the Hab/Makran transects are not typical of other Arabian Sea margins. The identifica-tion of an upper-margin organic carbon maximum at
∼400 m is supported by sediment flux estimates
span-ning the entire OMZ down to 2000 m. These estimates indicate that the main source of the material is from shallow water depths, from the outer shelf and upper-most continental slope, even though the texture of bulk sediments on the slope appears to be extremely fine-grained (clay-sized).
3. From a source-to-sink perspective, our investigations imply that important processes of sediment resuspen-sion and dispersal must take place within the water col-umn. Water column processes dominate over the fac-tors of near-bottom transport and preservation. In the outer shelf area the bulk sediment accumulation rates are > 4000 mg m−2d−1, more than twice the rates at 1000 m water depth. These high rates compare best with those from the sediment traps EPT and WPT during the winter season deployed at only∼600 m trap depth.
4. The high-flux events (HFE) documented in our traps suggest that large-scale sediment suspensions of > 5000 mg m−2d−1 spread offshore at the upper slope
in the (NE) monsoon season. This suggests a strong con-trol by the winter monsoon processes on the sedimen-tary regime and on the formation of the laminated sed-iments on the Pakistan margin in the northeastern Ara-bian Sea.
Acknowledgements. The authors thank the editor, Greg Cowie, for helpful comments and the two anonymous reviewers for their thorough and constructive reviews. We thank Birgit Stenschke and Martina Schmidtke for laboratory assistance, Helmut Kawohl and Rainer Goergens for obtaining high-quality sediment cores, and Captain Papenhagen and Captain Kull and their skilled crews for help and good collaboration onboard R.V. SONNEand
R.V. METEOR. The first author wishes to express his sincere thanks to the Hamburg group of marine biogeochemistry – Venu Ittekkot, Andreas Suthhof, Tim Jennerjahn, Jörg Tiemann, Martin Wiesner and Birgit Gaye – for discussions and support. This study was funded by the German Federal Ministry of Education and Research (BMBF), projects 03G0090A (PAKOMIN), 03F0137C (PAKOFLUX) and 03G0806C (CARIMA).
Edited by: G. Cowie
References
Andruleit, H. A., von Rad, U., Bruns, A., and Ittekkot, V.: Coccol-ithophore fluxes from sediment traps in the northeastern Arabian Sea off Pakistan, Mar. Micropaleontol., 38, 285–308, 2000. Antoine, D., André, J.-M., and Morel, A.: Oceanic primary
pro-duction, 2. Estimation at global scale from satellite (coastal zone color scanner) chlorophyll, Global Biogeochem. Cy., 10, 57–69, 1996.
Berger, W. H. and von Rad, U.: Decadal to millennial cyclicity in varves and turbidites from the Arabian Sea: hypothesis of tidal origin, Glob. Planet. Change, 34, 313–325, 2002.
Bourget, J. Zaragosi, S., Ellouz-Zimmermann, S, Ducassou, E., Prins, M., Garlan, T., Lanfumey, V., Schneider, J.-L., Rouillard, P., and Giraudeau, J.: Highstand vs lowstand turbidite system in the Makran active margin: Imprints if high-frequency external controls on sediment delivery mechanisms to deep water sys-tems, Mar. Geol., 274, 187–208, 2010.
Calvert, S. E., Pedersen, T. F., Naidu, P. D., and von Stackelberg, U.: On the organic carbon maximum on the continental slope of the eastern Arabian Sea, J. Mar. Res., 53, 269–296, 1995. Cowie, G. L., Calvert, S. E., Pedersen, T. F., Schulz, H., and von
Rad, U.: Organic content and preservational controls in surficial shelf and slope sediments from the Arabian Sea (Pakistan Mar-gin), Mar. Geol., 161, 23–38, 1999.
Cowie, G. L.: The biogeochemistry of Arabian Sea surficial sedi-ments: A review of recent studies, Prog. Oceanogr., 65, 260–269, 2005.
Cowie, G. L. and Levin, L. A.: Benthic biological and biogeochemi-cal patterns and processes across an oxygen minimum zone (Pak-istan margin, NE Arabian Sea), Deep-Sea Res. Pt. II, 56, 261– 270, 2009.
Cowie, G.L., Mowbray, S., Lewis, M., Matheson, H., and McKen-zie, R.: Carbon and nitrogen elemental and stable isotopic com-positions of surficial sediments from the Pakistan margin of the Arabian Sea, Deep-Sea Res. Pt. II, 56, 271–282, 2009.
Dietrich, P. G. and Marchig, V.: Sedimentation and early diagenesis in the area of the oxygen minimum off the Indus River (Pakistan, Arabian Sea), Zentralblatt für Geologie und PaläontologieTeil I, 1/2, 45–61, 1995.
Erlenkeuser, H. and Peterstad, K.: Recent sediment accumulation in Skagerrak as depicted by 210-Pb-dating, Norsk Geologisk Tidsskrift, 64, 135–152, 1984.
Haake, B., Ittekkot, V., Ramaswamy, V., Nair, R. R., and Curry, W. B.: Seasonality and interannual variability of particle fluxes to the deep Arabian Sea, Deep-Sea Res., 40, 1323–1344, 1993. Hartnett, H. E., Keil, R. G., Hedges, J. I., and Devol, A. H.:
Influ-ence of oxygen exposure time on organic carbon preservation in continental margin sediments, Nature, 391, 572–574, 1998. Helly, J.and Levin, L.: Global distribution of naturally occurring
marine hypoxia on continental margins, Deep-Sea Res. Pt. I 51, 1159–1168, 2004.
Jeffreys, R. M., Wolff, G. A. and Cowie, G. L.: Influence of oxygen on heterotrophic reworking of sedimentary lipids at the Pakistan margin, Deep-Sea Res. Pt. II, 56, 358–375, 2009.
Keil, R. G. and Cowie, G. L.: Organic matter preservation through the oxygen minimum zone of the NE Arabian Sea as discerned by organic-mineral interactions, Chem. Geol., 161, 13–22, 1999. Larkin, K. E. and Gooday, A. J.: Foraminiferal faunal responses to monsoon-driven changes in organic matter and oxygen availabil-ity at 140 and 300m water depth in the NE Arabian Sea. Deep-Sea Res. Pt. II, 56, 403–421, 2009.
Law, G. T. W., Shimmield, T. M., Shimmield, G. B., Cowie, G. L., Breuer, E. R., and Harvey M.: Manganese, iron, and sulphur cy-cling on the Pakistan margin, Deep-Sea Res. Pt. II, 56, 305–323, 2009.
Limmer, D. R., Köhler, C. M., Hillier, S., Moreton, S. G., Tabrez, A. R., and Clift, P. D.: Chemical weathering and provenance evolution of Holocene-Recent sediments from the Western Indus Shelf, Northern Arabian Sea inferred from physical and miner-alogical properties., Mar. Geol., 326–328, 101–115, 2012. Lückge, A., Reinhardt, L., Andruleit, H., Doose-Rolinski, H., von
Rad, U., Schulz, H., and Treppke, U.: Formation of varve-like laminae off Pakistan: decoding 5 years of sedimentation, in: The Tectonic and Climatic Evolution of the Arabian Sea Region, edited by: Clift, P. D., Kroon, D., Gaedicke, C., and Craig, J., Geol. Soc. Spec. Publ., 195, 421–431, 2002.
Nair, R. R, Ittekkot, V., Manganini, S. J., Ramaswamy, V., Haake, B., Degens, E. T., Desai, B. N., and Honjo, S.: Increased particle flux to the deep ocean related to monsoons, Nature, 338, 749– 751, 1989.
Paropkari, A. L., Babu, C. P. and Mascarenhas, A.: A critical eval-uation of depositional parameters controlling the variability of organic carbon in Arabian Sea sediments, Mar. Geol., 107, 213– 226, 1992.
Pedersen, T. F., Shimmield, G. B., and Price, N. B.: Lack of en-hanced preservation of organic matter in sediments under the oxygen minimum on the Oman Margin, Geochim. Cosmochim. Ac., 56, 545–551, 1992.
Piper, D. J. W., and Stow, D. A. V.: Fine-grained turbidites, in: Cyclic and Event Stratification, edited by: Einsele, G. and Seilacher, A., New York, Springer Verlag, 360–376, 1991. Pollehne, F., Zeitschel, B., and Peinert, R.: Short-term
sedimenta-tion patterns in the northern Indian Ocean, Deep-Sea Res. Pt. II, 40, 737–752, 1993.
Rixen, T., Haake, B., and Ittekkot, V.: Sedimentation in the west-ern Arabian Sea, The role of coastal and open-ocean upwelling, Deep-Sea Res. Pt. II, 47, 2629–2651, 1999.
Sarnthein, M., Pflaumann, U., Ross, R., Tiedemann, R., and Winn, K.: Transfer functions to reconstruct ocean paleoproductivity: a comparison, in: Upwelling Systems, Evolution since the Early Miocene, edited by: Summerhayes, C. P., Prell, W. L., and Emeis, K.-C., Geol. Soc. Spec. Publ., 64, 411–427, 1992.
Schott, W., Xie, S.-P., and McCreary, J. P.: Indian Ocean cir-culation and climate variability, Rev. Geophys., 47, RG1002, doi:10.1029/2007RG000245, 2009.
Schumacher, S., Jorissen, F., Dissard, D., Larkin, K. E., and Gooday, A. J.: Live (Rose Bengal stained) and dead benthic foraminifera from the oxygen minimum zone of the Pakistan continental margin (Arabian Sea), Mar. Micropal., 62, 45–73, 2007.
Schultheiss, P. J. and Weaver, P. P. E.: Multi-sensor core logging for science and industry, in: Proceedings Oceans 92, Mastering the Oceans Through Technology, 2, 608–613, 1992.
Schulte, S., Mangelsdorf, K., and Rullkötter, J.: Organic matter preservation on the Pakistan continental margin as revealed by biomarker geochemistry, Org. Geochem., 31, 1005–1022, 2000. Schulz, H., von Rad, U., and von Stackelberg, U.: Laminated sedi-ments from the oxygen minimum zone of the northeastern Ara-bian Sea, in: Paleoclimatology and Paleoceanography from Lam-inated Sediments, edited by: Kemp, A. E. S., Geol. Soc. Spec. Publ., 116, 185–207, 1996.
Schulz, H., von Rad, U., and Ittekkot, V.: Planktic foraminifera, particle flux and oceanic productivity off Pakistan, NE Arabian Sea: modern analogues and application to the paleorecord, in: The Tectonic and Climatic Evolution of the Arabian Sea Region, edited by: Clift, P. D., Kroon, D., Gaedicke, C., and Craig, J., Geol. Soc. Spec. Publ., 195, 499–516, 2002.
Sirocko F. and Sarnthein, M.: Wind-borne deposits in the northwest-ern Indian Ocean: record of Holocene sediment versus modnorthwest-ern satellite data, edited by: Leinen, M. and Sarnthein, M., NATO ASI Series C, 282, 401–433, 1989.
Staubwasser, M. and Sirocko, F.: On the formation of laminated iments on the continental margin off Pakistan: the effects of sed-iment provenance and sedsed-iment redistribution, Mar. Geol., 172, 43–56, 2001.
Suthhof, A. Jennerjahn, T. C., Schäfer, P., and Ittekkot, V.: Nature of organic matter in surface sediments from the Pakistan continental margin and the deep Arabian Sea: amino acids, Deep-Sea Res. Pt. II, 47, 329–351, 2000.
Thiede, J., Suess, E., and Müller, P. J.: Late Quaternary Fluxes of Major Sediment Components to the Sea Floor at the Northwest African Continental Slope, in: Geology of the Northwest African Continental Margin, edited by: von Rad, U., Hinz, K., Sarnthein, M., and Seibold, E., Springer Verlag, 605–631, 1982.
van der Weijden, C. H., Reichart., G. J., and Visser, H. J.: Enhanced preservation of organic matter in sediments deposited within the oxygen-minimum zone in the northeastern Arabian Sea, Deep-Sea Res., 46, 807–830, 1999.
Vandewiele, S., Cowie, G. L., Soetaert, K., and Middelburg, J. J.: Amino acid biogeochemistry and organic matter degradation state across the Pakistan margin oxygen minimum zone, Deep-Sea Res. Pt. II, 56, 376–392, 2009.
von Rad, U., Schulz, H., and SONNE 90 Scientific Party: Sampling the Oxygen Minimum Zone off Pakistan: Glacial/Interglacial variations of anoxia and productivity, Mar. Geol., 125, 7–19, 1995.
von Rad, U., Schaaf, M., Michels, K. H., Schulz, H., Berger, W. H., and Sirocko, F.: A 5000-year record of climate change in varved sediments from the Oxygen Minimum Zone off Pakistan, North-eastern Arabian Sea, Quat. Res., 51, 39–53, 1999.
von Rad, U., Deslisle, G., and Lückge, A.: On the formation of lam-inated sediments on the continental margin of Pakistan – Com-ment, Mar. Geol., 192, 425–429, 2002a.
von Rad, U., Ali Khan, A., Berger, W.H., Rammlmair, D., and Treppke, U.: Varves, turbidites and cycles in upper Holocene sed-iments (Makran slope, northern Arabian Sea), in: The Tectonic and Climatic Evolution of the Arabian Sea Region, edited by: Clift, P. D., Kroon, D., Gaedicke, C., and Craig, J., Geol. Soc. Spec. Publ. 195, 387–406, 2002b.
von Stackelberg, U.: Faziesverteilung in Sedimenten des indisch-pakistanischen Kontinentalrandes (Arabisches Meer), “Meteor”-Forsch.-Ergebnisse, Reihe C, 9, 1–73, 1972.
Weber, M. E., Niessen, F., Kuhn, G., and Wiedecke, M.: Calibration and application of marine sedimentary physical properties using a multi-sensor core logger, Mar. Geol., 136, 151–172, 1997. Wiggert, J. D., Hood, R. R., Banse, K., and Kindle, J. C.:
Monsoon-driven biogeochemical processes in the Arabian Sea, Prog. Oceanogr., 65, 176–213, 2005.
Woulds, C. and Cowie, G. L.: Sedimentary pigments on the Pakistan margin: Controlling factors and organic matter dynamics, Deep-Sea Res. Pt. II, 56, 347–357, 2009.