Pipistrelle,
Pipistrellus kuhlii,
in the Middle East
Timothy C. Bray*, Osama B. Mohammed, Abdulaziz N. Alagaili
KSU Mammals Research Chair, Department of Zoology, King Saud University, Riyadh, Saudi Arabia
Abstract
Kuhl’s pipistrelle is found from Europe and North Africa all of the way to Asia, yet studies have thus far concentrated on the western limit of its distribution. Here we form a multi-marker picture of the diversity of Kuhl’s pipistrelle at a mid point in the Arabian peninsula in an attempt to redress the western sampling bias and to represent a region from which no genetic data has thus far been presented for this species. The three Arabian Cytochromebhaplotypes showed a clear divergence of 19 substitutions from those found in either Europe or North Africa. Molecular dating suggests the Arabian population split from the remaining Kuhl’s somewhere between 0.7 and 1.7 million years before present around the time of a series of aridification events across northern Africa. Well supported lineages within Arabia are typical of that which may be seen after an expansion from multiple Pleistocene refugia, but may also reflect the loss of intermediate haplotypes during historical population fluctuations. A long-term population contraction coincides with climatic changes towards those conditions more typical of contemporary Arabia.
Citation:Bray TC, Mohammed OB, Alagaili AN (2013) Phylogenetic and Demographic Insights into Kuhl’s Pipistrelle,Pipistrellus kuhlii,in the Middle East. PLoS ONE 8(2): e57306. doi:10.1371/journal.pone.0057306
Editor:Carles Lalueza-Fox, Institut de Biologia Evolutiva - Universitat Pompeu Fabra, Spain
ReceivedNovember 1, 2012;AcceptedJanuary 20, 2013;PublishedFebruary 26, 2013
Copyright:ß2013 Bray et al. This is an open-access article distributed under the terms of the Creative Commons Attribution License, which permits unrestricted use, distribution, and reproduction in any medium, provided the original author and source are credited.
Funding:Funding was provided by the Deanship of Scientific Research at the King Saud University through the research group project number RGP_VPP_020. The funders had no role in study design, data collection and analysis, decision to publish, or preparation of the manuscript.
Competing Interests:The authors have declared that no competing interests exist. * E-mail: tim_c_bray@hotmail.com
Introduction
The Arabian peninsula holds a central position between Africa and Asia as recognised by studies on human movements [1,2]. It represents a junction between Europe and Asia, incorporated into the distributions and migration routes of many species with a Eurasian distribution (e.g. [3]). Despite this central position, Arabia’s restricted connectivity with other land masses is reflected in high levels of endemism among vertebrates, including some
,22% of,476 species found in the Arabian peninsula [4]. The
break of the isthmus spanning the Bab al Mandab strait (,0.5
million years ago (mya) [5]) effectively split Arabia from the Horn of Africa biodiversity hotspot [4]. At this point widespread species occupied a pan-Middle Eastern range and were still moving into the peninsula from Africa as recently as 6000 years before present (e.g. Dorcas gazelle [6]). Climatic variation is likely to have played an important role in driving adaptive evolution within Arabia with aridification increasing isolation and creating desert specialists (e.g. Arabian oryx; [7]). The most recent phase of this aridification is seen from 8500 years before present [8], but it is likely that conditions in Arabia mirrored those seen during the African shift towards more arid conditions as early as 2.8 mya [9].
There is a paucity of data on the eastern extents of many species that have been well studied in Europe, this is particularly true for volant organisms characterised by wide distributions (e.g. bats see [10]). As such, the contributions of Arabian populations to the diversity of these species is largely unknown but potentially interesting. For example, recent attention directed towards the Chiroptera has extended ranges into the Arabian peninsula [11] as well as prompting the description of new species across several families [12,13]. Through their role as bioindicators of ecosystem
health [14], insectivorous bat assemblages can also shed light on understudied human impacts across ecosystems such as from overgrazing and pollution.
Here we focus on Kuhl’s pipistrelle,Pipistrellus kuhlii,a species that is widespread across Europe, Africa and Asia [15]. Radiations in Pipistrellus in the Mediterranean have been attributed to allopatry as a consequence of habitat fragmentation during the Messinian salinity crisis (7.3–5.2 million years ago [16]). Kuhl’s pipistrelle has been shown to comprise two distinct haplogroups in Europe and north Africa [17], but nothing is known of its genetic composition towards the eastern Mediterranean. Currently two sub-species (P. k. kuhlii/P. k. ikhwanius) are described in Arabia, with very little known about the genetic structure of the population of Kuhl’s pipistrelle within the Arabian peninsula [18]. Long-distance flight and migration may result in population admixture in some bat species, but this does not exclude the existence of unique Arabian lineages, as has been seen in other species (e.g. Rhinopoma microphyllum, R. muscatellum[12]).
Methods
Ethics Statement
Handling and euthanasia were conducted humanely accord-ing to the Institutional Animal Care and Use Committee at the University of Arkansas according to protocol number 07002 (permission granted on the 15th of August 2006). Permission for sample collection was granted by the Saudi Wildlife Authority.
Sampling
Pipistrelle bats were caught from 13 roosting sites (n = 51, 1– 6 per location) between 1 and 88 km apart in the Qasim region of the Kingdom of Saudi Arabia. Bats were captured using harp traps and mist nets. Euthanasia was performed by briefly sedating the
animal using xyalzine hydrochloride (RompunH, 20 mg/ml,
Bayer, Leverkusen, Germany) and then followed by intraperito-neal injection of Euthatal (Pentobarbital Sodium 200 mg/ml, Merial, Essex, UK). Animal death was inferred from absence of respiratory movement and heart beat, and when there was loss of colour in mucous membranes.
Molecular Data
DNA extraction was performed from pectoral muscle tissue using Qiagen extraction reagents and separate spin columns (Epoch Life Science). Six microsatellite markers designed in other pipistrelle species were applied; 1–26, L-45, WW6 [19] and PIP01, PIP02, PIP05 [20]. All markers were amplified in multiplex PCR (40 cycles at 60uC annealing temperature) with the exception of 1–26 which was amplified on its own. To confirm genotypes and assess scoring error 10% of genotypes were repeated. The mitochondrial cytochrome b(cytb) gene was amplified using the Molcit/MVZ16 primers [20]. The nuclear recombination activating gene 2 (RAG2) was amplified using F1INT/R1 primers [21]. For both genes PCR was run for 40 cycles at 48uC annealing temperature. Reverse sequences were generated for confirmation.
Phylogenetic Analysis
Sequence data was cleaned and aligned in BIOEDIT [22]. Nucleotide substitutions and translation into amino acids was performed through MEGA5 [23]. The most appropriate nucleo-tide substitution model to apply for the subsequent analyses was determined according to the Akaike Information Criterion (AIC [24]) using JMODELTEST [25]. Neighbour joining trees were constructed and compared between gene regions separately (1000 bootstraps) using MEGA5 [23]. Maximum parsimony haplotype networks were calculated using the TCS [26] application.
Time since divergence of the different geographically separated Kuhl’s pipistrelle lineages was calculated using sequence data through the BEAST application [27]. Both species models (Yule; Birth-death) were tested in addition to all options for the clock models (Strict, Relaxed logarithmic, Relaxed exponential, and Random local), with likelihoods compared in TRACERv1.5 (available in BEAST) over 16108iterations. The model with the highest likelihood was run for 16109 iterations (sampling every 16105). The molecular clock was calibrated using two fossil-dated splits between two pairs of Myotis species; nattereri/schaubi whose split is dated at 6 mya, and bechstenii/daubentoniidated at 5 mya [28]. These species pairs were chosen due to the poor fossil record within Pipistrellus [29]. Sequence data for other Pipistrellus and Myotislineages was also included in the analyses (Table S1; [30– 33]).
Contemporary Spatial Variation
Microsatellite loci were checked for linkage disequilibrium, null alleles, and conformation to Hardy Weinberg. Summary statistics were calculated across all loci. Cryptic population structure was investigated through the clustering algorithm STRUCTURE [34] which was used to group individuals into K homogeneous clusters (populations). We applied the Evanno et al. [35] approach of selection of the K-value corresponding to the mode of the DK distribution. We set K to vary between 1 and 5, and for each K-value we performed 20 simulations with different starting points, having a 105burn-in period followed by 105steps. For each K-value, we calculated the average and standard deviation of the log estimated likelihood [L(K)] across the 20 runs. The program was run under the admixture model, considering correlated allele frequencies. Isolation by distance between groups of individuals at roosting locations was investigated using GENEPOPv4 [36].
Demographic History
A Bayesian approach for detecting and quantifying demo-graphic expansion or contraction was applied in MSVAR 1.3 [37].Contemporary (N1) and ancestral (N0) population sizes and
the time since the start of the demographic event are quantified under an exponential model of population size change. Run priors were log-normal and set to vary in all combinations of 4 and 5 for the parameters N1and N0with standard deviations of 2. Each of
the eight runs was run for 16107iterations with a thinning interval of 16104. The first 10% of each run was removed to avoid any bias of initial conditions before being analysed using in R [38]. Initially each chain was checked by eye for convergence before comparison between chains using the gelman statistic (,1.2). Median estimates were calculated from a concatenated dataset containing the outputs of all runs. The 95% confidence in posterior distributions were calculated between the 2.5% and 97.5% intervals. Generation time for the analysis was calculated using T = (a+b)/2 [39], a being age at maturation, b being longevity. Maturation and longevity were estimated at 1 and 8 years (based on; [40,41]). A second approach, this time for the detection of recent population size changes (either bottleneck or growth; [42]) was also applied to the microsatellite data. This analysis compared 104simulated HE values against the observed
dataset using the Wilcoxon’s signed rank test. Under the recommendation of Peeryet al. [43] that multistep mutations are generally underestimated, we applied only the Two Phase mutational model under the following proportions of multisteps; 0.25, 0.35, and 0.45.
Results
Data Generation and Sequence Characteristics
A total of 780 bp ofcytband 562 bp RAG2 sequence data were generated for 30 individuals. Three haplotypes were determined from cytb representing 10 of the 13 roost locations. Nucleotide diversity incytbwas 0.04, with 10 parsimony informative sites. A single haplotype was identified from 25 individuals in the RAG2 gene, with a single variable site. Sequence data was combined with
both cytb and RAG2 sequences already available (GENBANK
accession numbers for all sequences available in Table S1).
Phylogenetic Analysis
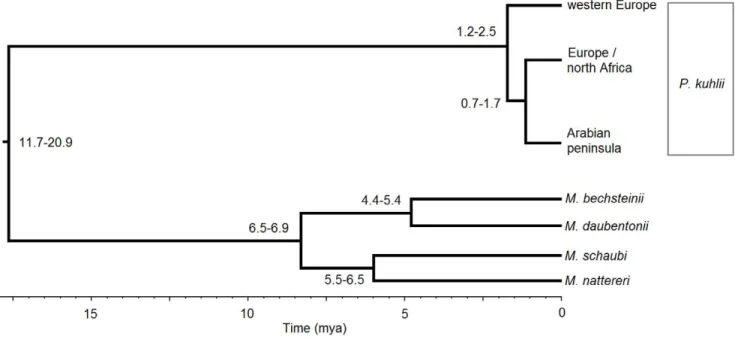
Morocco (data not shown, [44]). The maximum parsimony haplotype network shows that the Arabiancytbhaplogroup is 19 substitutions removed from the closer north African/European haplogroup (Figure 2). For the Drummond and Rambaut [27] approach the highest likelihood was obtained from the Yule species model, using a strict molecular clock (likelihood =22716). The divergence of the western European lineage is the most ancient at 1.8 mya (95% = 1.2–2.5), the split of the Arabian peninsula from north Africa/Europe being 1.2 mya (95% = 0.7– 1.7; Figure 3).
Contemporary Spatial Variation
Five of six microsatellite markers were polymorphic across 51 individuals representing 13 roost locations. No significant signal of linkage disequilibrium was detected and estimates of null allele frequencies were on or below the recommended limit (0.2; [45]). Deviations from Hardy Weinberg and summary statistics are shown in Table S2. The proportion of erroneous allele scorings was estimated at 0.04. There was no evidence of population structure (most likely K = 1) or isolation by distance (p = 0.43, Mantel test 1000 permutations) between roosting locations (data not shown).
Demographic History
The Storz and Beaumont [37] method was used to identify any signal of historical population expansion or decline and to give an estimate of the magnitude and timing of this event. This approach identified a population decline (Figure 4). Current effective population size was estimated to have a median of 360 (CI; 18–2900), ancestral population size 7600 (CI: 790–
1.96105). The time since the decline began was estimated at 3400 years but does not exclude the possibility of a recent dramatic decline in population size (Figure S1; CI: 56–8.16105). For comparative purposes, an approach for specifically in-vestigating recent population expansion or decline was also applied [42]. No significant signal of either a population bottleneck or expansion was detected for any of the three mutation models (data not shown).
Discussion
Arabian Kuhl’s Pipistrelle in a Phylogeographic Context
It is over 2000 km between the Arabian peninsula and the closest previous sampling in this species in either Morocco or Macedonia [44]. Despite this, the Arabian haplotypes show less divergence relative to the northern African/eastern European Kuhl’s pipistrelle than is seen within Europe, with a more recent divergence between the more eastern European and the Arabian lineages compared to western Europe (Figure 3; 0.7–
1.7 vs 1.2–2.5 mya). The cytochrome b sequence data was
partitioned into three haplotypes across ten variable nucleotide positions, with one Arabian haplotype being eight substitutions
removed from the remainder. This large inter-haplotype
difference (average 6.7 steps) may indicate a historical division that is not evident in either the more slowly evolving nuclear RAG2, or the more rapidly evolving microsatellites. This haplotype pattern is suggestive of a period of isolation into separate refugia, or the loss of haplotypes during large fluctuations in population size. Very little information is available for Arabian refugia in other volant organisms (e.g.
Figure 1. A neighbour-joining tree for the Cytochromebgene forPipistrellus kuhliifor the Arabian peninsula, northern Africa, and Europe[44].Consensus bootstrap values are given for nodes over 75.
suggested Arabian refuge for Calidris alpina; [46]) and more sampling over a wider geographic extent would be needed to investigate this further.
We might expect Kuhl’s pipistrelle to follow a similar large-scale pattern of movement to that of P. pipistrellus, which currently occupies a similar circum-Mediterranean range [15]. The estimate for the split in Kuhl’s pipistrelle between western Europe and
Arabia coincides with the time at which P. pipistrellus was
colonising western Europe, indicating favourable conditions for northern expansion (1.6–0.9 mya [29]). But more importantly, the
aridification of northern Africa is likely to have begun to curtail a major route of gene flow from the Plio-Pleistocene boundary, with an increased arid shift from around 2.8 mya [9]. However, this is not enough to explain the entire picture, as circum-Mediterranean movement would have allowed gene-flow through Europe. It is therefore likely that this north African aridification also resulted in subsequent range contraction in Kuhl’s pipistrelle throughout the region and across into Arabia.
Figure 2. A maximum parsimony haplotype network forPipistrellus kuhliibased on 780 bp* of the Cytochromebmitochondrial gene.*For completeness the Canary island haplogroup is included, the information for this group is based on 515 bp and for this reason substitution distances to the other haplogroups are purely putative.
doi:10.1371/journal.pone.0057306.g002
Figure 3. Molecular dating for the divergences within P. kuhlii using the fossil calibrated splits betweenM. nattereri/schaubiandM. bechsteinii/daubentonii.
Contemporary Diversity
Kuhl’s pipistrelle was thought to be the onlyPipistrellusspecies present in the central Arabian sampling area [18]. The genotype data confirmed that all sampled individuals comprised a single breeding population with no indication of structuring by roost or distance. This is not unexpected, as a typical foraging limit inP. pipistrellus in continuous good quality habitat was shown to be
,5 km [47]. This might be expected to be greater in a patchy arid
landscape which would also promote the mixing of individuals from different roosts in localised foraging areas (e.g. vegetated patches, water sources). Other bat species are recognised as commuting to feeding areas up to 25 km away [48]. Longer distance feeding movement and dispersal from natal roosts sites would also erode signal of localised genetic structure, and there is currently no information available on whether this occurs.
Demographic History within Arabia
Population sizes are notoriously difficult to estimate in bats which often still rely on counts during roost emergence [49]. A genetic approach such as this one, allows the calculation of both contemporary and historical population size estimates. Although of restricted value independently, the combination of estimates allow consideration of population trajectories. The Storz and Beaumont [37] approach here detected the signature of a historical population decline in Arabian Kuhl’s pipistrelles (Figure 4).The median estimate for this decline dates it as,3.4 kya subsequent to
a series of precipitation minima in the Arabian peninsula, the most recent being 4.2 kya [50]. This estimated date of decline falls during a period of suggested decline in modern human popula-tions in southern Arabia [50] and before the onset of extremely arid conditions in north Africa associated with expansion of the Sahara desert 1500 years before present [51]. The strongly cyclical occurrence of arid episodes across Africa since the last interglacial period might suggest concurrent conditions in Arabia (latest being 9 kya [52]), perhaps contributing to the uncertainty seen in our population size estimate. Median estimates place the rate of decline at a gradual twenty-fold decrease in numbers over this time. The contemporary boundary for the 95% confidence
interval of this estimate means that we cannot exclude a more recent (and therefore more rapid) population decline. The lack of evidence of a recent population bottleneck (through the Cornuet and Luikart [42] method) does, however, lend support to this not being the case. The effective contemporary population size for the study area is estimated to be up to,3000 individuals (i.e. numbers
of breeding females). Population size estimates appear to be problematic in bats, with none available in the Kuhl’s (or any) pipistrelle. Data on roost size in Pipistrellus ranges from a few individuals in a small tree roost, up to around one thousand in larger caves [53], suggesting that numbers of roosts may not be a good predictor of local population size either. This being the case, our genetic estimate is likely to be of value as a reference for this bat population.
From the molecular estimates it is not possible to exclude more recent causes of bat decline in this region. The vulnerability of bats to human disturbance is well understood [14], and such problems as the deliberate poisoning of water sources remain a contempo-rary problem for all wildlife in Saudi Arabia (e.g. Figure S2). Perhaps most important to bats is their dependency on day roost sites [54]. Insectivorous bat assemblages have suffered from human roost disturbance and poisoning in caves elsewhere in the Middle East, such as west of the river Jordan [55]. The destruction of, and eviction from, disused traditional buildings is a more immediate threat in the Arabian sampling area (Alagaili pers. Obs.). Their utility as indicators of ecosystem degradation [14] suggests that bats can be important as bioindicators. This alone recommends the greater understanding of their habits and population dynamics in this understudied region.
Conclusions
The molecular data presented here suggest that widespread species such as Pipistrellus kuhlii have extensive genetic diversity. The extent of this diversity will clearly only be apparent upon the characterisation of the entirety of their distribution. The new haplogroup described here provides the eastern-most representa-tion of this species to date. The Arabian Kuhl’s pipistrelle appears to have been isolated from the more northern and western populations at least 0.7 mya and may have been contracting since this isolation. Although this decline is gradual we would recommend the long-term monitoring of this and other bat populations in Arabia.
The benefit of applying suites of molecular markers for estimating population size and trajectory is clear. It is also apparent that meaningful demographic signal can be retrieved even with small numbers of microsatellites as applied here, but we suspect that more accurate findings could be generated with more markers. We propose that a genetic approach such as this one will provide a useful comparison for temporal analysis in any given location for monitoring purposes. We do, however, urge caution about the limited transferability of such data between locations or species.
Supporting Information
Figure S1 Time since the beginning of the decline (T) including prior distributions (dashed), calculated ac-cording to the Storz and Beaumont[37]method.
(TIF)
Figure S2 Poison regimen applied to the stream in Wadi Lajab, Asir province, Saudi Arabia (2012).
(TIF)
Figure 4. Ancestral (N1) and current (N0) population size estimates according to the Storz and Beaumont[37]approach.
Priors are shown as dashed (N1) and dotted (N0) lines.
Table S1 Accession numbers for all cytochrome b sequences used in this study including haplotype identifiers and study of origin.
(DOCX)
Table S2 Microsatellite summary statistics for the five poly-morphic loci: Expected heterozygosity (HE), Observed
heterozy-gosity (HO), number of alleles (A), estimate of frequency of null
alleles (Null), and FIS (Probability of significant deviation from
Hardy-Weinberg equilibrium; P,0.05 = *, P,0.01 = **,
P,0.001 = ***). (DOCX)
Acknowledgments
We extend our appreciation to N.C. Bennett for invaluable support with logistics.
Author Contributions
Conceived and designed the experiments: TB. Performed the experiments: TB. Analyzed the data: TB. Contributed reagents/materials/analysis tools: AA. Wrote the paper: AA OM TB.
References
1. Cabrera VM, Abu-Amero KK, Larruga JM, Gonzalez AM (2010) The Arabian peninsula: gate for human migrations out of Africa or cul de sac? A mitochondrial DNA phylogeographic perspective. In: Petraglia MD, Rose JIR editors.The Evolution of Human Populations in Arabia. Springer Netherlands 79–87. 2. Parker AG, Rose JI (2008) Climate change and origins in southern Arabia.
Proceedings of the seminar for Arabian studies 38: 25–42.
3. Newton I (2008) The migration ecology of birds.Academic Press, Elsevier Ltd. London.
4. Mallon DP (2011) Global hotspots in the Arabian peninsula. Zool Middle East Supplement 3: 13–20.
5. Ferguson WW (1981) The systematic position of Gazella dorcas (Artiodactyla :Bovidae) in Israel and Sinai. Mammalia 45(4): 453–458.
6. Lerp H, Wronski T, Pfenninger M, Plath M (2011) A phylogeographic framework for conservation of Saharan and Arabian Dorcas gazelles (Artiodactyla: Bovidae). Org Divers Evol 11: 317–329.
7. Ostrowski S, Williams JB, Mesochina P, Sauerwein H (2006) Physiological acclimation of a desert antelope, Arabian oryx (Oryx leucoryx), to long-term food and water restriction. J Comp Physiol B 176: 191–201.
8. Engel M Bruckner H, Pint A, Wellbrock K, Ginau A, et al. (2012) The early Holocene humid period in NW Saudi Arabia – sediments, microfossils and palaeo-hydrological modelling. Quat Int 266: 131–141.
9. deMenocal PB (1995) Plio-Pleistocene African climate. Science 270: 53–59. 10. Mitchell-Jones AJ, Amori G, Bogdanowics W, Krystofek B, Reijnders PJH, et al.
(1999)Atlas of European mammals. Academic Press, London, pp xi+484. 11. Nader IA (2009) New distributional records of bats from the kingdom of Saudi
Arabia (Mammalia: Chiroptera) J Zool 198(1): 69–82.
12. Benda P, Reiter A, Al-Jumaily M, Nasher AK, Hulva P (2009) A new species of mouse-tailed bat (Chiroptera: Rhinopomatidae: Rhinopoma) from Yemen. Journal of the National Museum Natural History Series 177(6): 53–68. 13. Benda P, Vallo P, Reiter A (2011) Taxonomic revision of the genusAsellia
(Chiroptera: Hipposideridae) with a description of a new species from Southern Arabia. Acta Chiropterol 13(2): 245–270.
14. Jones G, Jacobs DS, Kunz TH, Willig MR, Racey PA (2009) Carpe noctem: the importance of bats as bioindicators. Endang Species Res 8: 93–115. 15. IUCN (International Union for Conservation of Nature) In: IUCN 2011. IUCN
Red list of Threatened Species. Version 2012.1. Available: http://maps. iucnredlist.org/map.html?id = 17314.
16. Hulva P, Fornuskova A, Chudarkova A, Evin A, Allegrini B, et al. (2010) Mechanisms of radiation in a bat group from the genus Pipistrellus inferred by phylogeography, demography and population genetics. Mol Ecol 19: 5417– 5431.
17. Ibanez C, Garcia-Mudarra JL, Ruedi M, Stadelmann B, Juste J (2006) The Iberian contribution to cryptic diversity in European bats. Acta Chiropterol 8(2): 277–297.
18. Harrison DL, Bates PJJ (1991)The mammals of Arabia. London. Ernest Benn Limited.
19. Wei L, Hua P, Shao W, Miller-Butterworth CM, Zhang S (2009) Isolation and characterization of microsatellite loci in the Japanese pipistrelle (Pipistrellus abramus). Conserv Genet 10: 677–679.
20. Racey PA, Barratt EM, Burland TM, Deaville R, Gotelli D, et al. (2007) Microsatellite DNA polymorphism confirms reproductive isolation and reveals differences in population genetic structure of cryptic pipistrelle bat species. Biol J Linn Soc 90: 539–550.
21. Baker RJ, Porter CA, Patton JC, Van Den Busche (2000) Systematics of bats of the family Phyllostomidae based on RAG2 DNA sequences. Occasional Papers Museum, Texas Tech University 202: 1–16.
22. Hall T (2005) BioEdit v 7.0.5. Available: http://www.mbio.ncsu.edu/Bio-Edit/. Accessed 2012 Aug 10.
23. Tamura K, Peterson D, Peterson N, Stecher G, Nei M, et al. (2011) MEGA5: Molecular Evolutionary Genetics Analysis using Maximum Likelihood, Evolutionary Distance, and Maximum Parsimony Methods. Mol Biol Evol 28: 2731–2739.
24. Akaike H (1974) A new look at the statistical model identification. IEEE T Automat Contr 19(6): 716–723.
25. Posada D (2008) JMODELTEST: Phylogenetic model averaging. Mol Biol Evol 25(7): 1253–1256.
26. Clement M, Posada D, Crandall KA (2000) TCS: a computer program to estimate gene genealogies. Mol Ecol 9(10): 1657–1660.
27. Drummond AJ, Rambaut A (2007) BEAST: Bayesian evolutionary analysis by sampling trees. BMC Evol Biol 7: 214.
28. Horacek I, Hanak V (1984) Comments on the systematics and phylogeny of
Myotis nattereri(Kuhl, 1818). Myotis 21–22: 20–29.
29. Hulva P, Horacek I, Strelkov PP, Benda P (2004) Molecular architecture of Pipistrellus pipistrellus/Pipistrellus pygmaeus complex (Chiroptera: Versperti-lionidae): further cryptic species and Mediterranean origin of the divergence. Mol Phylogenet Evol 32: 1023–1035.
30. Pestano J, Brown RP, Suarez NM, Fajardo S (2003) Phylogeography of pipistrelle-like bats within the Canary Islands, based on mtDNA sequences. Mol Phylogenet Evol 26: 56–63.
31. Evin A, Nicolas V, Beuneux G, Toffoli R, Cruaud C, et al. (2011) Geographical origin and endemism of Corsican Kuhl’s pipistrelles assessed from mitochondrial DNA. J Zool 284(1): 31–39.
32. Stadelmann BY, Herrera LG, Arroyo-Cabrales J, Flores-Martinez JJ, May BP, et al. (2004) Molecular systematics of the piscivorous bat Myotis (Pizonyx). J Mammal 85: 103–109.
33. Ruedi M, and Mayer F (2001) Molecular systematics of bats of the Myotis genus (Vespertillionidae) suggests deterministic ecomorphological convergences. Mol Phylogenet Evol 21(3): 436–448.
34. Pritchard JK, Stephens M, Donnelly PJ (2000) Inference of population structure using multilocus genotype data. Genetics 155: 945–59.
35. Evanno G, Regnaut S, Goudet J (2005) Detecting the number of clusters of individuals using the software STRUCTURE: a simulation study. Mol Ecol 14: 2611–20.
36. Rousset F (2008) GENEPOP’007: a complete re-implementation of the GENEPOP software for Windows and Linux. Mol Ecol Resour 8: 103–106. 37. Storz JF, Beaumont MA (2002) Testing for genetic evidence of population
expansion and contraction: an empirical analysis of microsatellite DNA variation using a hierarchical Bayesian model. Evolution 56: 154–166.
38. Ihaka R, Gentleman R (1996) R: a language for data analysis and graphics. J Comput Graph Stat 5: 299–314.
39. Pianka ER (1978)Evolutionary ecology. Harper and Row, New York.
40. Sendor T, Simon M (2003) Population dynamics of the pipistrelle bat: effects of sex, age and winter weather on seasonal survival. J Anim Ecol 72(2): 308–320. 41. Thompson MJA (1987) Longevity and survival of female pipistrelle bats (Pipistrellus pipistrellus) on the Vale of York, England. J Zool 211(2): 209–214. 42. Cornuet JM, Luikart G (1996) Description and power analysis of two tests for detecting recent population bottlenecks from allele frequency data. Genetics 144: 2001–14.
43. Peery MZ, Kirby R, Reid BN, Stoelting R, Doucet-Beer E, et al. (2012) Reliability of genetic bottleneck tests for detecting recent population declines. Mol Ecol 21(14): 3403–3418.
44. Garcia-Mudarra JL, Ibanez C, Juste J (2009) The straits of Gibraltar: barrier or bridge to Ibero-Moroccan Bat diversity? Biol J Linn 96: 434–450.
45. Dakin EE, Avise JC (2004) Microsatellite null alleles in parentage analysis. Heredity 93: 504–509.
46. Hewitt GM (2004) Genetic consequences of climatic oscillations in the quaternary. Philos T Roy Soc B 359(1442): 183–195.
47. Racey PA, Swift SM (1985) Feeding ecology of Pipistrellus pipistrellus (Chiroptera: vespertilionidae) during pregnancy and lactation. 1. Foraging behaviour. J Anim Ecol 54: 205–215.
48. Sahley CT, Horner MA, Fleming TH (1993) Flight speeds and mechanical power outputs of the nectar-feeding bat, leptonycteris-curasoae (phylostomidae, glossophaginae). J Mammal 74: 594–600.
49. Ammerman LK, McDonough M, Hristov NI, Kunz TH (2009) Census of the endangered Mexican long-nosed bat Leptonycteris nivalis in Texas, USA, using thermal imaging. Endanger Species Res 8: 87–92.
50. Parker AG, Goudie AS, Stokes S, White K, Hodson MJ, et al. (2006) A record of Holocene climate change from lake geochemical analyses in southeastern Arabia. Quat Res 66: 465–476.
52. Stokes S, Thomas DSG, Washington R (1997) Multiple episodes of aridity in southern Africa since the last interglacial period. Nature 388: 154–158. 53. Speakman JR, Irwin N, Tallach N, Stone R (1999) Effect of roost size on the
emergence behavior of Pipistrelles. Anim Behav 58: 787–795.
54. Knight T, Jones G (2009) Importance of night roosts for bat conservation: roosting behaviour of the lesser horseshoe batRhinolophus hipposideros. Endang Species Res 8: 79–86.
![Figure 1. A neighbour-joining tree for the Cytochrome b gene for Pipistrellus kuhlii for the Arabian peninsula, northern Africa, and Europe [44]](https://thumb-eu.123doks.com/thumbv2/123dok_br/17309847.249132/3.918.94.598.587.1039/figure-neighbour-joining-cytochrome-pipistrellus-arabian-peninsula-northern.webp)
![Figure S1 Time since the beginning of the decline (T) including prior distributions (dashed), calculated ac-cording to the Storz and Beaumont [37] method.](https://thumb-eu.123doks.com/thumbv2/123dok_br/17309847.249132/5.918.92.445.88.402/figure-beginning-decline-including-distributions-calculated-cording-beaumont.webp)
