Design of Satellite Communications Toolbox for
MATLAB®
Prof. Kiran Parmar 1 , Alpesh Dafda 2
1,2Lalbhai Dalpatbhai College of Engineering, Gujarat Technological University, Navrangpura,
Ahmedabad, Gujarat-380015, India
Email- [email protected], [email protected],
Abstract -This paper introduces a MATLAB® toolbox for Satellite Communications. The SatCom toolbox contains a complete set of necessary functions for parameters calculations of Satellite communications. Along with these functions, few demo programs are designed to illustrate the use of the toolbox, few GUIs are designed for complex calculations and a Simulink model in MATLAB is designed for complete Satellite Link signal level estimation. The whole toolbox is integrated in the overall GUI “SatComToolBox.
Keywords: Sat Com Toolbox; MATLAB®; Math Works; Simulink; GEO; PAS-1R; Prime Meridian; S-functions; Link Budget.
1-INTRODUCTION
Satellite communications is one of the growing fields in the communication area where terrestrial infrastructures are unable or ineffective to supply communication links. During natural disasters where ground services are stopped, satellite communications has great importance. Satellites are present in and impact our lives in more ways than we may realize. From driving a vehicle (GPS), to entertainment (TV), telecommunications (mobile communications) and military strategies (missiles attacks), the importance of satellites in our daily lives is growing. The teaching methods in satellite communications have changed over the years from the simple “lecture-only” format to a more integrated “lecture-laboratory” environment in which practical hands-on issues are taught using software. For effective teaching of Satellite Communications, the lecture component must also make extensive use of computer-based explanations, examples, and exercises. For the past several years, the MATLAB® software developed by The MathWorks [Math Works. in, (2012)], Inc. has established itself as the de facto standard for computations in the engineering field. There are several reasons for this development, but the most important reason is that MATLAB® is available on practically all-computing platforms. Many problems or design algorithms in Satellite Communications require considerable computation. It is for these that MATLAB® provides a convenient tool so that many scenarios can be tried with ease. Such an approach can enhance the learning process.
Satellite communications developed to a tremendous global success in the field of analog and then digital information broadcasting by exploiting the inherent wide-area coverage for the distribution of content. It appeared a “natural” consequence to extend the satellite services for point-to-point multimedia applications, by taking advantage of the ability of satellite to efficiently distribute information over very large geographical areas and of the existing/potential large available bandwidth in the Ku/Ka band. TV Broadcasting via Satellite is perhaps the most common use of geosynchronous satellite. In developing countries where the terrestrial TV distribution is very limited, the communications satellites can be very effectively utilized for TV distribution. Geosynchronous satellites handle a large portion of transcontinental telecommunications traffic. Geosynchronous Satellites along with other NGSO satellites are found to be suitable for reliable mobile communications for ships and aircrafts, as the ship and the aircraft can continuously maintain the communication link with the satellites while moving. However, GEO based satellite systems are much simpler to operate and maintain compared to other system. Geosynchronous Satellites are also the most suitable means of providing reliable and cost effective communications to thin route rural areas, interconnecting small islands, and providing communications to hilly and difficult terrain [Dennis Roddy, (2009)].
357 Design of Satellite Communications Toolbox for MATLAB®
ISSN-2277-1956/V1N2-356-363
array that does not require dimensioning. This allows you to solve many technical computing problems, especially those with matrix and vector formulations, in a fraction of the time it would take to write a program in a scalar non-interactive language such as C or FORTRAN.
The name MATLAB® stands for MATrix LABoratory [Rudra Pratap, (2008)]. MATLAB® was originally written to provide easy access to matrix software developed by the LINPACK and EISPACK projects. Today, MATLAB® uses software developed by the LAPACK and ARPACK projects, which together represent the state-of-the-art in software for matrix computation.
MATLAB® has evolved over a period of years with input from many users. In university environments, it is the standard instructional tool for introductory and advanced courses in mathematics, engineering, and science. In industry, MATLAB® is the tool of choice for high-productivity research, development, and analysis. MATLAB® features a family of application-specific solutions called toolboxes. Very important to most users of MATLAB®, toolboxes allow you to learn and apply specialized technology. Toolboxes are comprehensive collections of MATLAB® functions (M-files) that extend the MATLAB® environment to solve particular classes of problems. Areas in which toolboxes are available include signal processing, control systems, neural networks, fuzzy logic, image processing, antenna engineering and many others [R.P.W. Duin, (2000)], [IEEE, (2004)], [Slideshare.net, (2011)], [Peter I. Corke, (2008)]. Many toolboxes are made for MATLAB® and the number is increasing day by day. In this paper, the design of one such toolbox for Satellite Communications is explained.
2-A BIRD’S EYE VIEW ON DESIGN OF TOOLBOX
The toolbox is mainly intended for use with the commercial MATLAB® package [Newsreader, (2010)]. However, the SatCom MATLAB® toolbox is compiled and tested for different computer architectures including Linux, Windows and Solaris. Most functions provide accurate results upto floating point values. This toolbox is helpful to students and teachers for academic knowledge as well as to Scientists for advanced research and designing of Satellite Communication Link. Future versions will gradually incorporate new results and additional functionalities.
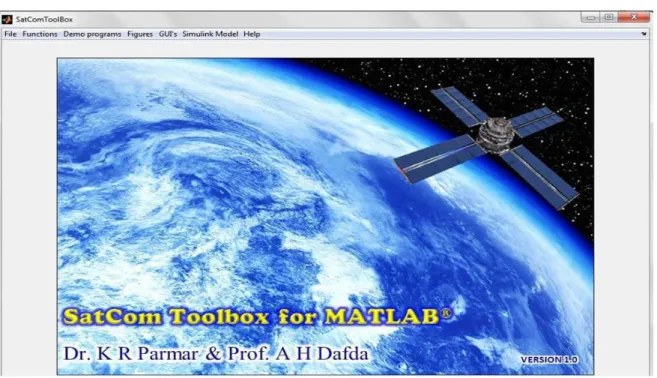
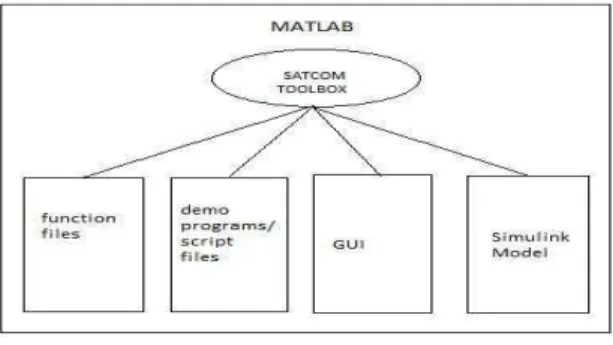
Figure 1 Sat Com Toolbox for MATLAB®
The organization of the toolbox is schematically shown in Figure 1. A number of functions are there for basic and advanced Satellite communication parameters calculations. A number of demo programs illustrate how to use the different features of the toolbox. GUI’s are Graphical User Interfaces designed for the toolbox. A Simulink model in MATLAB® is designed to find the signal strength level in dB at different stages of the communication link.
3-FUNCTION FILES
We can add new functions to the MATLAB® vocabulary by expressing them in terms of existing functions. The existing commands and functions that compose the new function reside in a text file called an M-file. M-files can be either scripts or functions. Scripts are simply files containing a sequence of MATLAB® statements. Functions make use of their own local variables and accept input arguments.
For example the MATLAB® function built for calculating the polarization angle of receiving antenna in a satellite communication link, is of the following form:
The function polarization_angle (la_e,lo_e,lo_s,pt) calculates the angle of polarization Pa of antenna at the earth station ( in degrees). Here la_e is the earth station latitude in degrees, lo_e is the earth station longitude in degrees, lo_s is the satellite longitude or subsatellite point in degrees, pt is the polarization type( 1 for horizontal, 2 for vertical and 3 for elliptical/circular polarization). When the function is called the result of calculation of Polarization angle is stored in variable Pa.
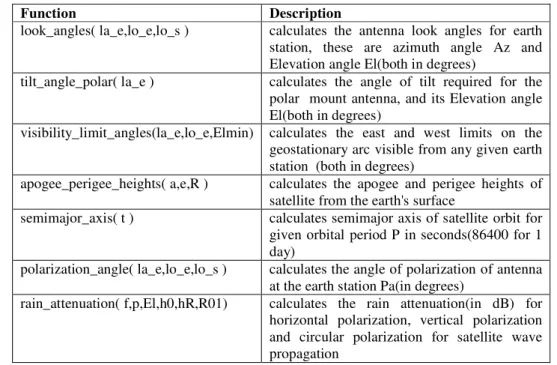
A number of such function m files are created for calculating different parameters related to geostationary satellites. Table 1 shows the names with description of few function files created for this toolbox.
Table 1 Function files of SatCom Toolbox for MATLAB®.
Function Description
look_angles( la_e,lo_e,lo_s ) calculates the antenna look angles for earth station, these are azimuth angle Az and Elevation angle El(both in degrees)
tilt_angle_polar( la_e ) calculates the angle of tilt required for the polar mount antenna, and its Elevation angle El(both in degrees)
visibility_limit_angles(la_e,lo_e,Elmin) calculates the east and west limits on the geostationary arc visible from any given earth station (both in degrees)
apogee_perigee_heights( a,e,R ) calculates the apogee and perigee heights of satellite from the earth's surface
semimajor_axis( t ) calculates semimajor axis of satellite orbit for given orbital period P in seconds(86400 for 1 day)
polarization_angle( la_e,lo_e,lo_s ) calculates the angle of polarization of antenna at the earth station Pa(in degrees)
rain_attenuation( f,p,El,h0,hR,R01) calculates the rain attenuation(in dB) for horizontal polarization, vertical polarization and circular polarization for satellite wave propagation
4-DEMO PROGRAMS
The Demo programs or Script files are normal ASCII (text) files that contain MATLAB® commands. It is essential that such files have names having an extension .m (e.g., Limitation_by_backoff.m) and, for this reason, they are commonly known as m-files.
The commands in these files may then be executed using >> Limitation_by_backoff
In this toolbox also a number of demo programs are included to help user understand the use of functions of the toolbox. Table 2 shows the list of few demo programs included in the toolbox.
Table 2 Demo programs of Sat Com Toolbox for MATLAB®.
Demo Program Description
angle_of_polarization.m used to determine the angle of polarization for an earth station
Equivalent_overall_Temp_rise_interference.m used to calculates the equivalent overall temperature rise(due to earth station and satellite) due to interfering Power Spectral
359 Design of Satellite Communications Toolbox for MATLAB®
ISSN-2277-1956/V1N2-356-363
limits_of_visibility.m used to determine the limits of visibility for an
earth station
look_angle_variation.m used to determine the variation in look angles for Prime Meridian countries for PAS-1R GSAT
The simulation results for one of the demo programs (in tabular form [matlabcentral, (2011)]) look_angle_variation.m is shown in the figure 2. This program is designed to observe the variations in the antenna look angles for the earth station antennas.
Figu The graph signifies that as the la upto 0°, has maximum value at 0° gradually upto Ghana and Togo the l
The efficiency of programs that variables and has complex calculatio use of Graphic User Interfaces (GU programs to be used without any kno A graphic user interface is a MATL For the SatCom toolbox, a GUI mad in the figure 4.
The GUI C_2_No_GUI calculate downlink (C_to_No_D) and Comb variables are to be entered in the ed only numeric input and if alphabet o as zero. After adding the parameters the uplink in dBHz. Similar is the c gives the result for the combined C/N Here in the coding for the result created for uplink, downlink and com the GUI. When the plot pushbutton uplink, downlink and combined.
ure.3 Simulation graph of look_angle_variation.m. la_e changes from 90 east to 90 west (+90 to -90) Az in
0° and then decreases towards -90°. Hence as we go e look angle variations are obtained in the simulation.
5-GRAPHIC USER INTERFACES
at are used often and by several different people and on ations can be improved by simplifying the input and out GUI), which provides facilities such as text boxes, pus nowledge of MATLAB®. They also provide means for TLAB® script file customized for repeated analysis of a
ade for calculating the C/No for the space link power bu
ates, the Carrier to Noise power spectral density ratio fo bined (C_to_No_Combined) for the Link Budget Ca edit text boxes of the GUI. The unique feature of this t
t or any other character is given as the input, it doesn’t ac ers for Uplink, when the pushbutton C_to_No_U is pres
e case for the downlink. When the pushbutton C_to_N /No.
lt calculations, the complete coding is not written but ra ombined are called. Hence the functions written for the ons are pressed, respective variations in C/No are plott
z increases. Also El increases go from UK to France and
one that requires many input output data management. The pushbuttons, axes etc, allows or efficient data management. f a specific type of problem. budget calculations is shown
for the uplink (C_to_No_U), Calculations. The values of s text boxes is that it accepts t accept it and keeps the input ressed, it shows the result for _No_Combined is pressed, it
Design of Satellite Communication
ISSN-2277-1956/V1N2-356-363 Figu
Graphic Simulink is a toolbox of systems. Here, in SatCom Simulink two S- functions[iwt-kdg, (2012)], th link starting from the transmitter to Sklar, (2000)]. The values of differe and changing the values. Level two multiple outputs. The reason of usin done with ease. For example say a l block created using level-2 S-functi additional functionalities can be ins examine potential system tradeoffs: m SatCom link signal level Simulink m
Suppose a system engineer is c constraints within the transmitting e design point). The engineer then mi may consider some additional trade o
ions Toolbox for MATLAB®
gure 4 GUI For C/No in Power Budget Calculations.
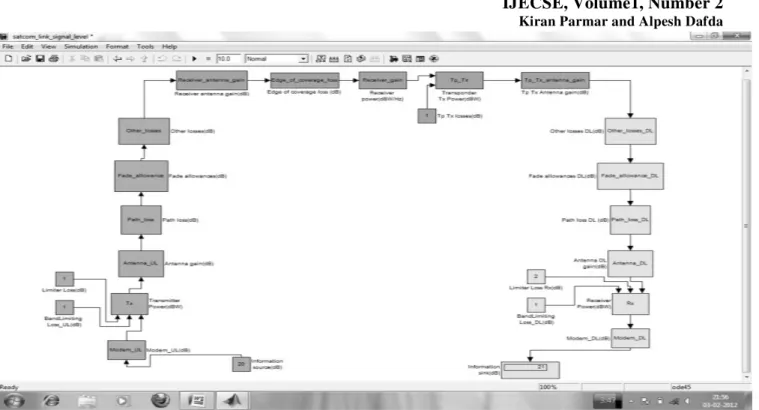
6-SatCom Simulink Model
of MATLAB® that can be used for modelling, analysin k model, a Satellite communication Simulink model is d , that shows the signal level in dB at different points in th to the satellite and back to the earth station receiver[J erent losses can be changed easily by simply double cli o S-functions are used to create the Simulink blocks tha sing level two S-functions is that the necessary modific a loss component is to be inserted in the downlink rece ction, it is easier to modify the block rather than with a inserted in a Level-2 S-function Block. With such a li s: margin versus noise figure, antenna size versus transm model is shown in figure 5.\
s concerned that a 500 W transmitter is not practical g earth terminal or that such a transmitter makes the sy might consider a trade-off of transmitter power versus t
e off such as antenna size.
361
sing and simulating dynamic s designed using m files level n the Satellite communication r[J Proakis, (2001)],[Bernard clicking on respective blocks that have multiple inputs and fications in the model can be eceiving antenna, then with a h a Level-1 S-function. Also link budget model one can smitter power and so on. The
F
Figure 6 shows the overall GUI done. Any function, program, graph the whole SatCom toolbox. The Sat window.
The overall GUI has got the Men Help. The utility of these menus is as
1. File Menu: It has got m open any file in the M SatCom ToolBox.
2. Functions Menu: It is us
3. Demo Programs Menu: 4. Figures Menu: Is used t
Communications.
5. GUI’s Menu: It is used t
6. Simulink Model Menu: which the model opens a 7. Help Menu: Has the hel
Figure 5 SatCom Link Signal Level Simulink Model
7-OVERALL GUI(SATCOMTOOLBOX)
UI of the SatCom ToolBox. In this GUI the overall inte ph or GUI can be accessed from here. Hence the overall
atCom toolbox can be opened directly by typing SatCom
enus namely File, Functions, Demo Programs, Figures, G as under:
t menu items Open, Print and Close. As the name sugg MATLAB®, Print for taking out the print of the file
used to open any function file of the SatCom ToolBox.
u: Is used to open the demo programs of the SatCom Too d to open the *.m file, executing which draws the plots
d to open the different GUI’s created for the SatCom Too
u: It has the Menu Item SatCom Link Signal Level Sim s and it can be run from there.
elp pertaining to the SatCom Toolbox items.
integration of the ToolBox is all GUI is the ultimate link to omToolBox in the command
, GUI’s, Simulink Model and
ggests, Open can be used to ile and Close for closing the
ToolBox.
ots/graphs related to Satellite
oolBox.
363 Design of Satellite Communications Toolbox for MATLAB®
ISSN-2277-1956/V1N2-356-363
Figure 6 Overall GUI of SatComToolBox
8-CONCLUSIONS
This paper describes broadly the capacities and use of a MATLAB® Toolbox for Satellite Communications. Its main differential characteristic is that it is very easy to use. The toolbox has been designed as a tool for students, teachers and researchers. The SatCom toolbox can be used with any version of MATLAB®, and will run on most hardwares. The SatCom Simulink model designed to calculate the link budget stands out in its ability to provide overall system insight. By examining the link budget, one can learn many things about the overall system design and performance. The overall GUI “SatComToolBox” helps to access any part of the toolbox directly and integrates the whole toolbox.
REFERENCES
[1]. www.Mathworks.in
[2]. Rudra Pratap, Getting started with MATLAB® 7 (A quick introduction for Scientists and Engineers), Oxford University Press, 2008 reprint.
[3]. Dennis Roddy, Satellite Communications, Tata McGraw Hill, Fourth Edition 2009 [4]. R.P.W. Duin. Prtools, A MATLAB® toolbox for pattern recognition, 2000.
[5]. J. Proakis, Digital Communications, McGraw-Hill, New York, NY, USA, 4th edition, 2001
[6]. IEEE International Conference on Robotics and Automation, “Design and implementation of Scilab fuzzy logic toolbox”, 2004, http://www.mendeley.com/research/design-implementation-scilab-fuzzy-logic-toolbox/#
[7]. Slideshare.net, “Neural Network Toolbox”,2011, http://www.slideshare.net/mentelibre/neural-network-toolbox-MATLAB® /download
[8]. Peter I. Corke, “The Robotics Toolbox for MATLAB® “, 2008, http://www.petercorke.com/RTB/ARA95.pdf [9]. www.iwt-kdg.be/personeel/Paillet%20Eric/dsp/sfunctionref.pdf
[10]. Newsreader - MATLAB® Central,”Make your own MATLAB® toolbox”
-www.mathworks.de/MATLAB®central/newsreader/view_thread/270366
[11]. Bernard Sklar, Digital Communications, Fundamentals and Applications, Second edition, 2000. [12]. http://www.boeing.com/defense-space/space/bss/factsheets /702 / pas_1r / pas_1r.html
![Graphic Simulink is a toolbox of systems. Here, in SatCom Simulink two S- functions[iwt-kdg, (2012)], th link starting from the transmitter to Sklar, (2000)]](https://thumb-eu.123doks.com/thumbv2/123dok_br/17279077.247380/6.892.112.774.185.461/graphic-simulink-toolbox-systems-simulink-functions-starting-transmitter.webp)