BGD
11, 12137–12157, 2014
Validation of the Thorpe scale-derived
vertical diffusivities
Y.-H. Park et al.
Title Page
Abstract Introduction
Conclusions References
Tables Figures
◭ ◮
◭ ◮
Back Close
Full Screen / Esc
Printer-friendly Version
Interactive Discussion
Discussion
P
a
per
|
Discus
sion
P
a
per
|
Discussion
P
a
per
|
Discussion
P
a
per
|
Biogeosciences Discuss., 11, 12137–12157, 2014 www.biogeosciences-discuss.net/11/12137/2014/ doi:10.5194/bgd-11-12137-2014
© Author(s) 2014. CC Attribution 3.0 License.
This discussion paper is/has been under review for the journal Biogeosciences (BG). Please refer to the corresponding final paper in BG if available.
Validation of the Thorpe scale-derived
vertical di
ff
usivities against
microstructure measurements in the
Kerguelen region
Y.-H. Park1, J.-H. Lee2, I. Durand1, and C.-S. Hong2 1
MNHN-Sorbonne Universités (UPMC, Univ Paris 06)-CNRS-IRD, LOCEAN Laboratory, Muséum National d’Histoire Naturelle, 43, rue Cuvier, 75005 Paris, France
2
Korea Institut of Ocean Science & Technology, Ansan, Korea
Received: 2 June 2014 – Accepted: 10 June 2014 – Published: 8 August 2014
Correspondence to: Y.-H. Park ([email protected])
BGD
11, 12137–12157, 2014
Validation of the Thorpe scale-derived
vertical diffusivities
Y.-H. Park et al.
Title Page
Abstract Introduction
Conclusions References
Tables Figures
◭ ◮
◭ ◮
Back Close
Full Screen / Esc
Printer-friendly Version
Interactive Discussion
Discussion
P
a
per
|
Discus
sion
P
a
per
|
Discussion
P
a
per
|
Discussion
P
a
per
|
Abstract
The Thorpe scale is an energy containing vertical overturning scale of large eddies as-sociated with shear generated turbulence. We make here indirect estimates of vertical diffusivities from the Thorpe scale method in the Polar Front region east of the Ker-guelen Islands based on fine scale density profiles gathered during the 2011 KEOPS2
5
cruise. These are validated in comparison with diffusivities estimated from the turbu-lence dissipation rate directly measured via a TurboMAP microprofiler. The results are sensitive to the choice of the diffusivity parameterization and the Gargett and Garner’s (2008) overturn ratioRo, with the optimal results showing an agreement within a factor
of 4, on average, having been obtained from the parameterization by Shih et al. (2005)
10
and theRo=0.25 criterion.
The Thorpe scale-derived diffusivities in the KEOPS2 region show a high degree of spatial variability, ranging from a canonical value of O(10−5m2s−1) in the Winter Water
layer and in the Subantarctic surface waters immediately north of the Polar Front to a high value of O(10−4m2s−1) in the seasonal thermocline just below the surface mixed
15
layer. The latter values are found especially over the shallow plateau southeast of the Kerguelen Islands and in the Antarctic surface waters associated with the Polar Front attached to the escarpment northeast of the islands.
1 Introduction
Vertical mixing is a dominant factor in controlling vertical fluxes of heat, salt, and
nutri-20
ents, so the estimation of vertical (or diapycnal) diffusivities especially in the upper layer of the ocean was one of the primary priorities of the physical component of the KEOPS2 cruise. During the cruise, direct turbulence measurements were made at selected sta-tions using a tethered quasi-freefall profiler, TurboMAP, measuring the microstructure of velocity shear. An indirect method for estimating vertical diffusivities using more
ac-25
BGD
11, 12137–12157, 2014
Validation of the Thorpe scale-derived
vertical diffusivities
Y.-H. Park et al.
Title Page
Abstract Introduction
Conclusions References
Tables Figures
◭ ◮
◭ ◮
Back Close
Full Screen / Esc
Printer-friendly Version
Interactive Discussion
Discussion
P
a
per
|
Discus
sion
P
a
per
|
Discussion
P
a
per
|
Discussion
P
a
per
|
method (Thorpe, 1977). The objective of this study is to estimate the vertical diff usivi-ties from fine scale density profiles using the Thorpe scale method and validate them in comparison with microstructure measurements collected via a TurboMAP during the KEOPS2 cruise.
The performance of the Thorpe scale method compared to microstructure estimates
5
has been known to depend on the stratification of the water column and surface en-vironment conditions affecting the ship motion. While good agreement between the two methods has been reported in low-latitude regions of high stratification and low winds (Ferron et al., 1998; Klymak et al., 2008), the application of the Thorpe scale method in the Southern Ocean can be compromised because of low stratification and
10
extreme environments (Frants et al., 2013). The latter authors reported that the CTD-based fine structure methods overestimate microstructure diffusivities by one to two orders of magnitude in the southeastern Pacific and Drake Passage, claiming their real limitations in the Southern Ocean.
Another intriguing issue concerns the existence of two different parameterizations of
15
vertical diffusivity K in terms of turbulence dissipation rateεand buoyancy frequency N. Note that N2=−(g/ρ0)ρz, where g is gravity, ρ0 is a constant reference density,
andρz is a vertical gradient of potential density calculated at each depth over a vertical extent of 10 m.
For example, Osborn (1980) suggested a well-known parameterization as
20
K=0.2ε/N2. (1)
On the other hand, Shih et al. (2005) recently proposed, based on the laboratory and numerical experiments, a new parameterization for the energetic turbulence regime (ε/νN2>100) as
25
K=2ν(ε/νN2)1/2, (2)
where v=(1.5–1.8) 10−6m2s−1 is the kinematic viscosity in the temperature range of 0–5◦C and ε/νN2
moder-BGD
11, 12137–12157, 2014
Validation of the Thorpe scale-derived
vertical diffusivities
Y.-H. Park et al.
Title Page
Abstract Introduction
Conclusions References
Tables Figures
◭ ◮
◭ ◮
Back Close
Full Screen / Esc
Printer-friendly Version
Interactive Discussion
Discussion
P
a
per
|
Discus
sion
P
a
per
|
Discussion
P
a
per
|
Discussion
P
a
per
|
ate turbulence intensity regime (7< ε/νN2<100), the parameterization of K by Shih et al. (2005) is same as Eq. (1) proposed by Osborn (1980).
While the TurboMAP measurements lead to direct estimates ofε, the Thorpe scale method gives its indirect estimates by making use of an empirical relationship between the Thorpe scale andε. These two (direct and indirect) estimates of εcan be applied
5
to the above two parameterizations ofK, yielding a total of four kinds of estimates at each station of intercomparison. Because of their utmost importance, the detailed pro-cedures for the preliminary processing of CTD data as well as for the detection and validation of overturns for calculating the Thorpe scale are given in Sect. 2. These are largely based on a comprehensive paper by Gargett and Garner (2008), although we
10
have added some modifications. We will show in Sect. 3 that the results are sensitive to the choice of theK parameterization and to the criteria of the overturn validation. In Sect. 4 we present vertical diffusivities in the KEOPS2 area estimated from the op-timally chosen parameterization and overturn ratio. The concluding remarks are given in Sect. 5.
15
2 Preliminary processing of CTD data
CTD data used for deriving fine scale density profiles were collected during the October–November 2011 KEOPS2 cruise aboard the R/VMarion Dufresnein the Polar Front region east of the Kerguelen Islands (Park et al., 2014, for details of the regional hydrography and frontal circulation). We used here a total of 22 CTD profiles gathered
20
using two sets of Sea-Bird SBE 9plus sensors at stations shown in Fig. 1, where the concomitant TurboMAP stations are shown circled. The CTD profiles mostly extend from the surface to the bottom, while the TurboMAP measurements to about 400 m from the surface, limiting our validation of the Thorpe scale method to the top 400 m.
A critical step to a successful validation of the latter method resides in the
minimiza-25
spik-BGD
11, 12137–12157, 2014
Validation of the Thorpe scale-derived
vertical diffusivities
Y.-H. Park et al.
Title Page
Abstract Introduction
Conclusions References
Tables Figures
◭ ◮
◭ ◮
Back Close
Full Screen / Esc
Printer-friendly Version
Interactive Discussion
Discussion
P
a
per
|
Discus
sion
P
a
per
|
Discussion
P
a
per
|
Discussion
P
a
per
|
ing caused by the differing time responses of the temperature and conductivity sensors (e.g. Gargett and Garner, 2008). A series of procedures for processing CTD data are given below.
1. For minimizing thermal lag arising from the conductivity cell thermal mass effects, the raw CTD data have been first processed using the Sea-Bird processing
soft-5
ware (http://www.seabird.com/pdf_documents/manuals/SBEDataProcessing_7. 23.2.pdf). The data processing module “Cell Thermal Mass” performs conductivity thermal mass correction, for which we used typical values (α=0.03; 1/β=7.0) recommended for SBE 9plus.
2. Salinity spiking, which can be caused by misalignment of temperature and
con-10
ductivity with each other, was removed on acquisition from a pre-programmed SBE 9plusdeck unit by advancing conductivity by 0.073 s. Therefore, there is no need to run the data processing module “Align CTD”.
3. Due to the effect of the ship heave motion on the hard-coupled CTD, the fall speed of CTD continuously varies while scanning and can occasionally reverse sign for
15
short periods. We located segments of pressure reversals and edited out the data between successive encounters of the same pressure, although such can be also done via the data processing module “Loop Edit”.
4. At this stage, the CTD conductivity and salinity data were corrected with water bottle salinity previously analyzed using a salinometer.
20
5. In order to further minimize any spike-like anomalies in property (salinity, potential temperature, potential density) profiles, we applied a quadratic fit to successive 10 m segments to detect and discard “extremely abnormal” anomalies surpassing 4 times the root mean square (rms) anomaly relative to the fitting curve. About 0.03 % of total scans are eliminated by this process.
25
BGD
11, 12137–12157, 2014
Validation of the Thorpe scale-derived
vertical diffusivities
Y.-H. Park et al.
Title Page
Abstract Introduction
Conclusions References
Tables Figures
◭ ◮
◭ ◮
Back Close
Full Screen / Esc
Printer-friendly Version
Interactive Discussion
Discussion
P
a
per
|
Discus
sion
P
a
per
|
Discussion
P
a
per
|
Discussion
P
a
per
|
window that is centered at each depth incremented by a regular span of 10 cm. On average, about 2–3 scans enter into this 10 cm averaging, which is roughly consistent with a mean fall rate of∼0.9 m s−1of our 24 Hz CTD. This filters out any
high-frequency random noise of a length scale less than 10 cm, thus the smallest detectable overturn should be of 20 cm in vertical extent. Note also that most
5
density profiles start from 20 m below the sea surface because the near-surface measurements are often found to be much contaminated probably by turbulence generated by the hull. These processed density profiles form our basic data set used in the following section.
3 Thorpe scale analysis 10
3.1 Thorpe scale and vertical diffusivity
A first step for detecting overturns generated by turbulence in a stratified water column consists of sorting a potential density profileρ(z), which may contain inversions, into a stable monotonic sequence without inversions. The vertical displacement necessary for generating the stable profile is the Thorpe displacementζ, and the Thorpe scaleLT
15
is defined as the rms ofζwithin each overturn that is a region over which the sum ofζ drops back to zero (Dillon, 1982).
On the other hand, a classical measure of the overturning length is the Ozmidov scaleLO(Ozmidov, 1965) defined as
ε=L2ON3. (3)
20
Dillon (1982) suggested a linear relationship betweenLTandLO, such as
LO=0.8(±0.4)LT, (4)
although an exact linear relation between these two overturning scales cannot be
ex-25
BGD
11, 12137–12157, 2014
Validation of the Thorpe scale-derived
vertical diffusivities
Y.-H. Park et al.
Title Page
Abstract Introduction
Conclusions References
Tables Figures
◭ ◮
◭ ◮
Back Close
Full Screen / Esc
Printer-friendly Version
Interactive Discussion
Discussion
P
a
per
|
Discus
sion
P
a
per
|
Discussion
P
a
per
|
Discussion
P
a
per
|
Inserting Eqs. (3) and (4) into Eqs. (1) and (2), the vertical diffusivity can be estimated indirectly fromLT as
K=0.128L2TN, (5)
according to the Osborn parameterization, and as
5
K=1.6ν1/2LTN1/2, (6)
according to the Shih parameterization. We give below a series of procedures neces-sary for an optimal estimation ofLT, thus ofK from the Thorpe scale method.
3.2 Determination of a threshold noise level of density 10
The major concern in the overturn validation is whether the identified overturns are false overturns associated with random noise and/or residual effects of salinity spiking. To prevent false overturns due to random noise, we followed an intermediate density profile method proposed by Gargett and Garner (2008) who modified a profile process-ing method of Ferron et al. (1998). The Gargett and Garner’s method tracks only
signifi-15
cant differences in the density profile, where a significant difference is defined relative to a threshold noise level below which a density difference is considered as due to random noise. For this purpose, we have calculated the rms of detrended density anomalies over successive 10 m segments for selected “well-mixed” layers within the cruise data set. This yielded a mean value of 1.75×10⁻⁴kg m−3. We considered a multiple of 4 of 20
the latter value, 7×10⁻⁴kg m−3, as our threshold noise level. Note that the latter value
is close to 5×10⁻⁴kg m−3of Gargett and Garner (2008) who applied instead a multiple
of 5 to a slightly smaller mean rms density anomaly of 1.0×10⁻⁴kg m−3 obtained in
the Ross Sea region using a similar SBE 9plusCTD.
3.3 Creation of an intermediate density profile 25
BGD
11, 12137–12157, 2014
Validation of the Thorpe scale-derived
vertical diffusivities
Y.-H. Park et al.
Title Page
Abstract Introduction
Conclusions References
Tables Figures
◭ ◮
◭ ◮
Back Close
Full Screen / Esc
Printer-friendly Version
Interactive Discussion
Discussion
P
a
per
|
Discus
sion
P
a
per
|
Discussion
P
a
per
|
Discussion
P
a
per
|
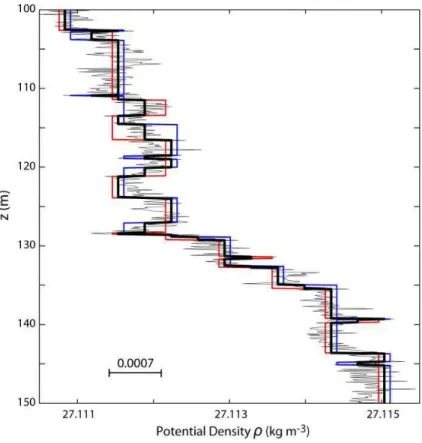
speaking, an intermediate profile is created first from the top to the bottom, maintaining a constant density until a density change greater than the threshold value. A similar profile starting from the bottom to the top is also created and a finale intermediate profile used here is the average of the two individual (downward and upward) profiles. An example of this procedure for determining an intermediate density profile is shown
5
in Fig. 2.
3.4 Validation of overturns
Gargett and Garner (2008) reviewed several previous methods of overturn validation and proposed a practical method using an overturn ratio,Ro=min(L+/L,L−/L), where
Lis the total vertical extent of an overturn andL+(L−) is the cumulative extent occupied 10
by positive (negative) Thorpe displacementsζ. These authors found theT–S tightness method suggested by Galbraith and Kelly (1996) unsatisfactory and did not recommend any further rejection based on any measure of T–S tightness. Gargett and Garner (2008) reasoned that a single perfect overturn sampled straight through the middle would contain equal lengths of positive and negative ζ (or Ro=0.5), and suggested
15
a critical Ro value of 0.2, below which the prospect overturn is suspected of being
caused by residual salinity spiking.
We found that this criterion (Ro=0.2) is not sufficient in our case, but the use of
Ro=0.25 at least is rather necessary to detect the false overturns associated with
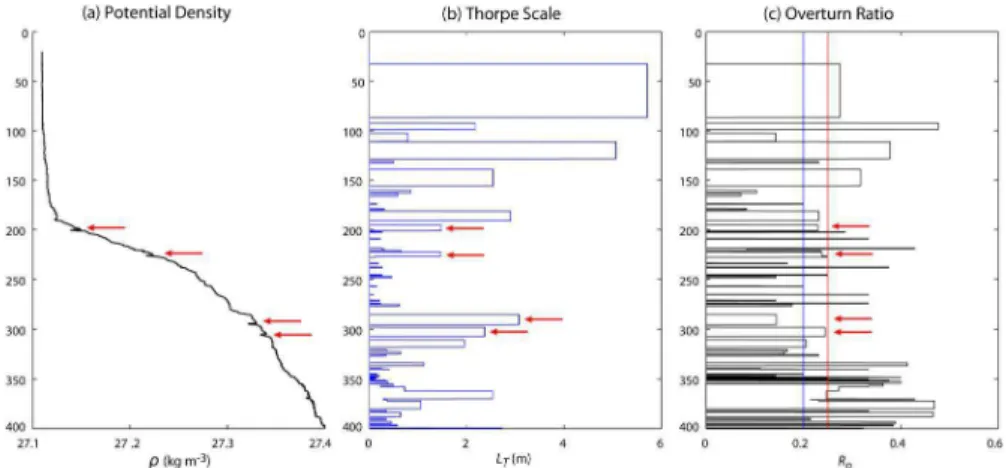
suspicious salinity spiking. An example is given in Fig. 3 for station A3-1, where we
20
observe four most apparent density spikes as indicated by arrows. The first two spikes near 200 and 225 m pass marginally the (Ro=) 0.25 criterion but not the 0.2 criterion.
The third spike just above 300 m passes without difficulty even the 0.2 criterion, while for the spike just below 300 m, the 0.25 criterion appears to be absolutely necessary. In summary, all four suspected false overturns can be safely detected only by our new
25
criterion, Ro=0.25. We will show below that these four suspicious overturns really
BGD
11, 12137–12157, 2014
Validation of the Thorpe scale-derived
vertical diffusivities
Y.-H. Park et al.
Title Page
Abstract Introduction
Conclusions References
Tables Figures
◭ ◮
◭ ◮
Back Close
Full Screen / Esc
Printer-friendly Version
Interactive Discussion
Discussion
P
a
per
|
Discus
sion
P
a
per
|
Discussion
P
a
per
|
Discussion
P
a
per
|
3.5 Sensitivity of the vertical diffusivity to its parameterization
With the Thorpe scalesLT obtained based on the Ro=0.25 criterion, we have
calcu-lated vertical diffusivities from the Osborn and Shih parameterizations (Eqs. 5 and 6), denoted hereafter as KO_T and KS_T, respectively. The regions where no overturns
are detected do not necessarily mean no vertical mixing, as already remarked by
Fer-5
ron et al. (1998), but our method cannot resolve tiny overturns smaller than 20 cm, as mentioned in Sect. 2. In this case the corresponding diffusivities are set to 10−5m2s−1,
a value close to the minimum of the TurboMAP-derived diffusivities in our study area. The resulting diffusivities have been averaged over regular vertical intervals of 10 m. These Thorpe scale-derived diffusivities at station A3-1, as an example, are compared
10
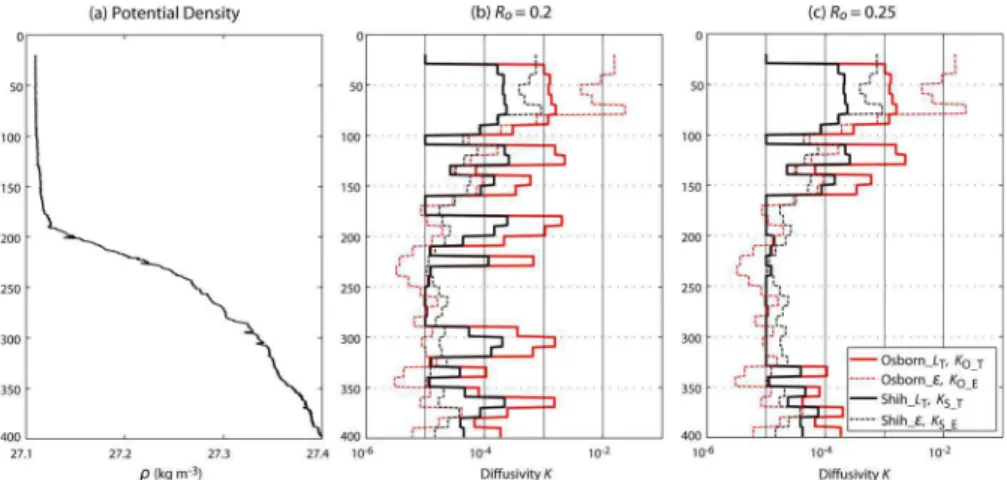
in Fig. 4 with those calculated according to Eqs. (1) and (2) using the TurboMAP-derived ε, denoted hereafter as KO_E andKS_E, respectively (Fig. 4c). We also show
in the same figure KO_T and KS_T estimated using the Ro=0.2 criterion, always in
comparison with KO_E and KS_E (Fig. 4b). Several interesting features appear. First,
the Thorpe scale-derived diffusivities for the case ofRo=0.2 are systematically
over-15
estimated compared to the TurboMAP-derived diffusivities by up to one to two orders of magnitude in the layer below 80 m, while the converse is true above it in the sur-face mixed layer. Second, such an overestimation or underestimation in the Thorpe scale-derived diffusivities is much more pronounced by an order of magnitude with the Osborn parameterization (KO_T) compared to the Shih parameterization (KS_T). Third,
20
the TurboMAP-derived diffusivities from both parameterizations (KO_EandKS_E) agree
with each other within a factor of 2, on average, except for the surface mixed layer where the difference reaches up to an order of magnitude. As compared toKS_E, there
appears a tendency of great overestimation (slight underestimation) ofKO_Ein the
sur-face mixed layer (deeper layer below 80 m). Finally, we observe the efficiency of our
25
new overturn validation criterion,Ro=0.25 (see Fig. 4c), which yields a much closer
overestima-BGD
11, 12137–12157, 2014
Validation of the Thorpe scale-derived
vertical diffusivities
Y.-H. Park et al.
Title Page
Abstract Introduction
Conclusions References
Tables Figures
◭ ◮
◭ ◮
Back Close
Full Screen / Esc
Printer-friendly Version
Interactive Discussion
Discussion
P
a
per
|
Discus
sion
P
a
per
|
Discussion
P
a
per
|
Discussion
P
a
per
|
tion in the Thorpe scale-derived diffusivities (as compared to microstructure diff usivi-ties). This confirms our previous conviction that the four suspected overturns represent really false overturns, however, these overturns escape from detection withRo=0.2
but not withRo=0.25. We have verified similar features in several other stations too,
and we will use hereafter uniquely the latter criterion for the detection of false overturns.
5
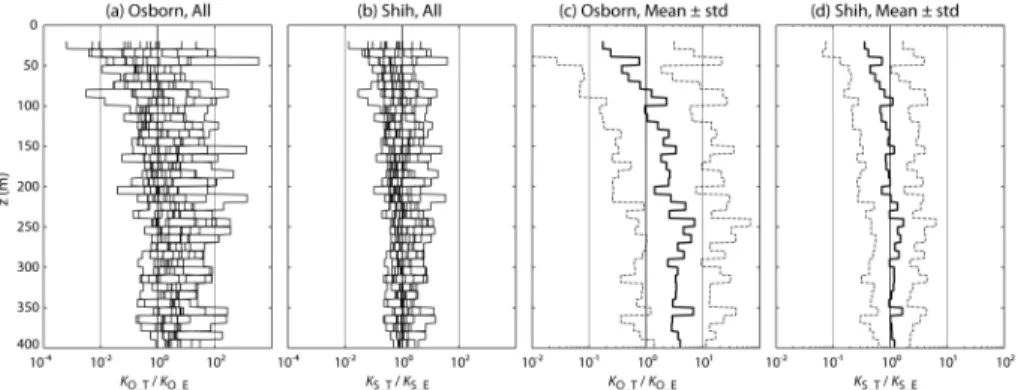
In order to statistically evaluate the sensitivity of the vertical diffusivity to its param-eterization, we have calculated for all intercomparison stations and depths the ratio of the Thorpe scale-derived diffusivities and the TurboMAP-derived diffusivities, sepa-rately using the Osborn parameterization (KO_T/KO_E) and the Shih parameterization
(KS_T/KS_E) (Fig. 5). There is a clear tendency of overestimation by the Osborn
param-10
eterization especially in the layer deeper than 100 m by up to two orders of magnitude or more (Fig. 5a). Such is much less evident with the Shih parameterization which shows a comparatively much compact variability of ratio within one order of magni-tude around the unity (Fig. 5b). On the other hand, in the surface layer above 100 m there is an increasing negative tendency toward the surface for both parameterizations,
15
as already mentioned. This is probably due to a very low stratification of the surface mixed layer, which prevents to detect moderate overturns whose density differences are smaller than our threshold noise level of 7×10⁻⁴kg m−3.
Assuming a log-normal distribution of diffusivity ratios Rdif, the mean and standard
deviation (std) of log (Rdif) have been used for representing the basic statistics ofRdif.
20
With the Osborn parameterization (Fig. 5c), the Thorpe scale-derived diffusivities below 200 m overestimate (compared to the TurboMAP-derived diffusivities) by a mean Rdif
of ∼4, with a (±1 std) variability range of (0.7, 20), on average. The overestimation
gradually diminishes toward the surface and changes its sign near 80 m to show a near surface peak of underestimation, with a meanRdifof∼0.2 (0.01, 5). In contrast to this,
25
the Shih parameterization (Fig. 5d) yields a much reasonable agreement, with a mean Rdif close to the unity (0.3, 3) over most of the water column, except for the surface
layer showing always a general but somewhat reduced tendency of underestimation by
BGD
11, 12137–12157, 2014
Validation of the Thorpe scale-derived
vertical diffusivities
Y.-H. Park et al.
Title Page
Abstract Introduction
Conclusions References
Tables Figures
◭ ◮
◭ ◮
Back Close
Full Screen / Esc
Printer-friendly Version
Interactive Discussion
Discussion
P
a
per
|
Discus
sion
P
a
per
|
Discussion
P
a
per
|
Discussion
P
a
per
|
rather than the Osborn parameterization, is highly desirable in the estimation of vertical diffusivities.
4 Thorpe scale-derived vertical diffusivities in the KEOPS 2 area
For all KEOPS2 density profiles, we have estimated the Thorpe scale-derived vertical diffusivities K by applying the overturn criterion Ro=0.25 and the Shih
parameteri-5
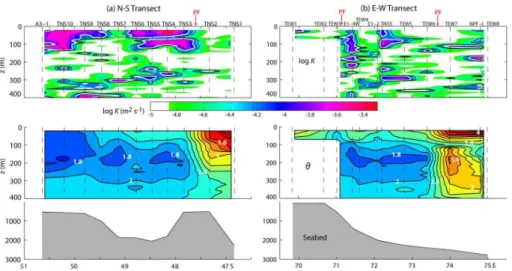
zation. Figure 6a and b represent the spatial distribution ofK in the top 400 m along the approximately north–south (N–S) and east–west (E–W) oriented transects, respec-tively (see Fig. 1 for the position of stations). The 50 m depth-averagedK values are given in Table 1. Care is warranted to cite the values for the top 50 m depth range because of the above-mentioned underestimation tendency; a multiplication by 2 to 3
10
is rather recommended. TheK distribution is highly heterogeneous in both the verti-cal and horizontal directions, varying from a low level of<2×10⁻⁵m2s−1 (areas with
no color shading) to a relatively high level of >10−4m2s−1 (areas encircled by white lines). The spatialK distribution appears to have some correlation with the regional frontal circulation carrying different water masses. For example, in the N–S transect
15
(Fig. 6a) the areas of elevated diffusivities are mostly confined in the seasonal ther-mocline (<150 m) above the Winter Water core developed to the south of the Polar Front, with the exception over the continental slope east of the Kerguelen Islands (Sts. TNS 7–9) where the diffusion rate is low. The strongest diffusivities are found over the shallow plateau (∼600 m) southeast of the islands (Sts. TNS 10 and A3-1) and close to
20
the PF over the northern escarpment northeast of the islands (Sts. 3–5). The diffusivity estimates at A3-1 are similar in vertical structure but smaller in magnitude by a fac-tor of 3–4 than those estimated at the same station during the 2005 KEOPS1 cruise using the Osborn parameterization and a different method of overturn validation (Park et al., 2008). Note that most of these stations of elevated diffusivities are associated
25
BGD
11, 12137–12157, 2014
Validation of the Thorpe scale-derived
vertical diffusivities
Y.-H. Park et al.
Title Page
Abstract Introduction
Conclusions References
Tables Figures
◭ ◮
◭ ◮
Back Close
Full Screen / Esc
Printer-friendly Version
Interactive Discussion
Discussion
P
a
per
|
Discus
sion
P
a
per
|
Discussion
P
a
per
|
Discussion
P
a
per
|
other hand, the Winter Water layer (150–250 m) generally coincides with the layer of diffusivity minimum. In Subantarctic waters north of the Polar Front (Sts. TNS 1–2), on the contrary, the diffusion rate is quite low throughout the upper 400 m, resting close to its background level of O(10−5m2s−1).
On the E–W transect (Fig. 6b), the spatial distribution of K is quite complex
com-5
pared to the N–S section and there does not appear any simple pattern that can be easily connected to the frontal circulation of water masses. Nevertheless, we remark a relatively strong diffusion rate of O(10−4m2s−1) over much of the water column at E1–4W that is located close to the northward flowing PF along the escarpment east of the Kerguelen Islands, while the weakest rate of O(10−5m2s−1) is observed at TEW7
10
where an apparent southward intrusion of relatively warm Subantarctic surface water is associated with the southward retroflecting PF (see Fig. 1b). Other stations on the section show a highly undulating vertical structure with a moderate diffusion rate of <5×10⁻⁵m2s−1, in general.
5 Concluding remarks 15
We have validated the Thorpe scale-derived vertical diffusivities in the PF region east of the Kerguelen Islands in comparison with more direct estimates from the TurboMAP microprofiler measurements at selected stations during the KEOPS2 cruise. We have emphasized the need of a careful treatment of raw CTD data to obtain density profiles as fine as possible but with a maximum removal of random noise and measurement
20
errors. The comparative results are found to be sensitive to the choice of the param-eterization of diffusivity and the overturn validation criteria. The use of the Shih pa-rameterization (Eqs. 2 and 5) combined with a new overturn criterion ofRo=0.25 has
yielded far better results by a factor of 5 compared to the results obtained from the Os-born parameterization (Eqs. 1 and 6) and theRo=0.2 criterion (Gargett and Garner,
25
dif-BGD
11, 12137–12157, 2014
Validation of the Thorpe scale-derived
vertical diffusivities
Y.-H. Park et al.
Title Page
Abstract Introduction
Conclusions References
Tables Figures
◭ ◮
◭ ◮
Back Close
Full Screen / Esc
Printer-friendly Version
Interactive Discussion
Discussion
P
a
per
|
Discus
sion
P
a
per
|
Discussion
P
a
per
|
Discussion
P
a
per
|
fusivities. The Osborn parameterization is found to be much more sensitive to such an overestimation compared to the Shih parameterization. This study demonstrates that the Thorpe scale method is still a useful tool for studying the fine scale diff usivi-ties in the upper layer of the ocean if one makes judicious use of the combined Shih parameterization andRo=0.25 criterion.
5
The Thorpe scale-derived vertical diffusivities in the KEOPS2 region vary from a background level of O(10−5m2s−1) in the Winter Water layer to a relatively high level of O(10−4m2s−1) in the seasonal thermocline above the Winter Water. The latter feature is especially pronounced at stations over the shallow plateau southeast of the Kerguelen Islands and in the cold side of the PF running along the escarpment
north-10
east of the islands. On the other hand, at stations immediately north of the PF where warmer Subantarctic surface waters are encountered, diffusivity values are particularly low.
Acknowledgements. We thank the IPEV for financial and logistical support and the captain and crew of the R/VMarion Dufresnefor their professional contributions to various field experiments
15
during the 2011 KEOPS2 cruise.
References
Dillon, T. M.: Vertical overturns: a comparison of Thorpe and Ozmidov length scales, J. Geo-phys. Res., 87, 9601–9613, 1982.
Ferron, B., Mercier, H., Speer, K., Gargett, A., and Polzin, K.: Mixing in the Romanche fracture
20
zone, J. Phys. Oceanogr., 28, 1929–1945, 1998.
Frants, M., Damerell, G. M., Gille, S. T., Heywood, K. J., MacKinnon, J., and Springtall, J.: An assessment of density-based finescale methods for estimating dyapycnal diffusivity in the Southern Ocean, J. Atmos. Ocean. Tech., 30, 2647–2661, 2013.
Galbraith, P. S. and Kelley, D. E.: Identifying overturns in CTD profiles, J. Atmos. Ocean. Tech.,
25
13, 688–702, 1996.
BGD
11, 12137–12157, 2014
Validation of the Thorpe scale-derived
vertical diffusivities
Y.-H. Park et al.
Title Page
Abstract Introduction
Conclusions References
Tables Figures
◭ ◮
◭ ◮
Back Close
Full Screen / Esc
Printer-friendly Version
Interactive Discussion
Discussion
P
a
per
|
Discus
sion
P
a
per
|
Discussion
P
a
per
|
Discussion
P
a
per
|
Klymak, J. M., Pinkel, R., and Rainville, L.: Direct breaking of the internal tides near topography: Kara Ridge, Hawaii, J. Phys. Oceanogr., 38, 380–399, 2008.
Osborn, T. R.: Estimates of the local rate of vertical diffusion from dissipation measurements, J. Phys. Oceanogr., 10, 83–89, 1980.
Ozmidov, R. V.: On the turbulent exchange in a stably stratified ocean, Izv. Atmos. Ocean. Phy.,
5
1, 853–860, 1965.
Park, Y.-H., Fuda, J. L., Durand, I., and Naveira Garabato, A. C.: Internal tides and vertical mixing over the Kerguelen Plateau, Deep-Sea Res. Pt. II, 55, 582–593, 2008.
Park, Y.-H., Durand, I., Kestenare, E., Rougier, G., Zhou, M., d’Ovidio, F., Cotté, C., and Lee, J.-H.: Polar front around the Kerguelen Islands: an up-to-date determination and associated
10
circulation of surface/subsurface waters, J. Geophys. Res., submitted, 2014.
Shih, L. H., Koseff, J. R., Ivey, G. N., and Ferziger, J. H.: Parameterization of turbulent fluxes and scales using homogeneous sheared stably stratified turbulence simulations, J. Fluid Mech., 525, 193–214, 2005.
Thorpe, S. A.: Turbulence and mixing in a Scottish loch, Philos. T. Roy. Soc. Lond., 286A,
15
BGD
11, 12137–12157, 2014
Validation of the Thorpe scale-derived
vertical diffusivities
Y.-H. Park et al.
Title Page
Abstract Introduction
Conclusions References
Tables Figures
◭ ◮
◭ ◮
Back Close
Full Screen / Esc
Printer-friendly Version
Interactive Discussion
Discussion
P
a
per
|
Discus
sion
P
a
per
|
Discussion
P
a
per
|
Discussion
P
a
per
|
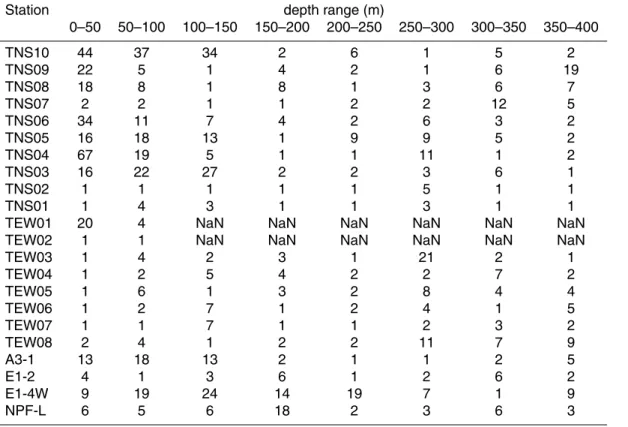
Table 1.50 m averaged vertical diffusivities (in 10−5
m2s−1
) at A3-1 estimated from the Thorpe scale method using the Shih parameterization and theRo=0.2 criterion.
Station depth range (m)
0–50 50–100 100–150 150–200 200–250 250–300 300–350 350–400
TNS10 44 37 34 2 6 1 5 2
TNS09 22 5 1 4 2 1 6 19
TNS08 18 8 1 8 1 3 6 7
TNS07 2 2 1 1 2 2 12 5
TNS06 34 11 7 4 2 6 3 2
TNS05 16 18 13 1 9 9 5 2
TNS04 67 19 5 1 1 11 1 2
TNS03 16 22 27 2 2 3 6 1
TNS02 1 1 1 1 1 5 1 1
TNS01 1 4 3 1 1 3 1 1
TEW01 20 4 NaN NaN NaN NaN NaN NaN
TEW02 1 1 NaN NaN NaN NaN NaN NaN
TEW03 1 4 2 3 1 21 2 1
TEW04 1 2 5 4 2 2 7 2
TEW05 1 6 1 3 2 8 4 4
TEW06 1 2 7 1 2 4 1 5
TEW07 1 1 7 1 1 2 3 2
TEW08 2 4 1 2 2 11 7 9
A3-1 13 18 13 2 1 1 2 5
E1-2 4 1 3 6 1 2 6 2
E1-4W 9 19 24 14 19 7 1 9
BGD
11, 12137–12157, 2014
Validation of the Thorpe scale-derived
vertical diffusivities
Y.-H. Park et al.
Title Page
Abstract Introduction
Conclusions References
Tables Figures
◭ ◮
◭ ◮
Back Close
Full Screen / Esc
Printer-friendly Version
Interactive Discussion
Discussion
P
a
per
|
Discus
sion
P
a
per
|
Discussion
P
a
per
|
Discussion
P
a
per
|
Figure 4.Different diffusivity profiles at A3-1 calculated with different pairs of parameterization (Osborn or Shih) and observational method (Thorpe scaleLTor TurboMAP-derivedε) using the
BGD
11, 12137–12157, 2014
Validation of the Thorpe scale-derived
vertical diffusivities
Y.-H. Park et al.
Title Page
Abstract Introduction
Conclusions References
Tables Figures
◭ ◮
◭ ◮
Back Close
Full Screen / Esc
Printer-friendly Version
Interactive Discussion
Discussion
P
a
per
|
Discus
sion
P
a
per
|
Discussion
P
a
per
|
Discussion
P
a
per
|
Figure 5. Ratio profiles of the Thorpe scale-derived diffusivities and the TurboMAP-derived diffusivities at all intercomparison stations based on(a)the Osborn parameterization and(b)
BGD
11, 12137–12157, 2014
Validation of the Thorpe scale-derived
vertical diffusivities
Y.-H. Park et al.
Title Page
Abstract Introduction
Conclusions References
Tables Figures
◭ ◮
◭ ◮
Back Close
Full Screen / Esc
Printer-friendly Version
Interactive Discussion
Discussion
P
a
per
|
Discus
sion
P
a
per
|
Discussion
P
a
per
|
Discussion
P
a
per
|
Figure 6. Thorpe scale-derived diffusivity sections (calculated using the Shih parameteriza-tion and theRo=0.25 criterion) of the upper 400 m on(a)the N–S transect and(b)the E–W transect (top panels; see Fig. 1 for locations of the transects and stations). DiffusivityKvalues, which range from 10−5
m2s−1
to 7×10⁻⁴
m2s−1
, are shown in log (K). White and black lines correspond toK =10−4
m2s−1
andK =5×10⁻⁵
m2s−1